This article focuses on what we are paying attention to in the next 48 to 72 hours. The article also includes weather maps for longer-term U.S. outlooks (up to four weeks) and a six-day World weather outlook which can be very useful for travelers.
First the NWS Short Range Forecast. The afternoon NWS text update can be found here after about 4 p.m. New York time but it is unlikely to have changed very much from the morning update. The images in this article automatically update.
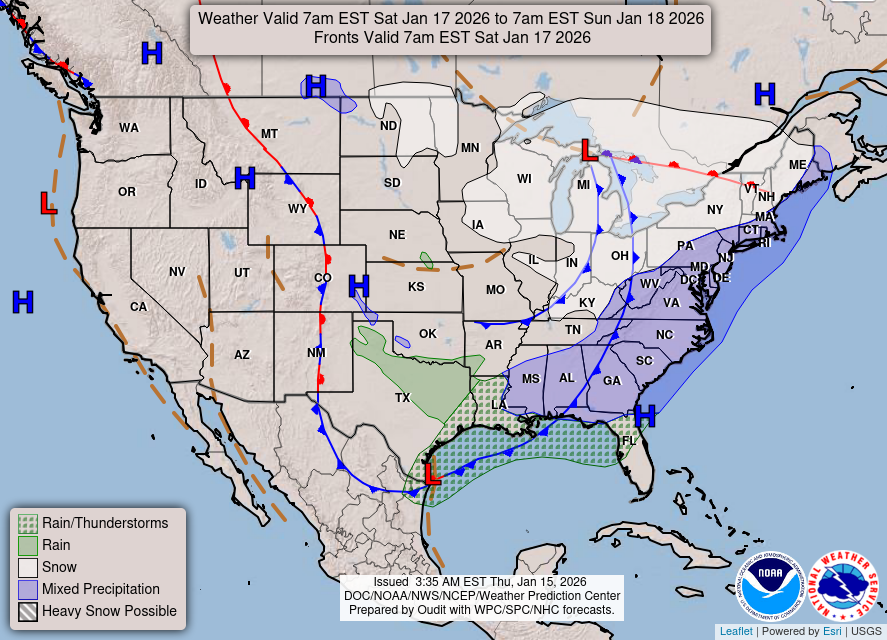
Short Range Forecast Discussion
NWS Weather Prediction Center College Park MD
Wed Feb 12 2025
Valid 12Z Wed Feb 12 2025 – 12Z Fri Feb 14 2025…Moderate Risk of excessive rainfall over parts of Southern California
on Thursday; There is a Slight Risk of excessive rainfall over parts of
Northern/Central California and Lower Mississippi Valley to the Southern
Appalachians on Wednesday……Rain/freezing rain over parts of the Mid-Atlantic/Central Appalachians
to Lower Great Lakes with 0. 25 inches of ice accumulations possible on
Wednesday: Rain/freezing rain over parts of the Southern Plains to the
Ohio Valley/Great Lakes with 0. 10 inches of ice accumulations possible on
Wednesday……Rain/freezing rain over parts of the Pacific Northwest with 0. 10
inches of ice accumulations possible on Wednesday into Thursday;
Rain/freezing rain over parts of Northeast the with 0. 01 inches of ice
accumulations possible on Thursday……There is a Slight Risk of Severe Thunderstorms over parts of the Lower
Mississippi Valley and the Southeast on Wednesday……Temperatures will be 25 to 35 degrees below average across the Northern
Rockies eastward to the Upper Mississippi Valley and southward to the
Southern Plains…On Wednesday, an Arctic high over the Northern Intermountain Region to the
Northern Plains will slowly move southeastward to the Ohio Valley/Central
Appalachians by Friday. The cold air associated with the high will bring
temperatures 25 to 35 degrees below average across the Northern Rockies
eastward to the Upper Mississippi Valley and southward to the Southern
Plains. The cold temperatures have prompted an Extreme Cold Warning over
the Northern Rockies to the Northern Plains.South of the Artic High, a front extending from the Southeast to the
Southern Rockies and then to the Great Basin will spawn a wave of low
pressure over the Tennessee Valley that moves northeastward to southeast
Ontario, Canada, by Thursday and then into Southeastern Canada by Friday.
On Wednesday evening, the associated front over the Tennessee Valley will
move off the Eastern Seaboard by Thursday evening.The system will spread snow from the Central Plains into the Great Lakes
on Wednesday and into far northern New England by Wednesday night and
early Thursday. In Addition, bursts of heavy snow, accumulating at times
to an inch per hour, may lead to hazardous driving conditions and disrupt
travel. Heavier snow rates should develop in time for the evening rush
hour in Milwaukee, Chicago, Grand Rapids, and Detroit, among other
locations. Plan ahead if you are commuting. Further, a wintry mix of snow,
sleet, and freezing rain on the south side of the main snow band will lead
to hazardous travel conditions elsewhere in the Midwest and Northeast.Moreover, a damaging freezing rain, ice event, will continue on Wednesday,
particularly in the Blue Ridge from far northwest North Carolina into
western Virginia and the Allegheny Mountains near the West Virginia and
Virginia border, with 0.25 inches of ice accumulations. Dangerous travel
is expected; power outages and tree damage are likely.Furthermore, moisture from the Gulf will stream northward over the
Southern Plains, Lower Mississippi Valley, and the Southeast on Wednesday.
The moisture will aid in producing showers and severe thunderstorms over
parts of the Lower Mississippi Valley and Southeast. Therefore, the SPC
has issued a Slight Risk (level 2/5) of severe thunderstorms over parts of
the Lower Mississippi Valley and Southeast through Thursday morning. The
hazards associated with these thunderstorms are frequent lightning, severe
thunderstorm wind gusts, hail, and a few tornadoes.Moreover, the showers and thunderstorms will have heavy rain. Therefore,
the WPC has issued a Slight Risk (level 2/4) of excessive rainfall over
parts of the Lower Mississippi Valley into the Southern Appalachians
through Thursday morning. The associated heavy rain will create mainly
localized areas of flash flooding, with urban areas, roads, small streams,
and low-lying areas the most vulnerable. On Thursday, the threat of severe
thunderstorms and excessive rainfall will decrease to a marginal risk over
the Southeast.Meanwhile, on Wednesday, a storm over the Eastern Pacific will begin to
move onshore over the West Coast. The system will produce rain and
higher-elevation snow over parts of Central/Southern California. As the
storm moves farther inland, heavy rain will arrive late Wednesday Night in
Central California and then spread inland into the Central Valley and down
the coast to Southern California on Thursday. The heavy rain may cause
flooding in urban areas and small streams, as well as some minor river
flooding. Therefore, the WPC has issued a Slight Risk (level 2/4) of
excessive rainfall over parts of Central California through Thursday
morning. The associated heavy rain will create mainly localized areas of
flash flooding, with urban areas, roads, small streams, and burn scars the
most vulnerable.The risk of flash flooding will be highest in and near recent burn scar
areas in Southern California. Flooding may include debris flows. People
living in or near recently burned areas should listen carefully to
instructions from local officials.On Thursday, the threat of excessive rainfall increases over Southern
California. Therefore, the WPC has issued a Moderate Risk (level 3/4) of
excessive rainfall over parts of Southern California from Thursday into
Friday morning. Numerous flash flooding events are possible. Many streams
may flood, potentially affecting larger rivers. Flooding may include
debris flows in or near recently burned areas.Also, on Thursday, coastal rain and higher-elevation snow will move into
the Pacific Northwest. Additionally, snow will spread into much of the
Western U.S. Thursday and Friday. The heaviest snow is expected in the
Sierra Nevada and Northern California mountains. Snow levels will rise
through the event, but heavy snow will likely cause dangerous travel at
many mountain passes due to snow-covered roads and low visibility.
Significant snow is also likely in the mountains of Utah and western
Colorado. Ice accumulations are possible in northwest Oregon.
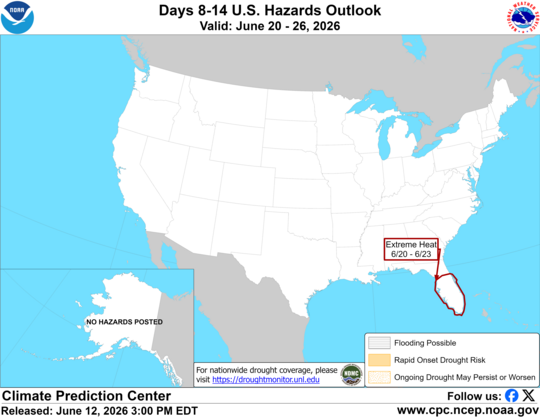
To get your local forecast plus active alerts and warnings click HERE and enter your city, state or zip code. If the Hazards Outlook is not updated click here but remember it does not update during the weekend.

Learn about wave patterns HERE.
Then, looking at the world and of course, the U.S. shows here also. Today we are looking at precipitation.
Please click on “Read More” below to access the full Daily Report issued today.
| Notices: What would you like to learn about? Please provide that to me via the comment section at the end of the article. |
Now more detail on the 48-Hour Forecast (It is a 48 to 72 Hour Forecast actually)
Daily weather maps. The Day 1 map updates twice a day and the Day 2 and 3 maps update only once a day. These maps update automatically. But if that does not happen, you can get updates by clicking HERE
TODAY (or late in the day the evening/overnight map will appear) (Key to surface fronts shown on maps and you will then also be able to insert a city name or zip code and get a local NWS forecast).

TOMORROW

NEXT DAY
We have a new animation of the forecast which shows how things may play out over the next 60 hours. To update click ANIMATION. Doing so will get you to the dashboard. You can then step through the animation or hit LOOP on the upper right of the display. You will have to hit the back arrow ← at the top left on your computer to get back into this article. It is a little more trouble than before but I think NOAA scrapped the animation routine I was using so we have to keep up with “progress”.
The NWS Climate Prediction Center’s: Watches, Warnings, and Advisories plus other information can be found HERE. That takes you to the NWC Severe Weather Site. From there you can select among many categories of information. Remember to hit the back arrow ← at the top left of your screen to return to this article.
ATMOSPHERIC RIVERS
This tells us what is approaching the West Coast. Click HERE to update If I have not gotten around to doing the update. Here is some useful information about Atmospheric Rivers.

Below is the current five-day cumulative forecast of precipitation (Updates can be found HERE)

Ski SnowReports
New Feature – Ski Reports. It is difficult to find reports that auto-update on-screen (and they are very long) but these links will get you to them – If you have additional suggestions make them in the comments section after every Econcurrents Article and we may add those links. We will try to not have too much overlap as that can add to the confusion.
Snow Forecasts. And remember this shows natural snow. Ski resorts also make their own snow.
Day 1

Day 2

Now we look at Intermediate-Term “Outlook” maps for three time periods. Days 6 – 10, Days 8 – 14, and Weeks 3 and 4. An outlook differs from a forecast based on how NOAA uses these terms in that an “outlook” presents information as deviation from normal and the likelihood of these deviations.
Below are the links to obtain updates and additional information. They are particularly useful if you happen to be reading this article significantly later than when it was published. I always try to provide readers with the source of the information in my articles. These links may also be useful for those viewing this article on a cell phone or other small screen.
| Days 6 – 10 (shown in Row 1) | Days 8 – 14 (Shown in Row 2) | Weeks 3 and 4 (Shown in Row 3 but updates only on Fridays) |
| https://www.cpc.ncep.noaa. gov/products/predictions/610day/ | https://www.cpc.ncep .noaa.gov/products/predictions/814day/ | https://www.cpc.ncep.noaa.gov/products/predictions/WK34/ |
Showing the actual maps. They should now update automatically. The Week 3 – 4 Outlook only updates on Fridays. So below is what I call the Intermediate-term outlook. On Fridays, it extends out 28 Days. That declines day by day so on Thursday it only looks out 22 days until the next day when the Week 3 – 4 Outlook is updated and this extends the outlook by one additional week.
| 6–
10
|
|
|
| 8–
14 |
|
|
| 3–
4 |
|
|


HAZARDS OUTLOOKS
Click here for the latest complete Day 3 -7 Hazards forecast which updates only on weekdays. Once a week probably Monday or Tuesday I will update the images. I provided the link for readers to get daily updates on weekdays. Use your own judgment to decide if you need to update these images. I update almost all the images Friday Night for the weekend edition of this Weather Report. So normally readers do not need to update these images but if the weather is changing quickly you may want to.
Temperature month to date can be found at https://hprcc.unl.edu/products/maps/acis/MonthTDeptUS.png
Precipitation month to date can be found at https://hprcc.unl.edu/products/maps/acis /MonthPNormUS.png
World Forecast [that website is has been intermittent so be patient]
Below are the Day 1 -3 and 4-6 forecasts for temperature and precipitation. Updates and much additional information can be obtained HERE
World Temperature Anomalies


World Accumulated Precipitation


This information is provided by the University of Maine. They draw upon many different sources. There is a lot of information available at the link provided. I have just provided two useful forecasts. There are probably over a hundred different forecasts available from this source.
Worldwide Tropical Forecast (This is a NOAA Product)

This graphic updates on Tuesdays) If it has not been updated, you can get the update by clicking here Readers will only have to do that if they are reading this article much later than the date of it being published.
Information on Tropical Storms can be found HERE. Western Pacific information can be found HERE. Note that unless there is an out-of-season storm the below images will not update until the National Hurricane Center starts their seasonal update of these maps on June 1. I include them simply because there can be an out-of-season event in which case it should show up in these maps.


–
| I hope you found this article interesting and useful. |