The mission of the National Weather Service Colorado Basin River Forecast Center (CBRFC) is to produce river, flood, and water supply forecasts for the Colorado Basin and the Great Basin in support of saving lives and property and to enhance the region’s environment and economy. The Colorado Basin River Forecast Center (CBRFC) geographic forecast area includes the Upper Colorado River Basin (UCRB), Lower Colorado River Basin (LCRB), and Eastern Great Basin (GB). You can access their website HERE.
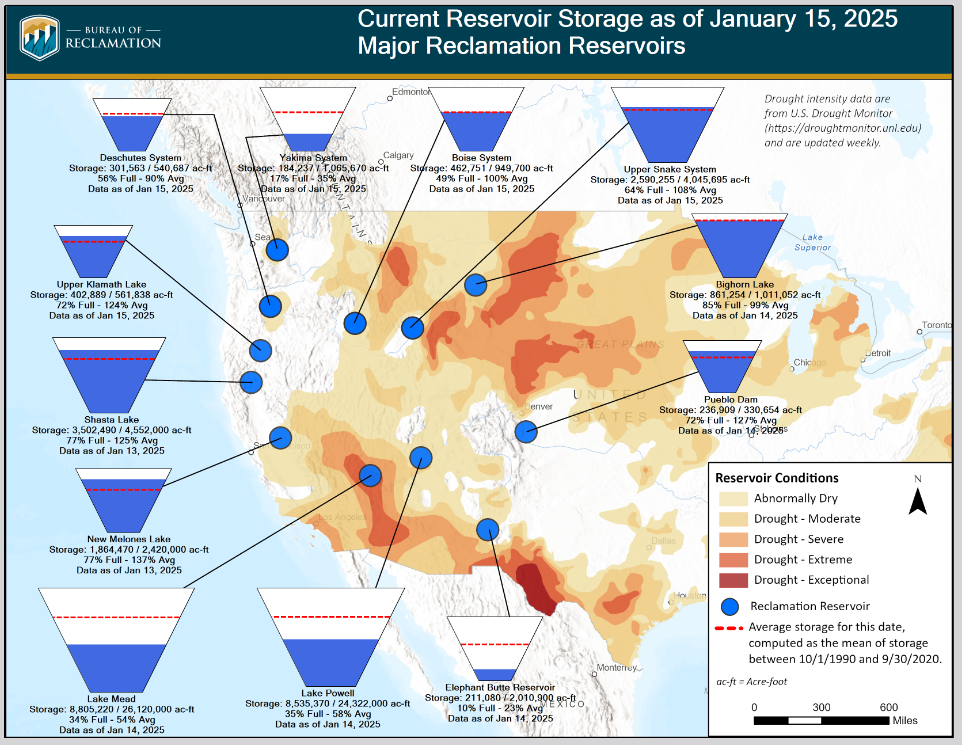
I have also included information on the current BOR reservoir storage levels including some that are outside of the Colorado River Basin. I also provide information on New Mexico which is partly in the Colorado Basin and mostly outside of the Colorado Basin.
The image below shows part of the area covered in the CBRFC Report. The map shown here is only the Colorado Basin. The Eastern Great Basin is to the west of this map. The maps shown in the article cover both basins but are not as scenic as this map.
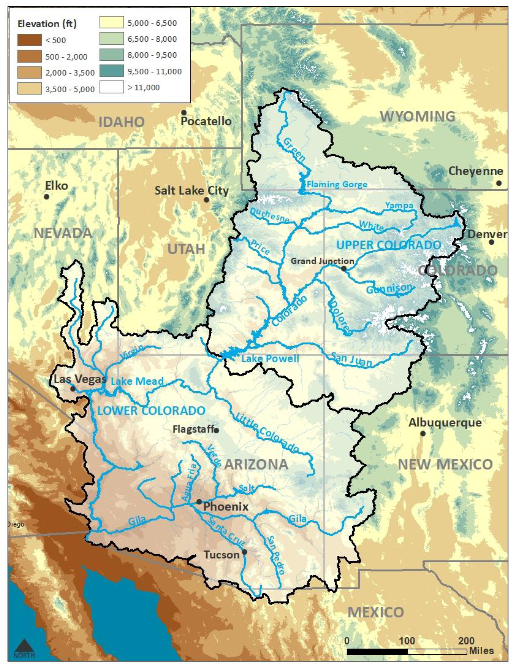
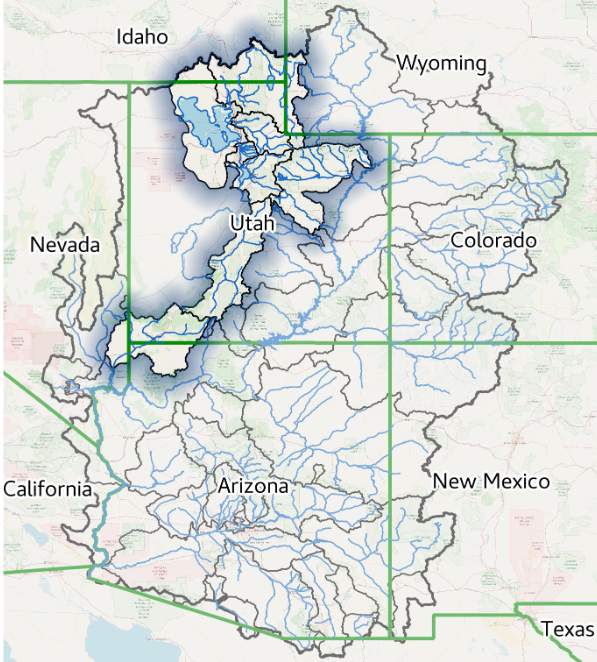
Map showing both the Colorado Basin and Eastern Great Basin.
Please click on “Read More” to read the rest of this article.
The Colorado Basin River Forecast Center (CBRFC) geographic forecast area includes the Upper
Colorado River Basin (UCRB), Lower Colorado River Basin (LCRB), and Eastern Great Basin (GB).
Water Supply Forecasts
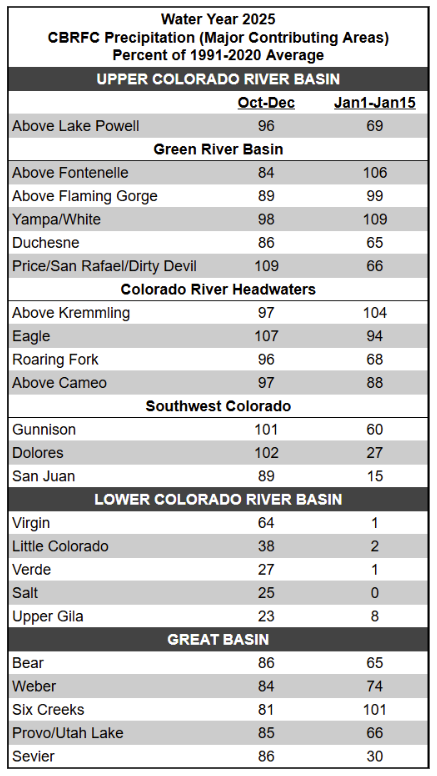
Water Year Precipitation
The beginning of water year 2025 featured a persistent northerly storm track. This kept rain and snowfall
confined to the UCRB and GB, where water year-to-date (October–December) precipitation totals are
near average for most of the area. In the LCRB, it is one of the driest starts to winter on record, with the
near entirety of the region picking up zero measurable precipitation in December 2024. Precipitation
during the first half of January continued to target northern basins while southern basins received well
below normal precipitation. Water year precipitation-to-date is detailed in the figures and table below.
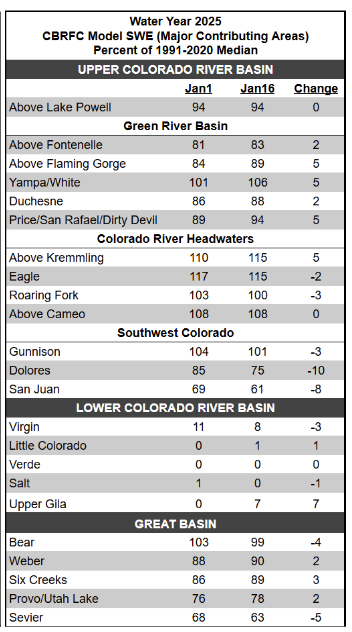
Snowpack Conditions
UCRB mid-January snow water equivalent (SWE) conditions range between 60-115% of normal and are
most favorable across west-central CO areas including the White/Yampa, Colorado River headwaters,
and Gunnison. SWE is below normal elsewhere across the UCRB, with the least favorable conditions in
the San Juan River Basin. UCRB January 15 snow covered area is around 65% of the 2001-2024
median.1 LCRB mid-January SWE conditions are at or near record low across southwest UT, central AZ,
and west-central NM due to much drier than normal winter weather.
GB mid-January SWE conditions range between 65-100% of normal and generally improve from south to
north. January 15 snow covered area across UT is around 35% of the 2001-2024 median.1 SWE
conditions are summarized in the figure and table below.
The mid-January water supply outlook is summarized in the table below. Snowpack, soil
moisture, and future weather are the primary hydrologic conditions that impact the water supply outlook.
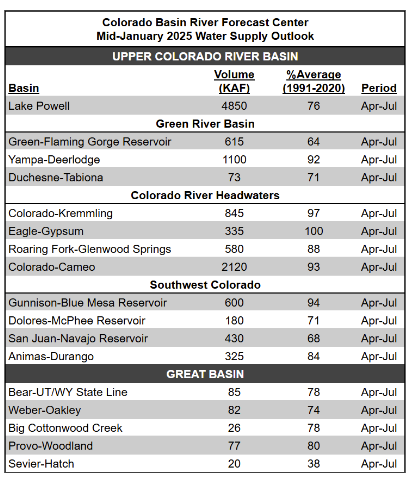
It is early in the water year so this initial analysis is just a guide but with the predicted La Nina the water supply situation prior to the Monsoon would appear to be not good.
For updated SNOTEL information click HERE
For CBRFC hydrologic model snow click HERE
For CBRFC’s beginning-of-the-month online publication that contains basin conditions, summary graphics,
and end-of-month reservoir content tables refer to the following links.
Basin Conditions and Summary Graphics
Green River Basin
Upper Colorado River Basin
San Juan River Basin
Great Salt Lake Basin
Sevier River Basin
Virgin River Basin
End Of Month Reservoir Content Tables
Green River Basin
Upper Colorado River Basin
San Juan River Basin
Great Salt Lake Basin
Sevier Basin
Explanation of Abbreviations

That completes what we are reporting for CBRFC. From a Different Source (USBR.gov) and Covering a Larger Area and with some more recent data:

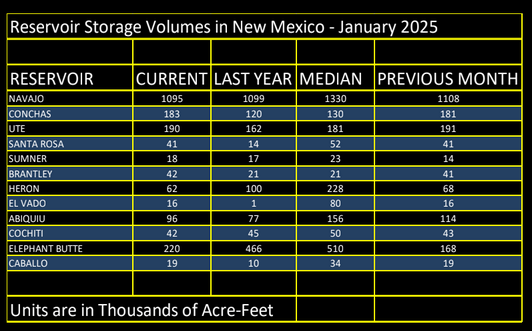
| The Monsoon gave New Mexico a good start. This is likely to look worse as the winter continues. I am sorry that it is difficult to read. If you enlarge it a bit it is easier to read. |
The Full New Mexico Water Supply Report for January 1, 2025 can be accessed HERE. Prior and future reports can be obtained HERE.
–
| I hope you found this article interesting and useful. |
–