“Synopsis: La Niña is favored to emerge in September-November (60% chance) and is expected to persist through January-March 2025. ”
So we are really in ENSO Neutral but NOAA may not want to admit their forecast was wrong so they present it as waiting for La Nina. It is correct that we are in La Nina Watch but it is also correct that we currently remain in ENSO Neutral.
On the second Thursday of every month, NOAA (really their Climate Prediction Center CPC) issues its analysis of the status of ENSO. This includes determining the Alert System Status. NOAA now describes their conclusion as “ENSO Alert System Status: La Nino Watch”
The exact timing of the transition is now perhaps more clear which should increase the reliability of the Seasonal Outlook to be issued next Thursday.
We have included an ENSO Blog article by Emily Becker.
CLIMATE PREDICTION CENTER ENSO DISCUSSION (LINK)
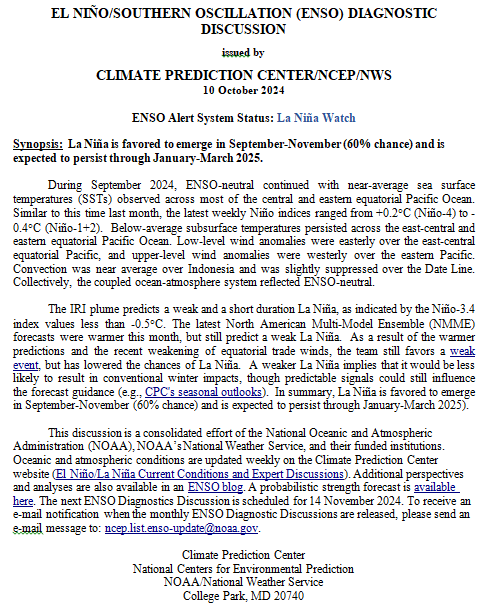
| The second paragraph is what is important:
“The IRI plume predicts a weak and a short duration La Niña, as indicated by the Niño-3.4 index values less than -0.5°C. The latest North American Multi-Model Ensemble (NMME) forecasts were warmer this month, but still predict a weak La Niña. As a result of the warmer predictions and the recent weakening of equatorial trade winds, the team still favors a weak event, but has lowered the chances of La Niña. A weaker La Niña implies that it would be less likely to result in conventional winter impacts, though predictable signals could still influence the forecast guidance (e.g., CPC’s seasonal outlooks). In summary, La Niña is favored to emerge in September-November (60% chance) and is expected to persist through January-March 2025).” Below is the middle paragraph from the discussion last month. “The IRI plume predicts a weak and a short duration La Niña, as indicated by the Niño-3.4 index values less than -0.5°C (Fig. 6). This month, the team relies more on the latest North American Multi-Model Ensemble (NMME) guidance, which predicts La Niña to emerge in the next couple of months and continue through the Northern Hemisphere winter. The continuation of negative subsurface temperatures and enhanced low-level easterly wind anomalies supports the formation of a weak La Niña. A weaker La Niña implies that it would be less likely to result in conventional winter impacts, though predictable signals could still influence the forecast guidance (e.g., CPC’s seasonal outlooks). In summary, La Niña is favored to emerge in September-November (71% chance) and is expected to persist through January-March 2025 (Fig. 7).” |
We now provide additional details.
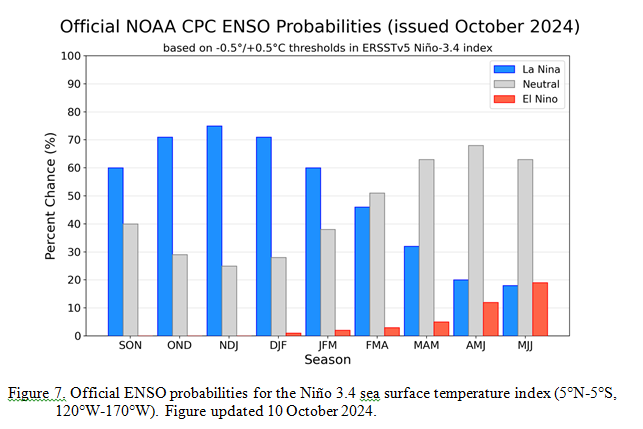
CPC Probability Distribution
Here are the new forecast probabilities. The probabilities are for three-month periods e.g. ASO stands for August/September/October.
![]() Here is the forecast from last month.
Here is the forecast from last month.
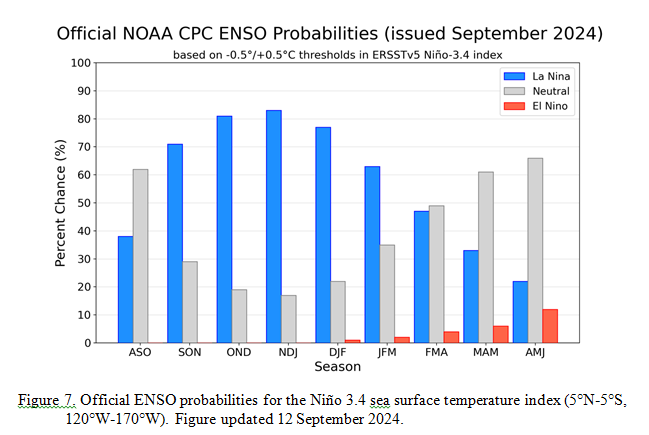

| The analysis this month and last month are a bit different with again the transition to La Nina being slightly slower than thought last month. Also the probabilities of a La Nina are lower than estimated last month. This seems to be a trend. The chart is clearer than the discussion in the summary report above. The La Nina is a bit slower to arrive. I am not sure that we will actually have a La Nina. |
This graphic from Emily Becker’s ENSO Blog Post says it all.
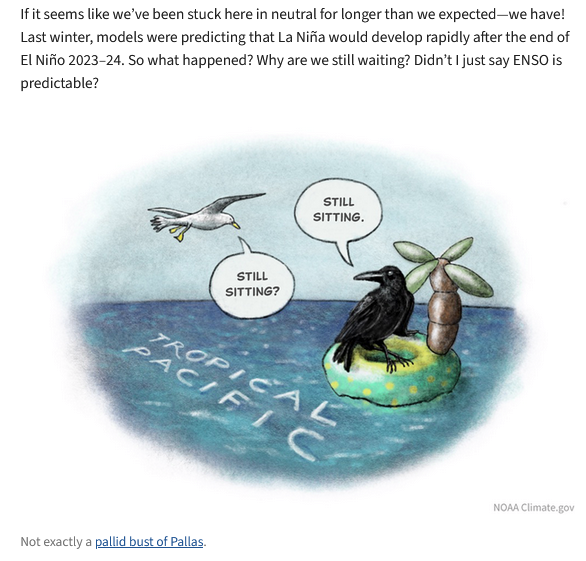
| We have been waiting for this La Nina a long time. |
Some will need to click on “Read More” to read the rest of this article.
What Does the NOAA Proprietary ENSO Model Forecast?
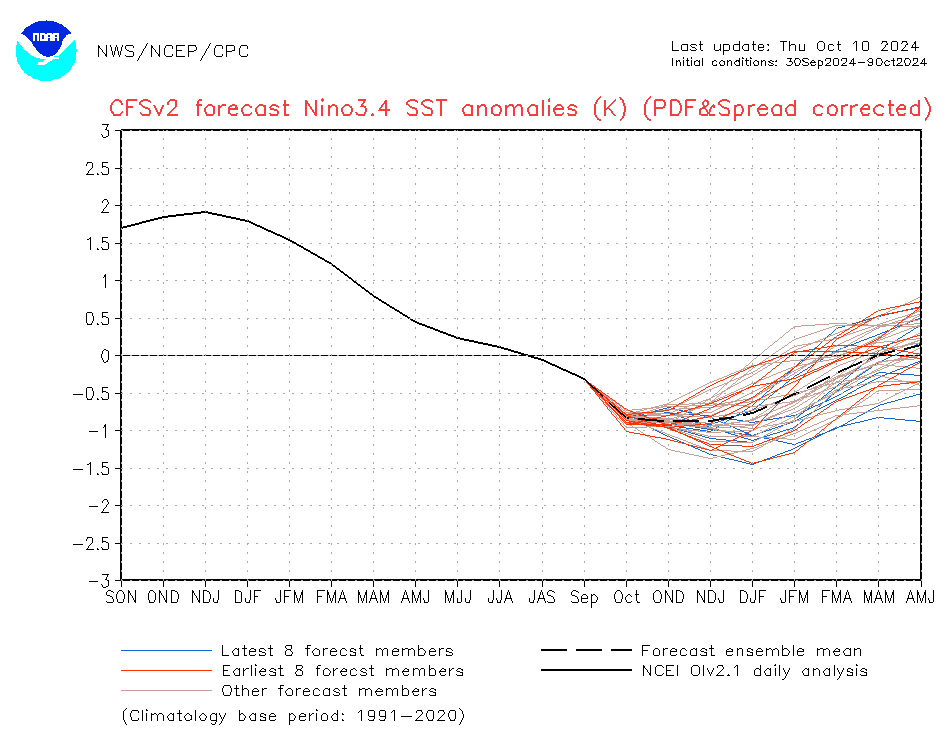
| Notice the wide spread of the solutions. If you want to see an updated version you can view an updated version by clicking HERE. This is not the official CPC forecast but a secondary tool that they use. It shows a fairly modest La Nina coming. |
View of other Models.
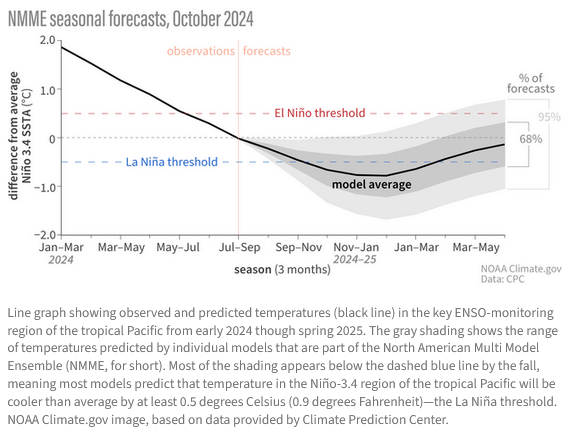
| This seems to be a favorite model of NOAA and it also shows a short weak La Nina. |
I do not yet have the JAMSTEC forecasts.
Looking at Actual Current Conditions.
NOAA reports some derived data that describes the current situation and a forecast. But what if we want to form our own opinion? After all, meteorologists are looking at the actual current situation and making predictions.
This shows the current situation for the surface of oceans. To update this graphic click HERE.
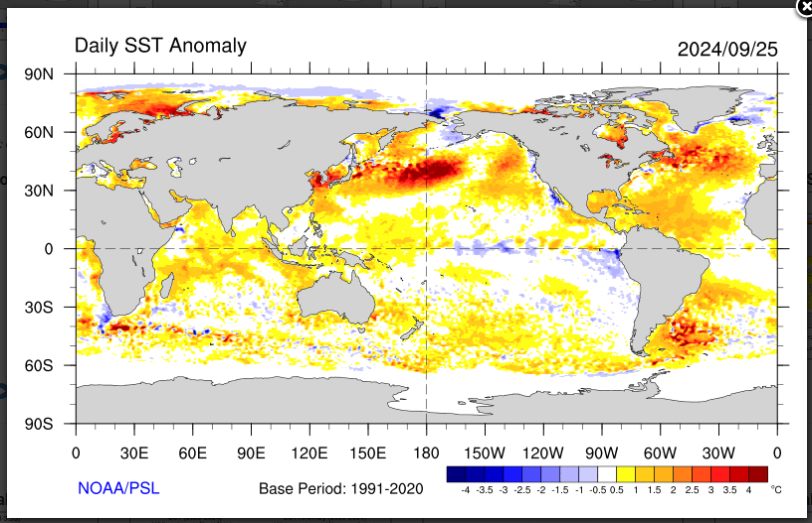
| You can see some cool water along the Equator but it is not a lot. We are discussing ENSO tonight but you can see a lot of interesting things here. It is only a one-day snapshot so keep that in mind. There is not much warm water along any coast of the United States. There is cool water along the western coast of South America and that might support the creation of La Nina conditions. |
Putting the historical information in motion. Updates can be found HERE. but should not be needed.

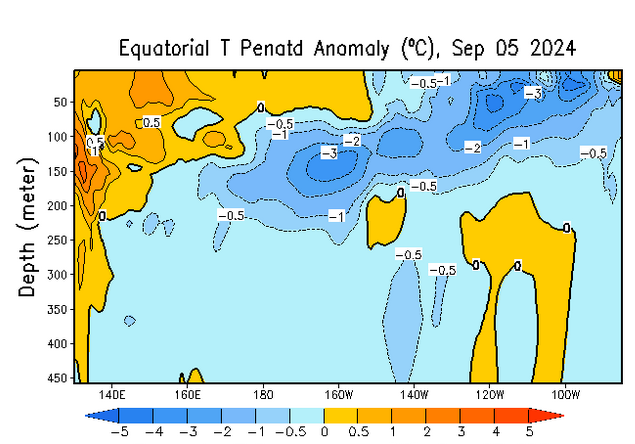
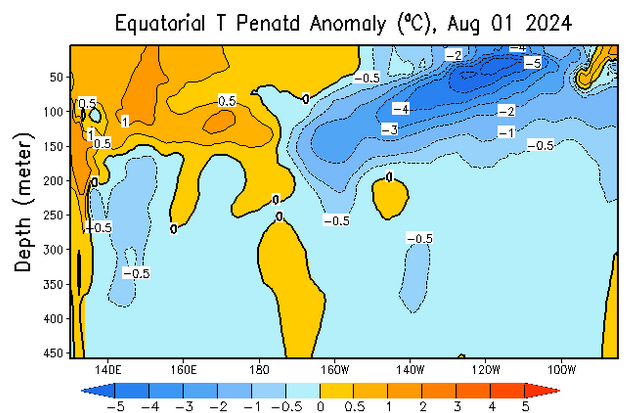
Now we look at the below surface temperature anomalies. Mapping the details. (Cross-Section along the Equator). The data is a five-day average centered on the date shown.
Here is the new map followed by the prior two months to show the progression. The undercutting of the warm water by the cooler water is clear but when does it reach the surface?
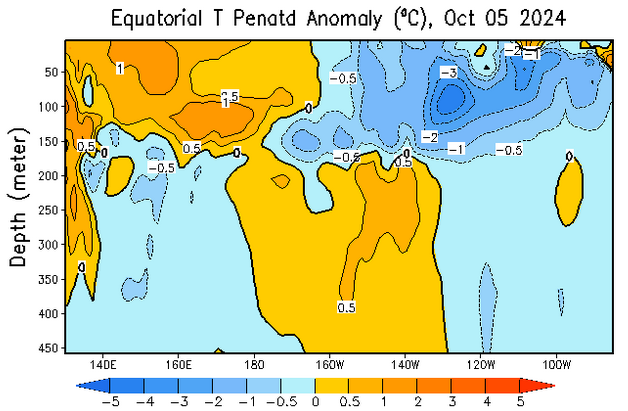
| I am not sure that this La Nina is developing the way the CPC claims that it is. I would not be shocked if it did not develop at all. But a short weak La Nina is the forecast and probably will happen. It seems to be a bit more convincing this month. |
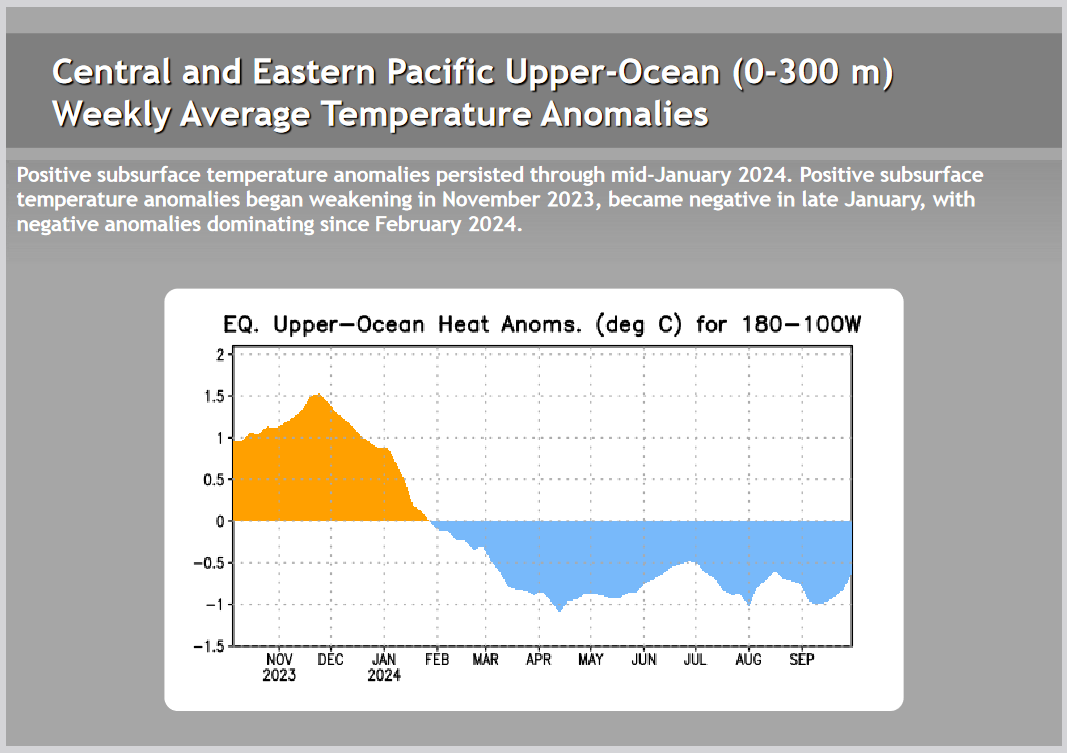
| This shows the water column anomaly is now negative i.e. the warmer water near the surface is dominated by the cooler water below. But the forecast is not for this La Nina to get very intense. |
Kelvin Waves
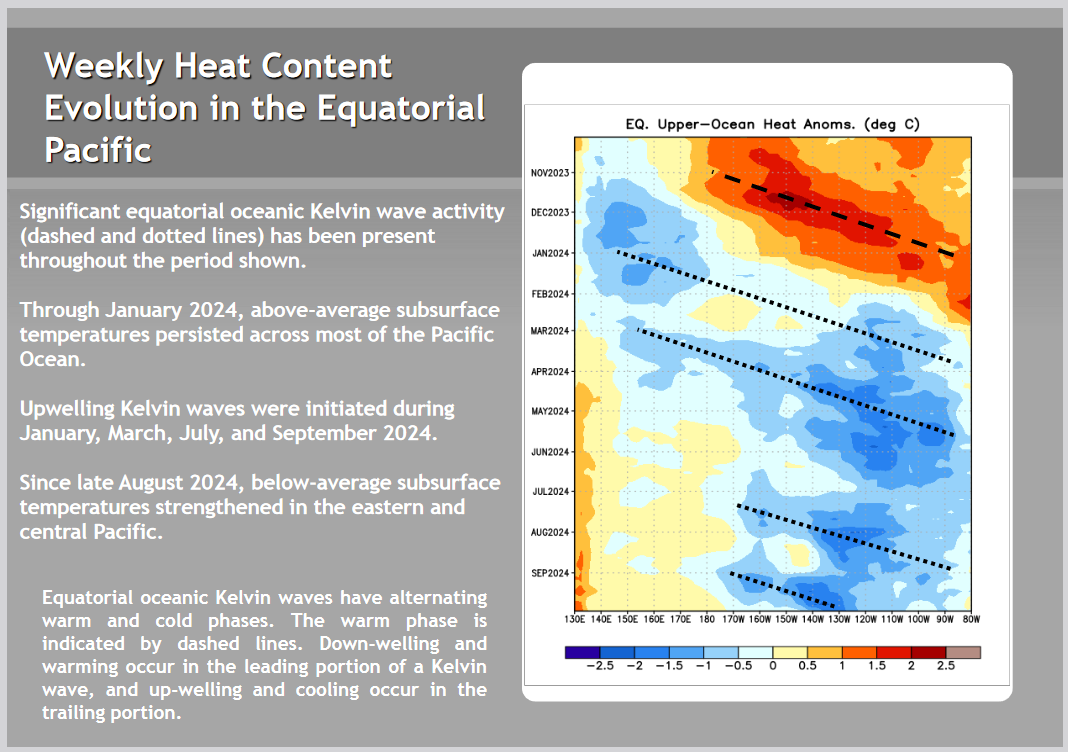
Are they now predicting another downwelling Kelvin Wave? More skepticism on my part related to Outlook. But I am beginning to think that this La Nina will happen soon but be marginal. |
Is the response of the atmosphere sufficient to sustain an El Nino? This made me want to take a look at the SOI Index, HERE is the U.S. version. HERE is the link to the Australia Bureau of Meteorology version of that graph. I prefer the BOM version but there could be an argument that the U.S. version is more accurate but I am not convinced of that. The BOM version dates back to when meteorological stations were more practical on land so they were not exactly on the Equator as is the U.S. version.
With respect to the BOM version,
“The Southern Oscillation Index, or SOI, gives an indication of the development and intensity of El Niño or La Niña events in the Pacific Ocean. The SOI is calculated using the pressure differences between Tahiti and Darwin.
Sustained negative values of the SOI below −7 often indicate El Niño episodes. These negative values are usually accompanied by sustained warming of the central and eastern tropical Pacific Ocean, a decrease in the strength of the Pacific Trade Winds, and a reduction in winter and spring rainfall over much of eastern Australia and the Top End. You can read more about historical El Niño events and their effect on Australia in the Detailed analysis of past El Niño events.
Sustained positive values of the SOI above +7 are typical of a La Niña episode. They are associated with stronger Pacific trade winds and warmer sea temperatures to the north of Australia. Waters in the central and eastern tropical Pacific Ocean become cooler during this time. Together these give an increased probability that eastern and northern Australia will be wetter than normal. You can read more about historical La Niña events and their effect on Australia in the Detailed analysis of past La Niña events.”
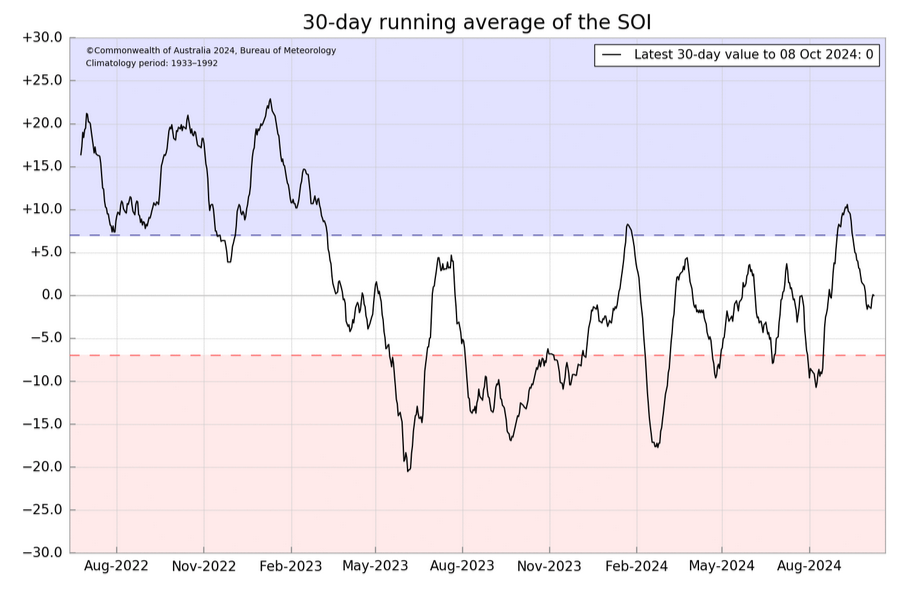
| The SOI is now in ENSO neutral territory. This is a change from last month. And not an indicator that we are in or soon will be in a La Nina. |
Now we present the recent ENSO Blog Post by Emily Becker.
You can read her full article HERE.
This animation shows weekly sea surface temperatures in the Pacific Ocean compared to average from July 1–September 29, 2024. Orange and red areas were warmer than average; blue areas were cooler than average. Warmer-than-average sea surface temperatures in the key ENSO-monitoring region of the tropical Pacific (outlined with black box) have started to be replaced by cooler-than-average waters—a sign that La Niña may be brewing. NOAA Climate.gov animation, based on Coral Reef Watch Data and maps from NOAA View. View the full-size version in its own browser window.
This is another graphic from her blog post.
| We have been waiting for this La Nina a long time. |
| I hope you found this article interesting and useful. |