At the end of every month, NOAA updates its Outlook for the following month which in this case is October of 2024. We are reporting on that tonight.
There have been some significant changes in the Outlook for October and these are addressed in the NOAA Discussion so it is well worth reading. We provided the prior Mid-Month Outlook for October for comparison. It is easy to see the substantial changes in the weather outlook by comparing the Mid-Month and Updated Maps.
The article includes the Drought Outlook for October. NOAA also adjusted the previously issued Seasonal (OND) Drought Outlook to reflect the changes in the October Drought Outlook. We also provide the Week 2/3 Tropical Outlook for the World.
The best way to understand the updated outlook for October is to view the maps and read the NOAA discussion. I have highlighted the key statements in the NOAA Discussion.
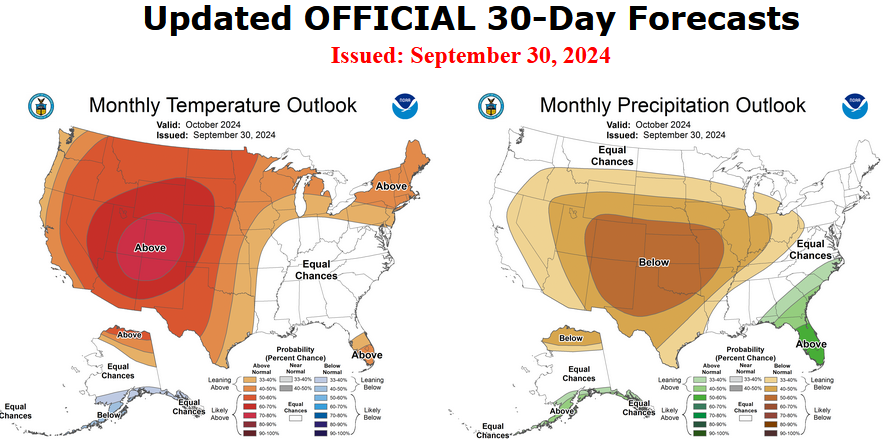
Here is the updated Outlook for October 2024.
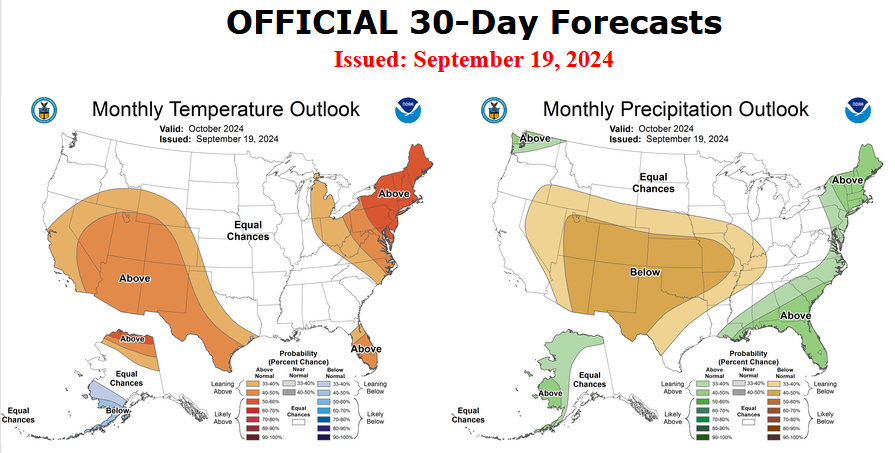
For Comparison Purposes, Here is the earlier Mid-Month Outlook for October
| It is important to remember that the maps show deviations from the current definition of normal which is the period 1991 through 2020. So this is not a forecast of the absolute value of temperature or precipitation but the change from what is defined as normal or to use the technical term climatology.
It is a substantial change from what was issued on September 19, 2024. Remember, it is the first set of maps that are the current outlook for October. One expects some changes 11 days later. However, the changes to the updated October Outlook are fairly significant. This then gives us some reason to question the (September 19, 2024) three-month OND temperature and precipitation Outlooks which are shown in the following graphic. |
NOAA provided a combination of the Updated Outlook for October and the Three-Month Outlook.
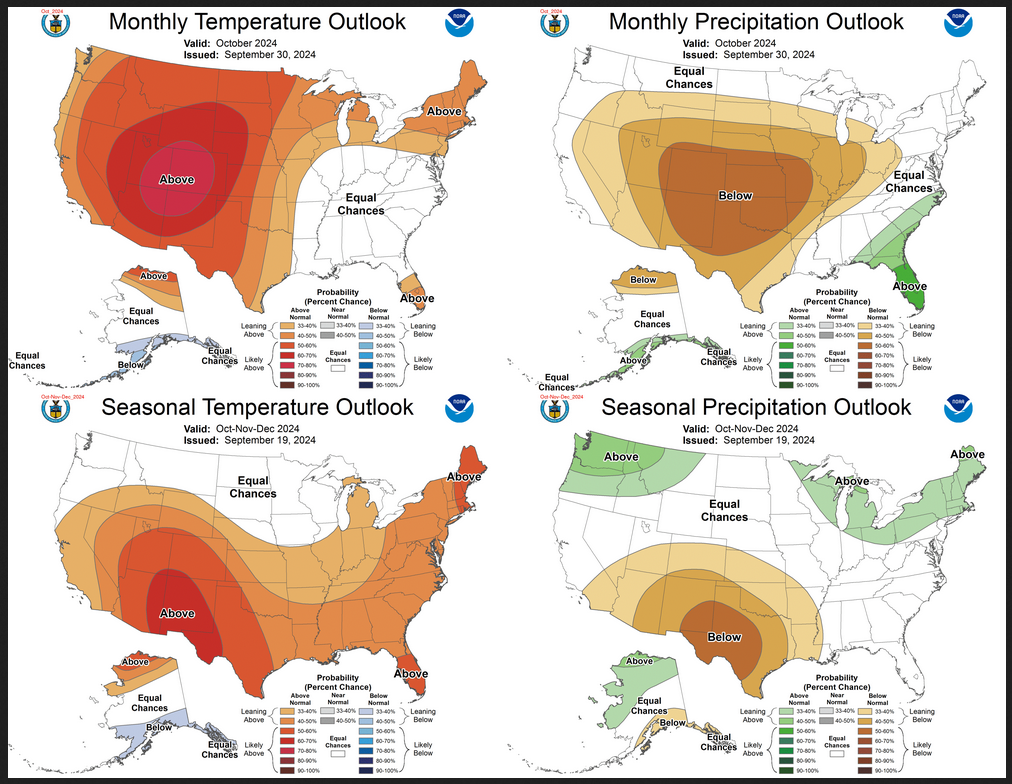
The top pair of maps are again the Updated Outlook for the new month. There is a temperature map and a precipitation map. The bottom row shows the three-month outlooks which includes August the new month. I think the outlook maps are self-explanatory.
To the extent that one can rely on a forecast, we would conclude that November and December will be very different than October. You can subtract October from the three-month Outlook and divide by two to get a combined November/December Outlook.However given the major change in the new Outlook outlook from what was issued on September 19, 2024, we might not trust the Seasonal Outlook issued on September 19, 2024. Something to think about. But the major factor is the projected slower onset of La Nina. Thus this change is consistent with the pattern the NOAA has been predicting although they have been playing catch-up. I am still not convinced that there will be a La Nina Winter. |
Some readers may need to click “Read More” to read the rest of the article. Some will feel that they have enough information. But there is a lot more information in the rest of this article.
| Our regular Daily Weather article can be found HERE. In addition to the short-term forecast it also provides the 6 – 10 day, 8 – 14 day, and Week 3 – 4 Outlooks. That is not a full month but close to it. So it is helpful if one wants to understand how the full-month forecast is expected to vary through the month. And the maps in the Daily Article update throughout the month. |
What we knew about October before NOAA issued their Updated Outlook for October. It should update in this article but if not, you can find the updated version at econcurrents.com daily.
Below is the current five-day cumulative forecast of precipitation (Updates can be found HERE) Unfortunately I do not have a five-day temperature forecast.

Now we look at Intermediate-Term “Outlook” maps for three time periods. Days 6 – 10, Days 8 – 14, and Weeks 3 and 4. An outlook differs from a forecast based on how NOAA uses these terms in that an “outlook” presents information as deviation from normal and the likelihood of these deviations.
Below are the links to obtain updates and additional information. They are particularly useful if you happen to be reading this article significantly later than when it was published. I always try to provide readers with the source of the information in my articles. These links may also be useful for those viewing this article on a cell phone or other small screen.
| Days 6 – 10 (shown in Row 1) | Days 8 – 14 (Shown in Row 2) | Weeks 3 and 4 (Shown in Row 3 but updates only on Fridays) |
| https://www.cpc.ncep.noaa. gov/products/predictions/610day/ | https://www.cpc.ncep .noaa.gov/products/predictions/814day/ | https://www.cpc.ncep.noaa.gov/products/predictions/WK34/ |
Showing the actual maps. They should now update automatically. The Week 3 – 4 Outlook only updates on Fridays. So below is what I call the Intermediate-term outlook. On Fridays, it extends out 28 Days. That declines day by day so on Thursday it only looks out 22 days until the next day when the Week 3 – 4 Outlook is updated and this extends the outlook by one additional week.
| 6–10
|
|
|
| 8–14 |
|
|
| 3–4 |
|
|


So we had a 28-day outl00k in advance of NOAA issuing their updated outlook for October.
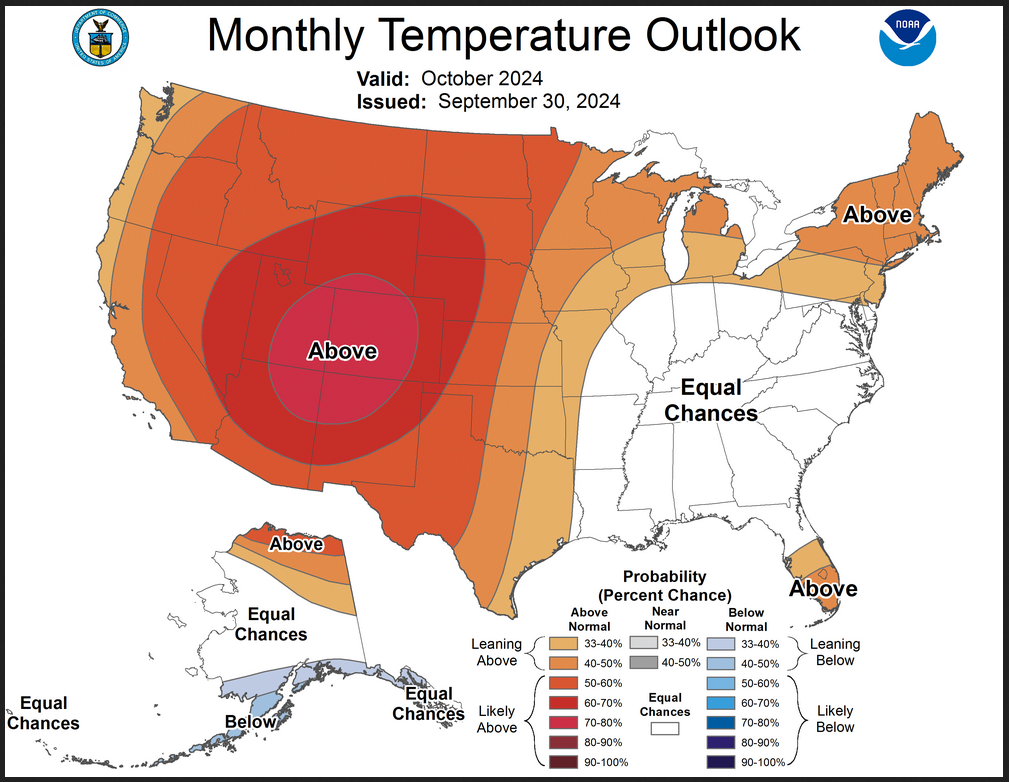
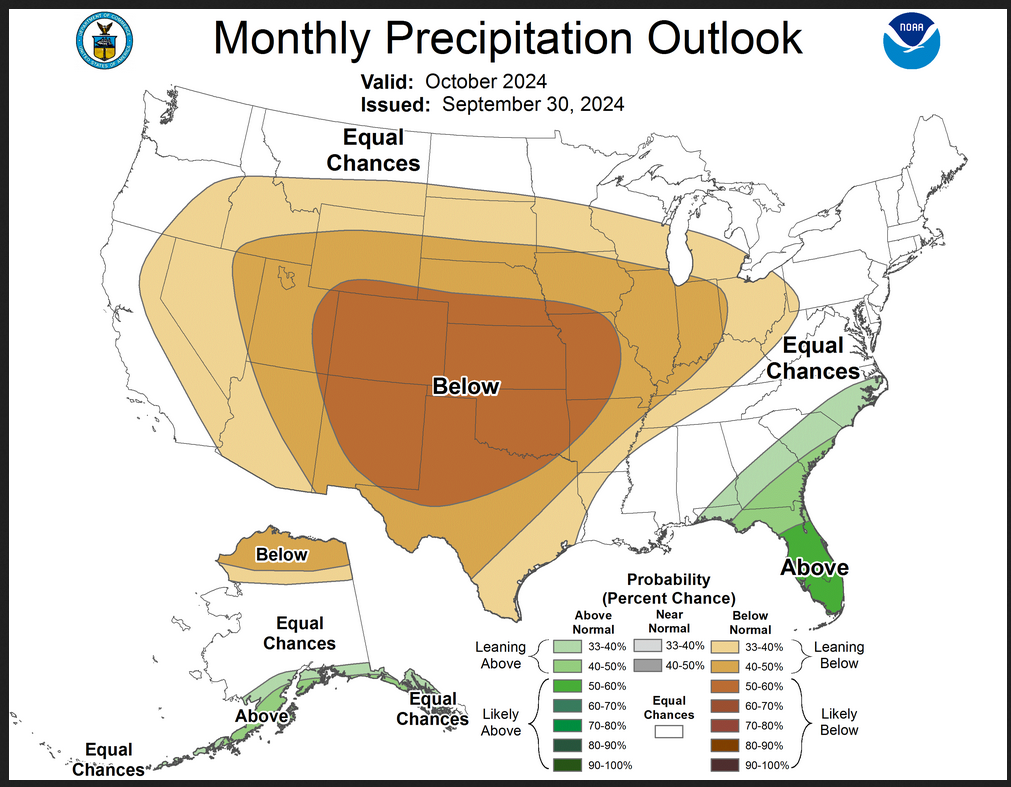
Here are larger versions of the October Temperature and Precipitation Outlook maps.
NOAA (Really the National Weather Service Climate Prediction Division CPC) Discussion. I have shown certain important points in bold type. My comments if any are in brackets [ ].
30-DAY OUTLOOK DISCUSSION FOR OCTOBER 2024
The updated October 2024 temperature and precipitation outlook is adjusted by the availability of medium- and extended-range forecast model guidance within the validation period (i.e. first 2 weeks of October) and the most recent available subseasonal forecast model guidance through the month of October.
Temperature
The temperature outlook for monthly mean temperatures has become considerably more clear as compared to the mid-month outlook. The previous outlook had an above-average amount of “Equal-Chances” (EC) forecast coverage than is typical for monthly outlooks (forecast rationale outlined below in the previous discussion). Forecast ridging and positive 500-hPa height anomalies are consistently forecast during the short-, medium- and extended-range time scales for much of the western and northern CONUS. Above-normal temperatures remain favored for the Southwest, central Rockies, Northeast, mid-Atlantic and the Florida Peninsula as in the mid-month outlook, but odds have increased and forecast coverage more widespread to include the Pacific Northwest, northern Rockies, northern Plains and Midwest. Lower 500-hPa heights, frontal activity, enhanced cloudiness and precipitation are more likely over this period in the Southeast U.S. so EC remains forecast in this region.
Although the MJO has evolved generally as forecast in mid-September till now, the response to the mid-latitudes (as defined through MJO composites) is not consistent with the overwhelming medium- and extended-range model guidance noted above. This is not overly surprising for the time of year as noted in the mid-month discussion.
The forecast for Alaska remains largely unchanged with enhanced odds for above-normal temperatures for northeast Alaska and enhanced odds for below-normal temperatures (forecast coverage reduced) for southern Alaska.
Precipitation
For precipitation, generally only minor forecast changes are made, and the outlook continues to be a quite dry one overall. The favored ridge-trough pattern across the CONUS noted above supports a large area of favored below-normal monthly total precipitation amounts stretching from the Far West eastward across the Plains to the Ohio Valley and southward to Texas. Probabilities are greatest for areas of the south-central High Plains and Great Plains. The outlook is supported by short-, medium-, extended- and subseasonal-range model guidance.
Favored above-normal precipitation remains in the new forecast from the previous mid-September outlook for the extreme Southeast including Florida, although for a smaller area, and for southwest Alaska. The forecast in Alaska also now includes an enhanced likelihood of above-normal precipitation for the south coast of Alaska and the Alaska Panhandle as well as favored below-normal precipitation for northern Alaska from the Brooks Range to the North Slope.
An additional change in the updated outlook is the removal of the favored wetter than normal conditions originally forecast for the Northeast CONUS – where model guidance now opposes positive (wet) October precipitation trends.
Drought Outlook
Here is the newly issued Drought Outlook for the month.
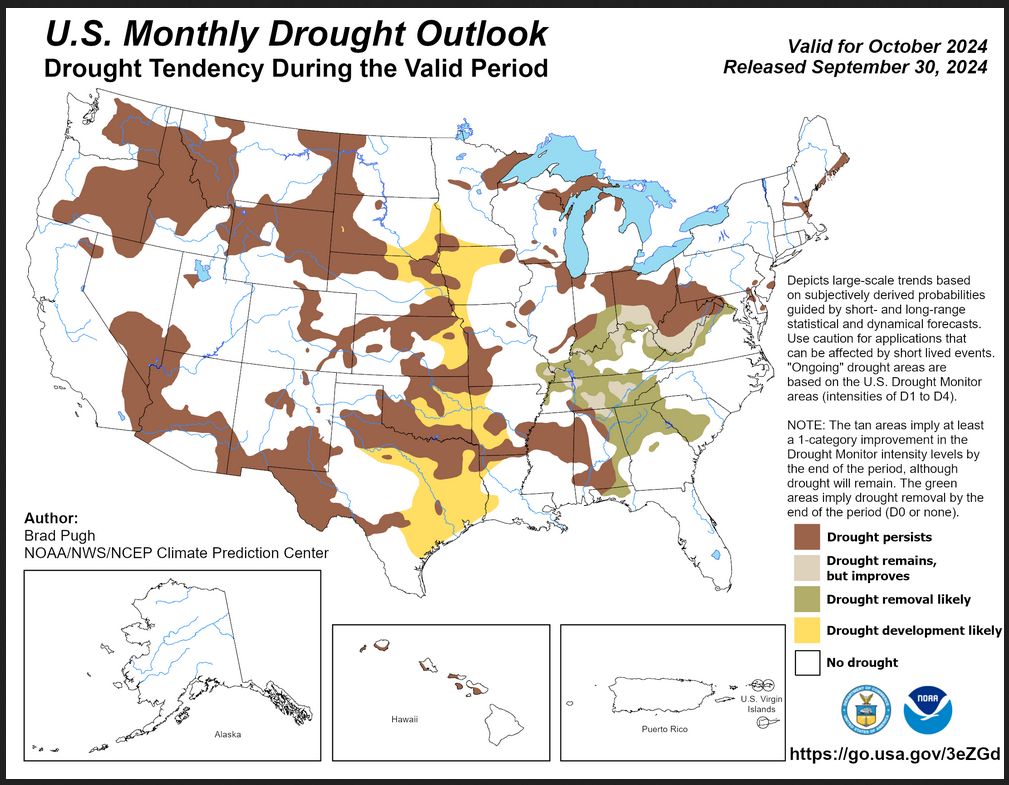
| You can see where drought development or persistence is likely. The summary and detailed discussions that accompany this graphic can be accessed HERE, but the short version is shown below. |
Here is the short version of the drought summary
Latest Monthly Assessment – Drought is likely to expand across the Great Plains, Western Corn Belt, Ozarks, and Western Gulf Coast due to: increasing precipitation deficits stretching back 30 and 90 days, declining soil moisture, and favored below-normal precipitation and above-normal temperatures in the updated October outlook. Persistence is forecast for ongoing drought throughout the West, but large-scale development is not expected by the end of October. Later in the autumn and into the 2024-2025 winter, the development of La Niña could lead to a broader area of drought development across the Southwest, Southern Great Plains, and Lower Mississippi Valley.
Based on heavy to excessive rainfall associated with Helene, drought improvement is forecast from parts of the Southeast north to the Tennessee Valley, Ohio Valley, and Central Appalachians. For areas that received lower precipitation amounts (less than 2 inches) across the Central Appalachians and Midwest, persistence is forecast.
Alaska, Puerto Rico, and the U.S. Virgin Islands are likely to remain drought-free through the end of October, while persistence is forecast for Hawaii.
We also have an updated Seasonal Drought Outlook (link).
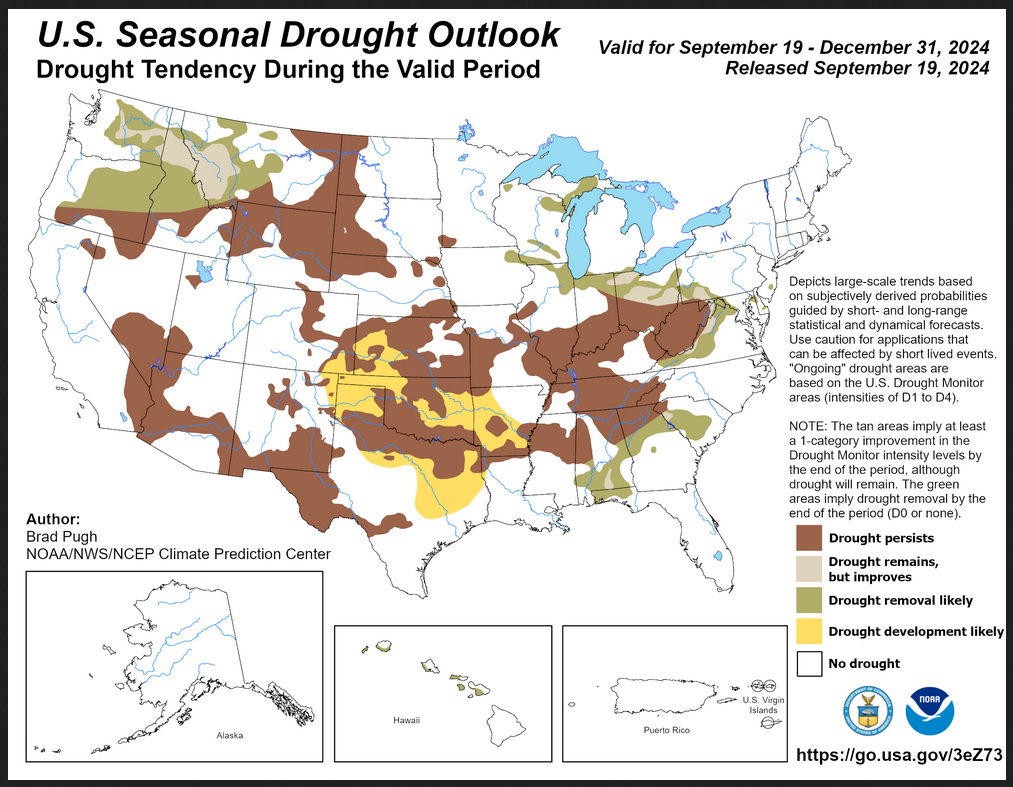
| This three-month outlook forecast is a combination of the mid-month three-month drought forecast and the revised drought forecast for October. Since I have a low level of confidence in the NOAA Outlooks for November and December, I have a low level of confidence for this seasonal drought outlook. |
| To update this forecast (which updates on Tuesdays), click HERE |
It is useful to review the prior month.
Month-to-date Temperature as the current month evolves can be found at https://hprcc.unl.edu/products/maps/acis/MonthTDeptUS.png
Month-to-date Precipitation as the current month evolves can be found at https://hprcc.unl.edu/products/maps/acis/MonthPNormUS.png
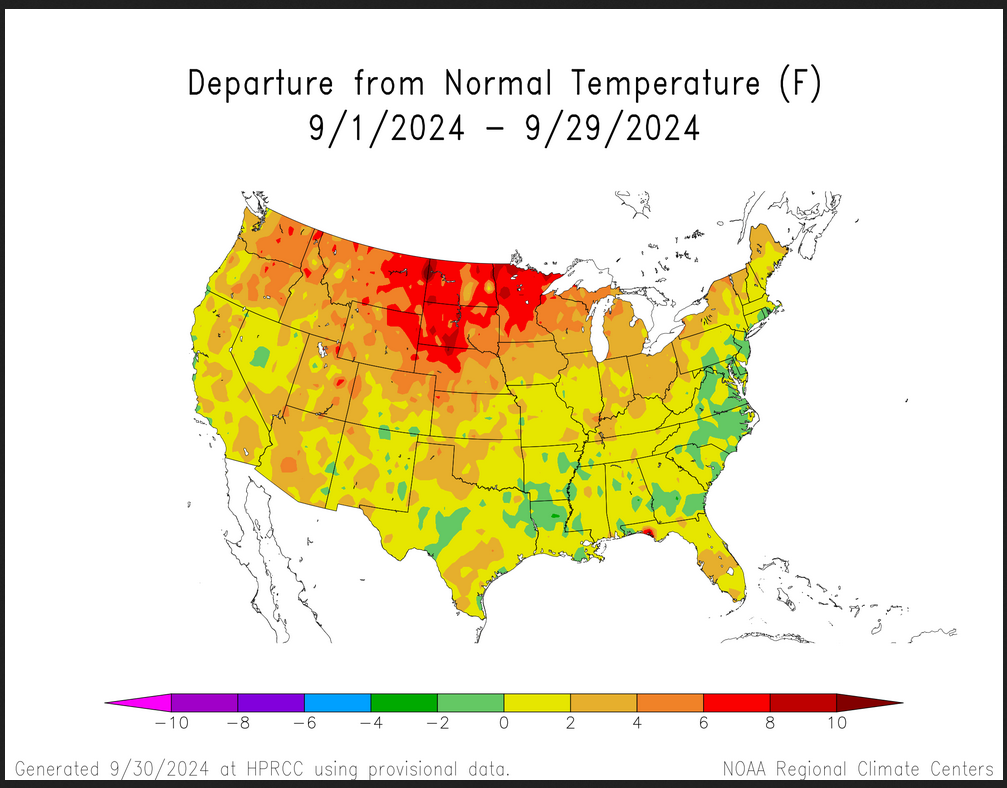
| You see an interesting North to South pattern of warm and cool with respect to a normal September. |
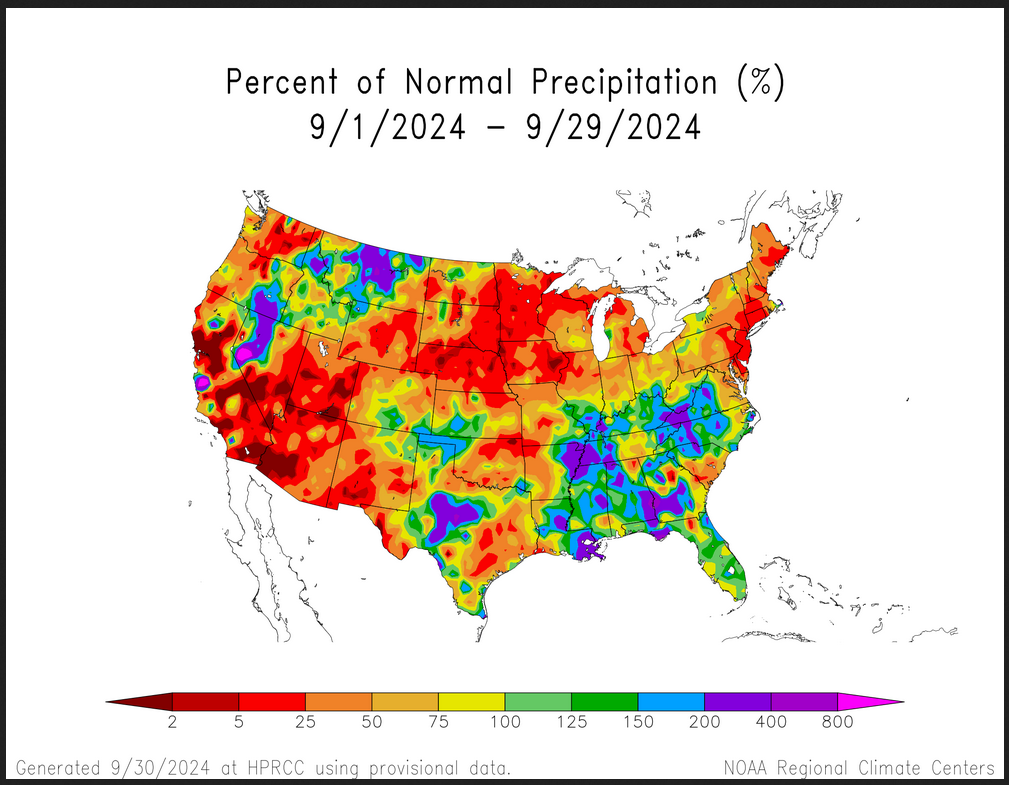
| You see both large areas of less than normal precipitation and more than normal precipitation. It is not clearly related to the September temperature pattern. It is related to tropical cyclones. |
Fire Outlook (The Site has Moved and I have not figured out how to fully use the new site yet. The link is HERE.
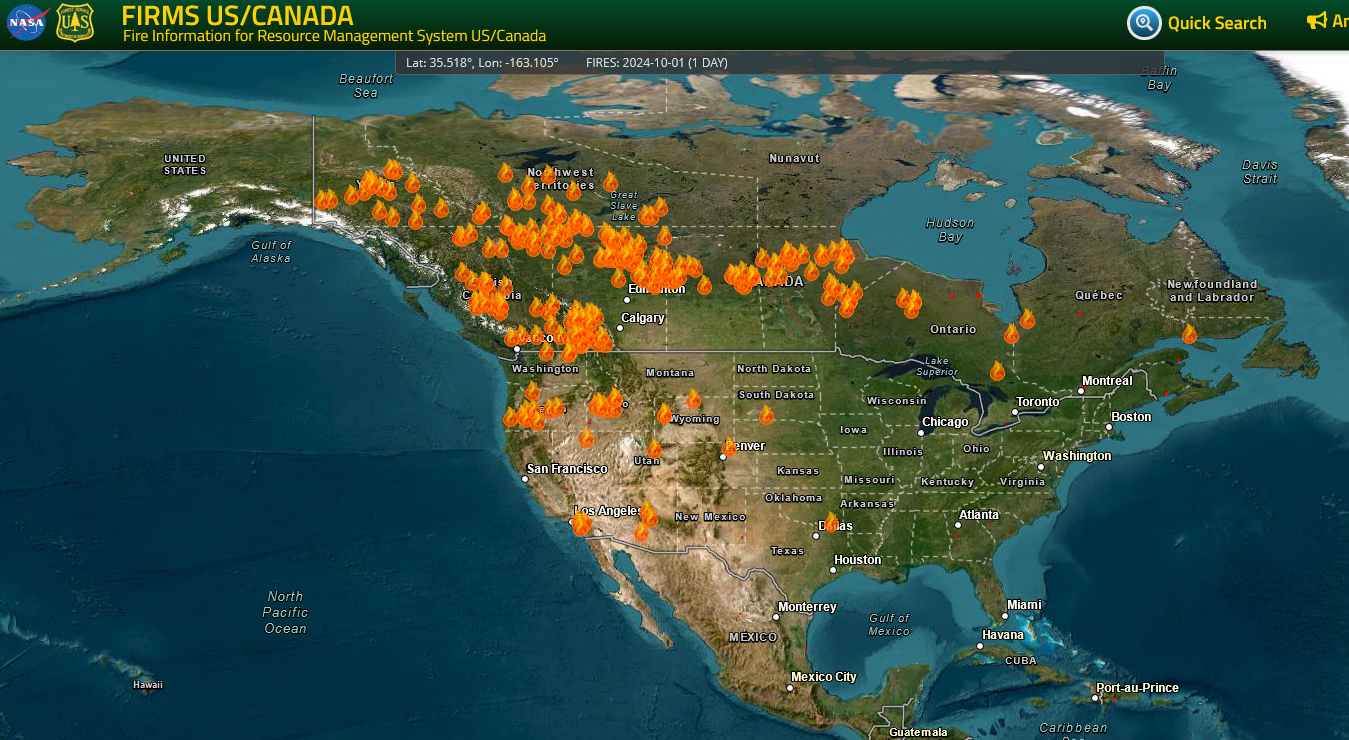
| But they for sure have good-looking maps. I will try to provide more information on the use of this website in the future. Canada has the major wildfire problem right now. |
| I hope you found this article interesting and useful |