
We start with the Supply and Demand Estimates which is an all-text discussion.
Then we look at World Agriculture Production and here there are many interesting maps and graphs. Production is part of Supply but Supply also includes the starting inventory and the ending inventory among other adjustments. So the two reports go together and I am presenting them that way.
There is so much here that I did not think that me adding comments would be helpful so I have refrained from doing that.
Some will need to click on “Read More to read the full article.
We start with world Agricultural Supply and Demand Estimates. The full report with tables can be accessed HERE.
WHEAT: The 2024/25 U.S. wheat outlook is unchanged relative to last month. The projected
season-average farm price remains at $5.70 per bushel.
The global wheat outlook for 2024/25 is for larger supplies, consumption, trade, and ending
stocks. Supplies are projected to increase 1.5 million tons to 1,062.1 million as higher
beginning stocks more than offset lower production. Beginning stocks are raised primarily on
Canada as Statistics Canada 2023/24 ending stocks were significantly higher than USDA’s
previous estimate. Canada’s ending stocks were also raised substantially higher for 2021/22
and 2022/23 based on Statistics Canada revisions. World wheat production is lowered 1.4
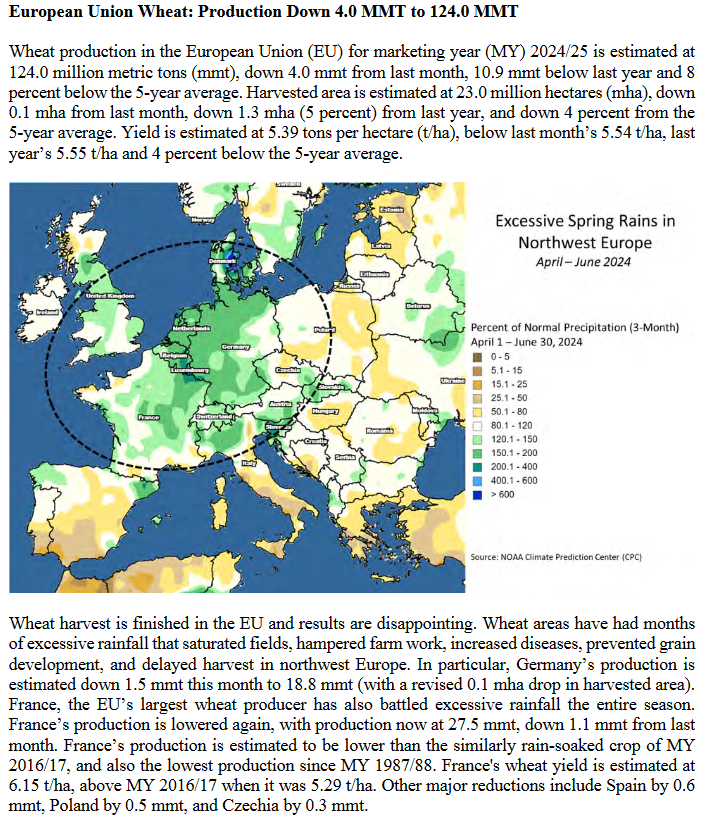
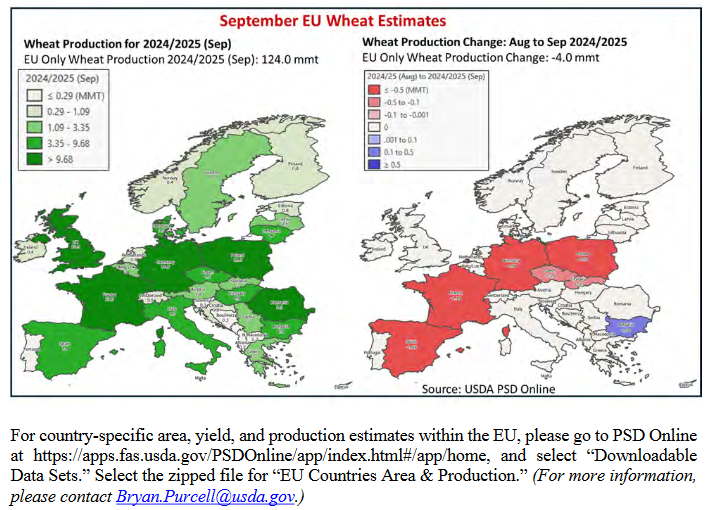
million tons to 796.9 million, but remains a record, as a reduction in the EU is only partially
offset by higher production for Australia and Ukraine. The EU is reduced 4.0 million tons to
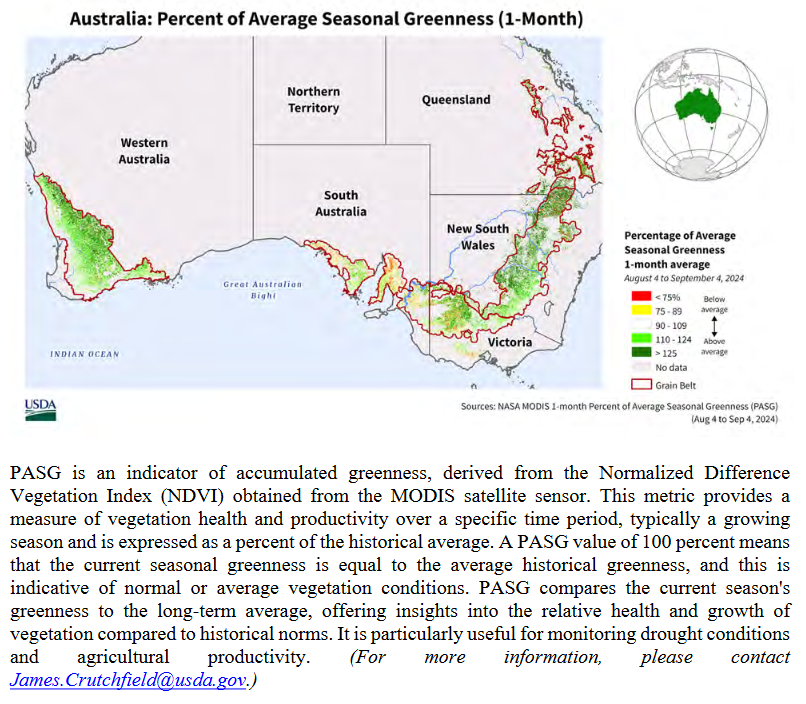
124.0 million on unfavorable harvest weather for France and Germany. Australia’s production
is raised 2.0 million tons to 32.0 million on favorable conditions in Western Australia, New
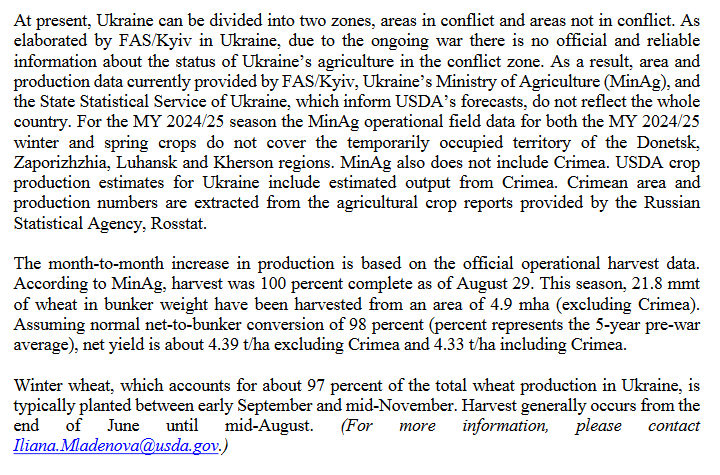
South Wales, and Queensland. Ukraine is raised 0.7 million tons to 22.3 million based on
harvest data released by the Ministry of Agriculture.
Global consumption is increased 0.9 million tons to 804.9 million, primarily on higher feed
and residual use for several countries more than offsetting a reduction for the EU. World
trade is raised 1.7 million tons to 216.5 million as higher exports for Australia, Canada, and
Ukraine more than offset a reduction for the EU. Projected 2024/25 global ending stocks are
raised 0.6 million tons to 257.2 million as increases for Canada, Brazil, and Kazakhstan more
than offset reductions for Australia, Turkey, and several other countries.
COARSE GRAINS: This month’s 2024/25 U.S. corn outlook is for smaller supplies and a
modest decline in ending stocks. Projected beginning stocks for 2024/25 are 55 million
bushels lower based on increases in exports and corn used for ethanol for 2023/24. Corn
production for 2024/25 is forecast at 15.2 billion bushels, up 39 million from last month on a
0.5-bushel increase in yield to 183.6 bushels per acre. Harvested area for grain is
unchanged at 82.7 million. Total U.S. corn use is unchanged at 15.0 billion bushels. With
supply falling and use unchanged, ending stocks are reduced 16 million bushels to 2.1
billion. The season-average corn price received by producers is lowered 10 cents to $4.10
per bushel.
Global coarse grain production for 2024/25 is forecast 1.8 million tons lower to 1.502 billion.
This month’s 2024/25 foreign coarse grain outlook is for lower production, virtually
unchanged trade, and reduced stocks relative to last month. Foreign corn production is
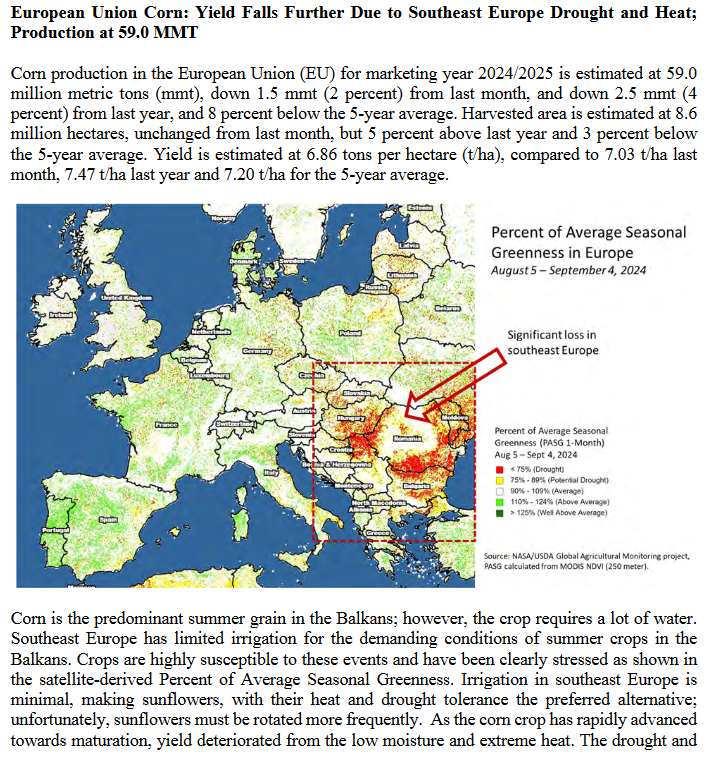
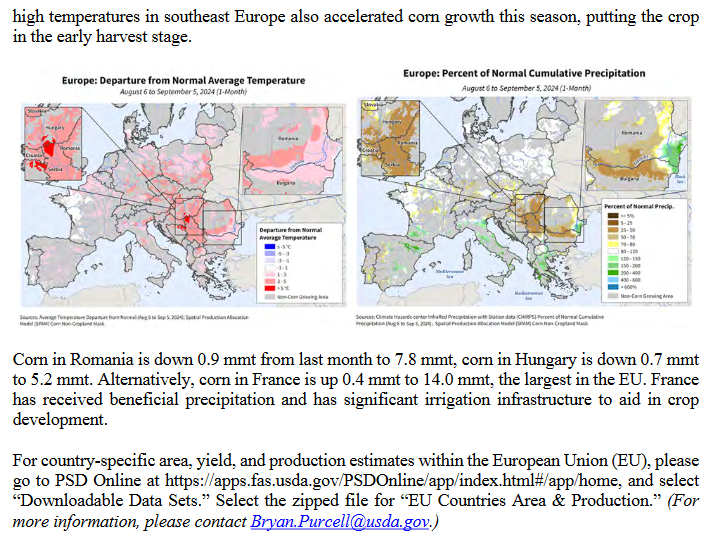
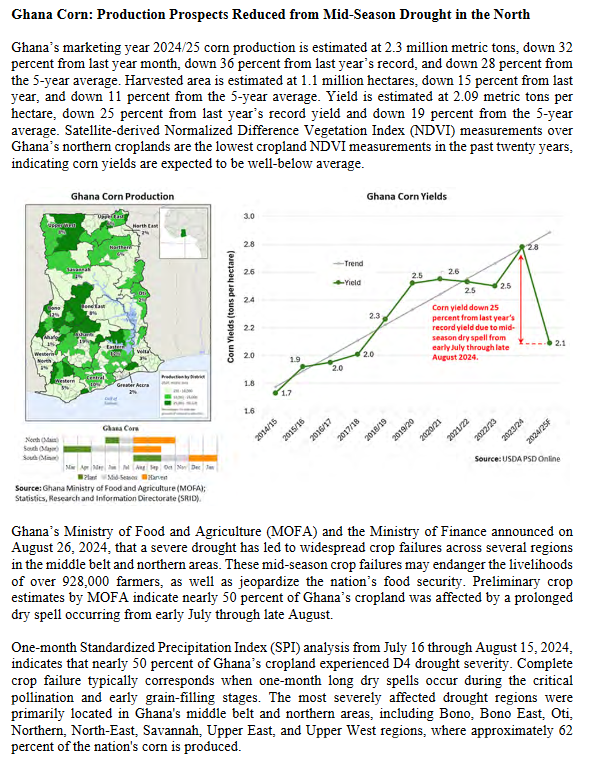
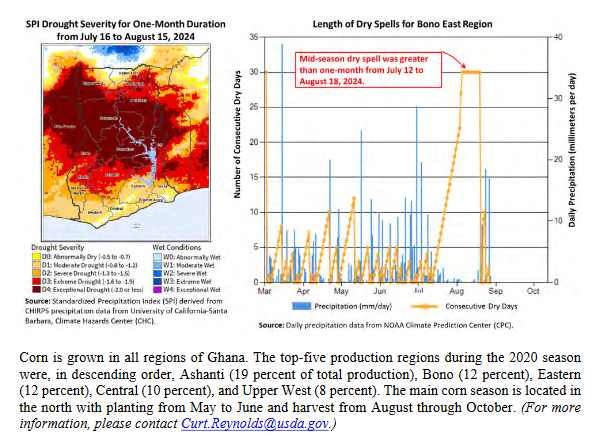
forecast down with declines for the EU, Ghana, Russia, and Serbia partially offset by
increases for Tanzania and Canada. EU corn production is lowered based on reductions for
Romania and Hungary partially offset by an increase for France. Foreign barley production is
lower with declines for Canada and the EU partly offset by an increase for Australia.
WASDE-652-2
Major global coarse grain trade changes for 2024/25 include larger corn exports for Tanzania
and Canada with reductions for Russia, the EU, and Serbia. Corn imports are raised for the
EU, Mexico, India, and Thailand but reduced for China, Canada, and Iran. Foreign corn
ending stocks are cut 1.4 million tons to 256.1 million, mostly reflecting a reduction for China
partly offset by an increase for Tanzania. World corn ending stocks, at 308.4 million tons, are
down 1.8 million.
RICE: The outlook for 2024/25 U.S. rice this month is for slightly larger supplies, unchanged
exports, reduced domestic use, and higher ending stocks. Supplies are increased as higher
beginning stocks and imports more than offset lower production. Beginning stocks are raised
1.1 million cwt to 39.4 million on the NASS Rice Stocks report, released August 21. The all
rice production forecast is lowered by 1.1 million cwt to 219.7 million, on unchanged
harvested area and a lower yield, as indicated by the NASS September Crop Production
report. Yields were revised significantly lower in Texas but were raised in Missouri. The
average all rice yield is down 35 pounds per acre to 7,588 pounds. All rice imports are raised
1.0 million cwt (all long-grain) to 46.5 million as the growth in consumption of Asian aromatics
is expected to continue. Total domestic and residual use is projected at 159.0 million cwt,
down 1.0 million from last month’s forecast but still a record. All rice 2024/25 ending stocks
are projected 2.0 million cwt higher at 45.6 million. The 2024/25 all rice season-average farm
price is projected at $15.60 per cwt, unchanged from last month for all classes.
The 2024/25 global rice outlook this month has only modest changes; supplies and
consumption increase, while trade and stocks decrease slightly. World supplies increase 0.3
million tons to 704.7 million, mostly on higher beginning stocks and production for India that
is only partly offset by lower production in Bangladesh due to recent flooding that reduced
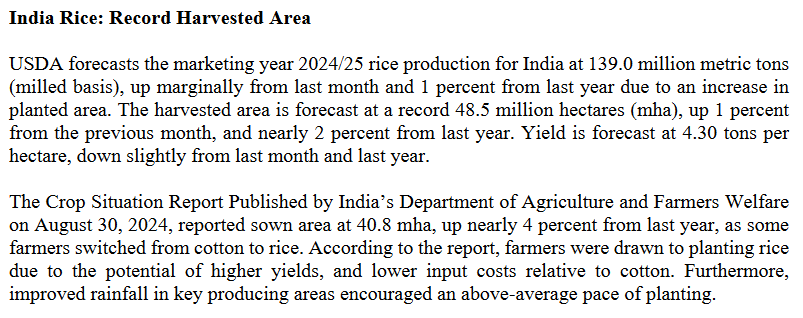
expected harvested area for the aus crop. India’s 2024/25 rice production is raised 1.0 million
tons to a record 139.0 million on higher-than-expected harvested area for the kharif crop,
especially in eastern Indian states that have received better monsoon rainfall than the
previous year. Global 2024/25 rice consumption is raised 0.5 million tons to 527.5 million as
a 1.0-million-ton increase for India is partly offset by reductions for Bangladesh and several
other countries. Projected 2024/25 world ending stocks are 177.2 million tons, down 0.2
million primarily due to reductions for Bangladesh, Cambodia, and Senegal that are mostly
offset by increases for India and Indonesia.
OILSEEDS: U.S. soybean supply and use changes for 2024/25 include lower beginning
stocks, production, and ending stocks. Lower beginning stocks reflect a slight increase to
crush for 2023/24. Soybean production for 2024/25 is projected down 3 million bushels to 4.6
billion. With 2024/25 soybean crush and exports unchanged, ending stocks are projected at
550 million bushels, down 10 million from last month.
The U.S. season-average soybean price is forecast unchanged at $10.80 per bushel. The
soybean meal and soybean oil prices are also unchanged at $320 per short ton and 42 cents
per pound, respectively. Other changes this month include lower peanut and cottonseed
production.
Foreign 2024/25 oilseed production is reduced 2.8 million tons to 552.7 million mainly on
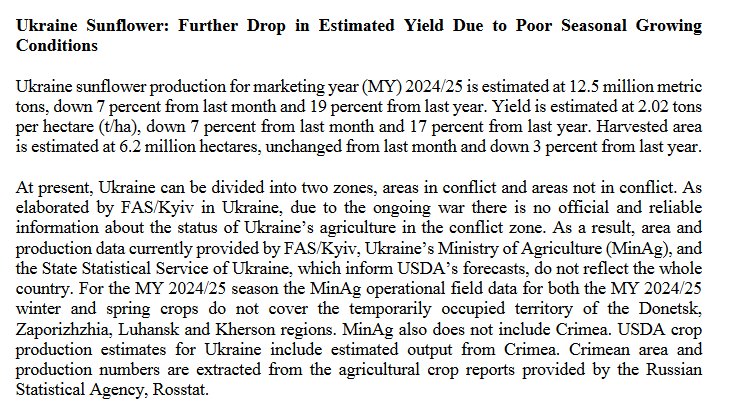
lower rapeseed production for the EU and lower sunflowerseed production for the EU,
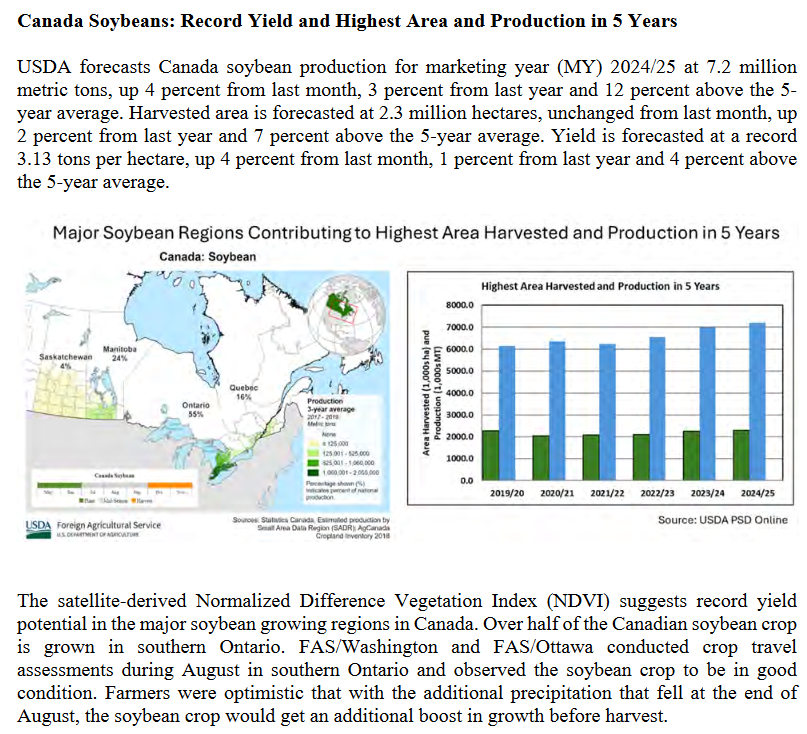
Ukraine, Kazakhstan, and Moldova. Foreign soybean production is raised 0.6 million tons on
higher production for Paraguay and Canada partly offset by lower output for the EU and
Serbia. Production for Paraguay is increased for 2022/23 through 2024/25 on higher area.
Production in Paraguay for 2023/24 is raised to reflect the strong pace of exports and crush
to date.
Global soybean trade for 2024/25 is increased to 181.6 million tons on higher exports for
Paraguay and imports for Argentina. Global soybean ending stocks are increased 0.3 million
tons to 134.6 million as higher stocks for Argentina and Canada are partly offset by lower
stocks for the United States and the EU.
SUGAR: U.S. sugar supply for 2023/24 is increased 239,152 short tons, raw value (STRV)
to 14.941 million on increases in production and imports. Beet sugar production is increased
by 41,049 STRV mostly on higher expected production occurring in August and September
from the early season 2024 sugarbeet crop. Likewise, cane sugar production in Louisiana is
increased by 53,024 STRV on higher expected production in September from the early
season 2024 sugarcane crop. Imports are increased by 145,000 STRV on increases for re-
export imports (up 32,000) and high-tier tariff/other imports (up 82,400 STRV). The raw high-
tier tariff estimate is at 824,380 STRV and the refined high-tier tariff estimate is at 289,574.
Calendar year FTA imports expected in the fourth quarter of 2024 arrived in August, adding
25,600 STRV to 2023/24 but reducing FTA imports for 2024/25 by the same amount. Imports
from Mexico are increased for small amounts expected to enter in August and September.
Use is increased modestly as increased re-export product deliveries are only partially offset
by a reduction in exports. Residually-estimated ending stocks stand at 2.278 million STRV
for a stocks-to-use ratio of 18.0 percent, up from 16.1 last month.
U.S. sugar supply for 2024/25 is decreased by 208,276 STRV as decreases in imports and
production are only partially offset by greater beginning stocks. Imports are down 403,124
STRV mostly on lower imports expected to enter from Mexico. Cane sugar production is
increased for Louisiana on higher expected sugarcane yield forecast by NASS but
processors in Florida expect a modest decrease in sugarcane yields to reduce sugar
production. Beet sugar production is projected at 5.311 million STRV, a decrease from last
month due to a lower NASS forecast of national sugarbeet area. There are no changes from
last month for use. Ending stocks are projected at 1.777 million STRV for a stocks-to-use
ratio of 14.2 percent.
For 2023/24, Mexico has a small increase in imports for consumption bringing the total up to
679,000 metric tons (MT). Imports for IMMEX are unchanged at 136,700 MT. Decreased
domestic deliveries to the IMMEX program more than offset a small increase in deliveries for
human consumption. The end result of these small adjustments is to increase carryover
stocks by 22,344 MT. For 2024/25, production, imports, deliveries, and ending stocks are all
unchanged from last month. The increase in initial supply implies a one-to-one increase in
Mexico exports up to 867,035 MT.
The U.S. Department of Commerce (DOC) uses the September WASDE to set the Mexico
Export Limit for the period beginning on October 1. The Export Limit will be the higher of
exports needed to result in an U.S. ending stocks-to-use ratio of 13.5 percent multiplied by
0.7 or the Export Limit from the July WASDE. Because the Target Quantity of U.S. Needs
from this WASDE calculated at 262,035 MT is lower than the Export Limit of 394,963 MT
established by the DOC on July 15, the latter amount is used for projecting exports to the
United States in the WASDE. Exports to destinations not under license are projected at
529,012 MT.
LIVESTOCK, POULTRY, AND DAIRY: The forecast for 2024 red meat and poultry
production is raised from last month on higher beef, pork, and broiler forecasts. Beef
production is raised on higher cow slaughter and heavier cattle weights in the second half of
the year. Pork production is raised for the second half of 2024 with a faster expected pace of
slaughter, but slightly lighter carcass weights. Broiler production is raised on current
slaughter data and hatchery data pointing towards more chicks placed in the third and fourth
quarters. Turkey production is raised from last month based on eggs set data. Egg
production is reduced on recent data that suggests lower-than-expected laying flock growth.
For 2025, the red meat and poultry production forecast is raised. Beef production is raised on
higher steer and heifer slaughter and heavier carcass weights. Broiler production is raised as
producers respond to improving margins. Pork production is reduced on slower expected
growth in carcass weights. USDA will release the Quarterly Hogs and Pigs report on
September 26, providing a further indication of hog supplies available for slaughter in the first
half of 2025. Turkey production is unchanged. Egg production is lowered based on the
slower rate of growth in layer flocks carrying into 2025.
The beef import forecast is raised for 2024 and 2025 on the strength of domestic demand
and availability of supplies from Oceania and South America. Beef exports are raised for
2024 and 2025 on recent trade data and continued expected strength in global beef demand.
Pork exports are raised for 2024 on recent trade data, but 2025 is unchanged. Broiler exports
are lowered for 2024 on recent trade data. Turkey exports are raised slightly for 2024 based
on recent trade data. Broiler and turkey export forecasts for 2025 are unchanged.
Cattle price forecasts are lowered for the second half of 2024 based on recent prices. Lower
prices are expected to carry into 2025. Hog prices are unchanged for 2024, but forecasts are
lowered in the first half of 2025 due to stronger expected competition with beef and poultry.
Broiler price forecasts are lowered for the second half of 2024 based on recent prices. The
broiler price forecast for 2025 is raised slightly. Turkey price forecasts are lowered for 2024
based on recent prices with lower prices expected to carry into 2025. Egg price forecasts for
2024 are raised based on recent prices and lower expected production. Higher egg prices
are forecast to carry into 2025 due to tighter supplies.
Milk production is forecast lower for 2024 and 2025. The reduction is due to lower forecast
cow inventories and a slower growth rate of milk per cow for the remainder of 2024. The
slower growth in milk per cow is carried into 2025.
The fat basis import forecast for 2024 is raised, reflecting recent trade data and strong
domestic demand, particularly for butter and cheese. The forecast for 2024 skim-solids basis
imports is unchanged. Imports for 2025 on both a fat and a skim-solids basis are raised on
tighter milk supplies and strong domestic dairy product prices. Fat basis and skim-solids
basis exports for 2024 are raised based on strong international demand for dairy products.
The skim-solids export forecast for 2025 is lowered due primarily to weaker price
competitiveness. The fat basis export forecast for 2025 is unchanged.
For 2024, forecasts for cheese, butter, nonfat dry milk (NDM), and whey are all raised based
on strong recent prices and lower milk production. As a result, the Class III and Class IV milk
price forecasts are raised. The all milk price forecast for 2024 is raised to $23.05 per cwt.
Tighter milk supplies and firm demand are expected to carry the higher price outlook into
2025, with raised prices for cheese, butter, NDM, and whey. Thus, Class III and Class IV milk
cwt.
ending stocks compared to last month. Beginning stocks and domestic use are unchanged.
The September NASS forecast of U.S. production is 14.5 million bales, down about 600,000
bales from August, largely due to reduced yields for upland cotton in the Southwest. The all-
cotton yield forecast of 807 pounds per acre is 33 pounds lower than last month. With lower
production for 2024/25, exports are reduced 200,000 bales to 11.8 million, and ending stocks
are decreased 500,000 bales to 4.0 million, or 29 percent of projected use. The 2024/25
season-average upland farm price is unchanged at 66 cents per pound. Revisions to the
2023/24 U.S. cotton balance sheet include a 400,000-bale increase in beginning stocks and
a similar reduction in unaccounted based on revised data and methodologies. For more
information, see this month’s edition of the Foreign Agricultural Service’s Cotton: World
Markets and Trade.
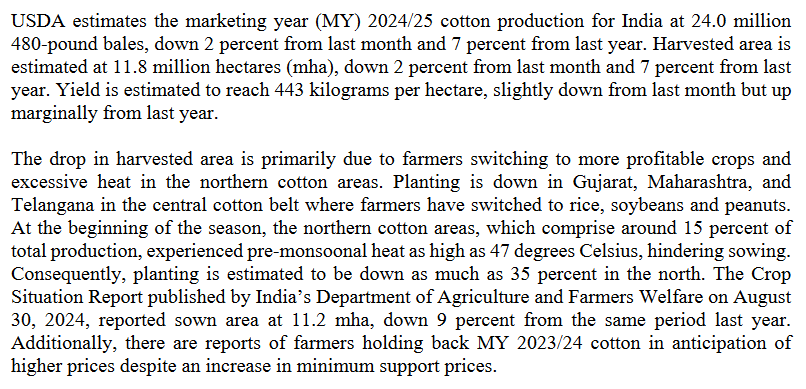
beginning and ending stocks are all reduced. World production is lowered by about 1.2
million bales as smaller crops in the United States, India, and Pakistan more than offset a
larger crop in China. World consumption is reduced about 460,000 bales, largely due to a
200,000-bale decrease in Vietnam and 100,000-bale reductions in Bangladesh and Turkey.
World trade is lowered about 550,000 bales as reduced imports by China, Vietnam, Turkey,
and Bangladesh offset an increase in India. World ending stocks are reduced 1.1 million
bales from August to about 76.5 million. The forecast for the world price of cotton,
represented by the “A” Index, is unchanged at 81.5 cents. The 2023/24 global balance sheet
is revised to reflect higher beginning stocks and mill use, and lower ending stocks.
Production and trade are marginally reduced.
Board, Mark Jekanowski, (202) 720-6030. This report was prepared by the Interagency Commodity
Estimates Committees.
SETH MEYER
SECRETARY OF AGRICULTURE DESIGNATE
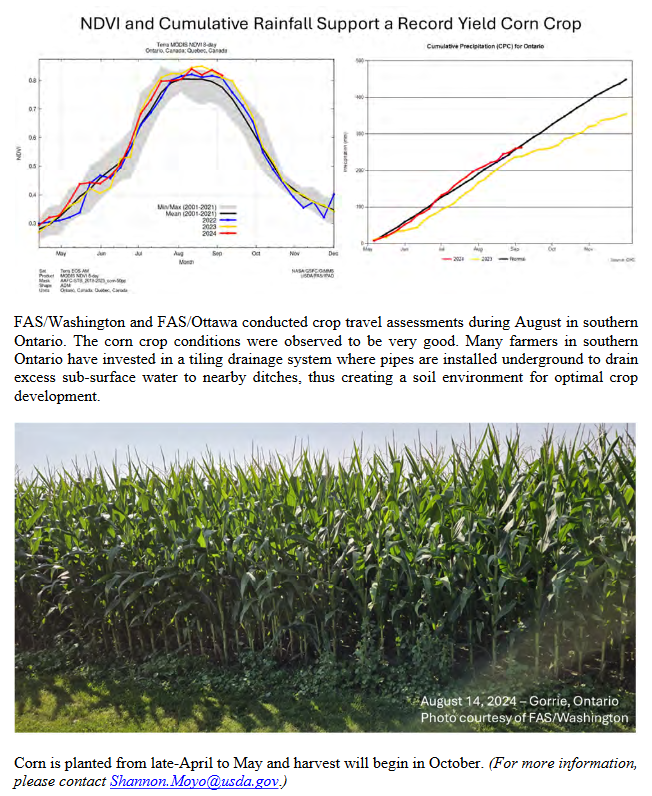
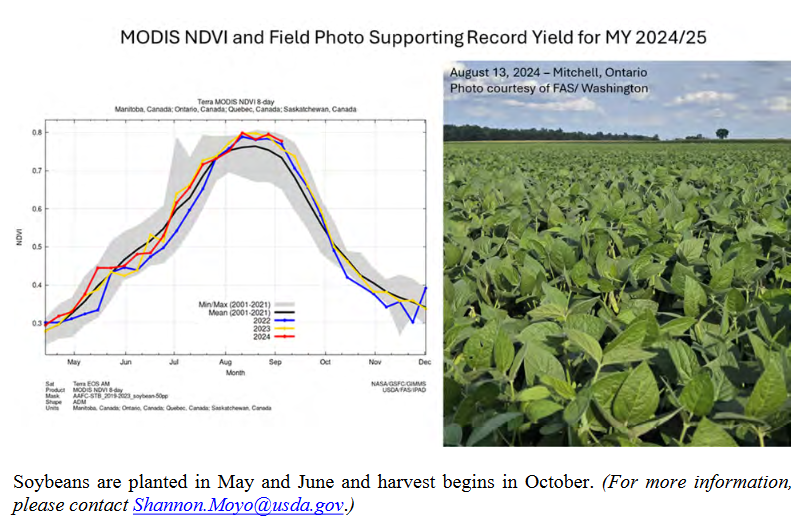
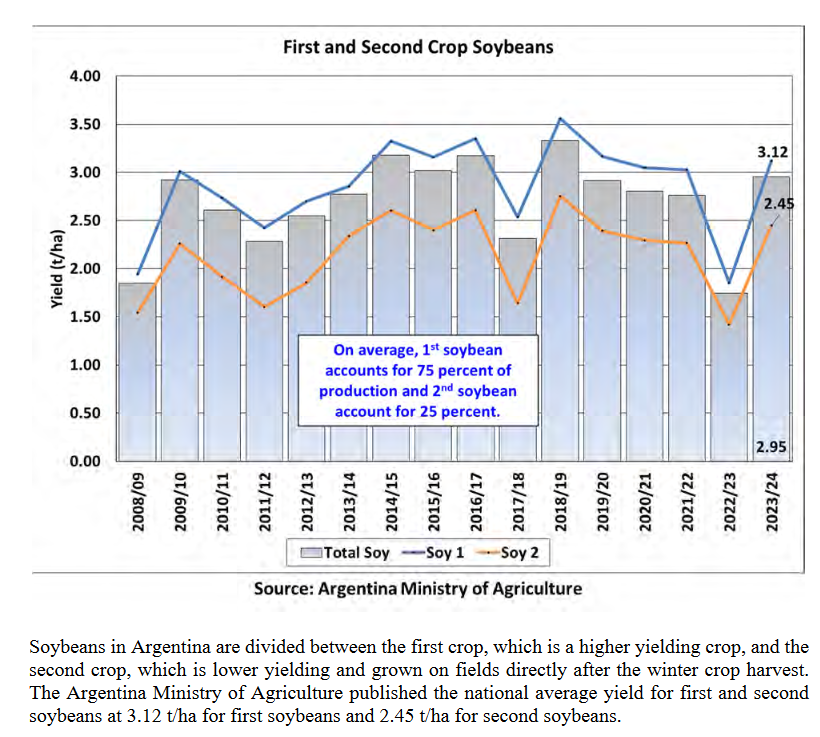
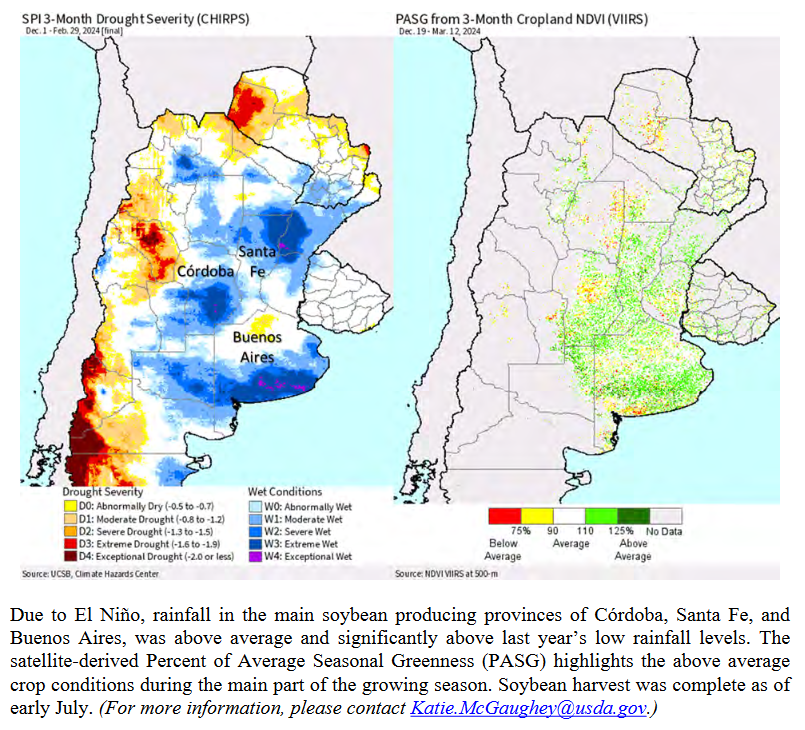
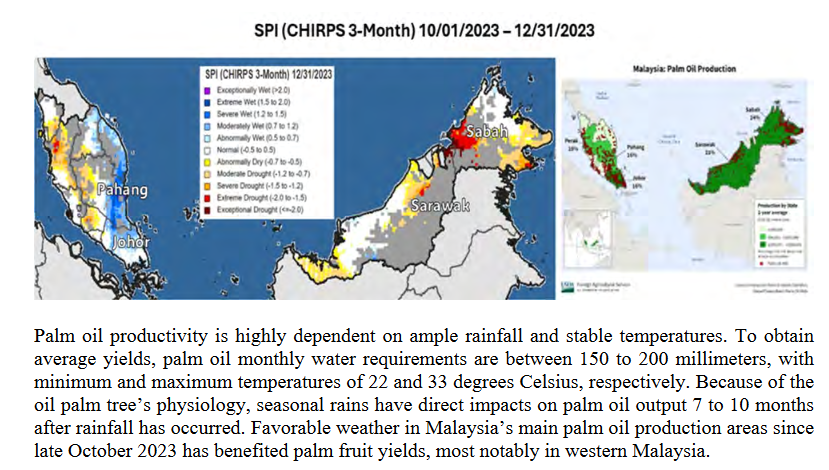
We now provide a large part of the world’s Agricultural Production Estimates. The full report with tables can be accessed HERE.
 xx
xx
–
| I hope you found this article interesting and useful. |


