This article focuses on what we are paying attention to in the next 48 to 72 hours. The article also includes weather maps for longer-term U.S. outlooks (up to four weeks) and a six-day World weather outlook which can be very useful for travelers.
First the NWS Short Range Forecast. The afternoon NWS text update can be found here after about 4 p.m. New York time but it is unlikely to have changed very much from the morning update. The images in this article automatically update.
Short Range Forecast Discussion
NWS Weather Prediction Center College Park MD
Wed Sep 25 2024
Valid 12Z Wed Sep 25 2024 – 12Z Fri Sep 27 2024…Helene is forecast to rapidly intensify to a major hurricane in the
Gulf and bring life-threatening impacts to Florida and the Southeast late
today through Friday……A rare High Risk of excessive rainfall is in place for the southern
Appalachians Thursday-Thursday night where considerable flash/urban/river
flooding and landslides are possible…Current Tropical Storm Helene is forecast to quickly become a hurricane
today and become a major hurricane before making landfall on Thursday. A
Hurricane Warning is in effect over the Florida Big Bend for damaging
hurricane-force winds. Helene will grow in size as it strengthens,
spreading its impacts to much of Florida and the Southeast. There is a
danger of life-threatening storm surge along the entire west coast of the
Florida Peninsula and Florida Big Bend. The highest inundation levels are
expected along the coast of the Florida Big Bend. Prepare now and heed
instructions from local officials about evacuations in these areas. Please
refer to the National Hurricane Center for the latest updates on the track
and timing of Helene.Helene will also cause significant rainfall and flooding threats. Even
ahead of Helene itself, tropical moisture will be pulled north into the
Southeast to southern Appalachians today and tonight ahead of a
slow-moving upper trough/low. This moisture will pool along and ahead of a
stalling front at the surface and lead to excessive rainfall. A Moderate
Risk is in place in WPC’s Excessive Rainfall Outlook (ERO) across portions
of Georgia into the southern Appalachians today into tonight within a
broader Slight Risk, in addition to Slight Risks of flash flooding in
parts of the Florida Peninsula and West Coast as Helene approaches.
Today’s rainfall is forecast to create wet antecedent conditions that
should likely overlap heavy rain along Helene’s track Thursday-Friday.
Thus a High Risk of excessive rainfall is delineated across the southern
Appalachians where upslope flow should increase rain totals and varying
terrain could lead to landslides. Overall, 5 to 10 inches of rain with
isolated totals around 15 inches is forecast over the Southeast.
Considerable flash and urban flooding is expected across portions of
Florida, the Southeast, southern Appalachians, and the Tennessee Valley
Wednesday through Friday. This includes the risk of landslides across the
southern Appalachians. Widespread minor to moderate river flooding is
likely, and isolated major river flooding is possible. Additionally, there
is a tornado threat with Helene, especially on the eastern side of the
track. The Storm Prediction center is indicating a Slight to Enhanced Risk
of severe weather, primarily for tornadoes, on Thursday into Thursday
night for parts of Florida into Georgia and South Carolina.Elsewhere, showers and storms are also possible farther north in the
eastern U.S. along the northern part of the frontal system over the next
couple of days. A couple of fronts passing through the Northwest should
lead to some precipitation there. Meanwhile the rest of the western U.S.
stretching into the north-central U.S. can expect dry conditions with
warmer than average temperatures. The Desert Southwest will see highs well
into the 100s, and 90s are possible in the northern High Plains. Some
record temperatures are possible for lows and highs.

To get your local forecast plus active alerts and warnings click HERE and enter your city, state or zip code.
Learn about wave patterns HERE.
Then, looking at the world and of course, the U.S. shows here also. Today we are looking at precipitation.
Please click on “Read More” below to access the full Daily Report issued today.
| Notices: What would you like to learn about? Please provide that to me via the comment section at the end of the article. |
Before we get started on this, I want to include the key graphic from the Updated Four Season Outlook that we discussed HERE yesterday.
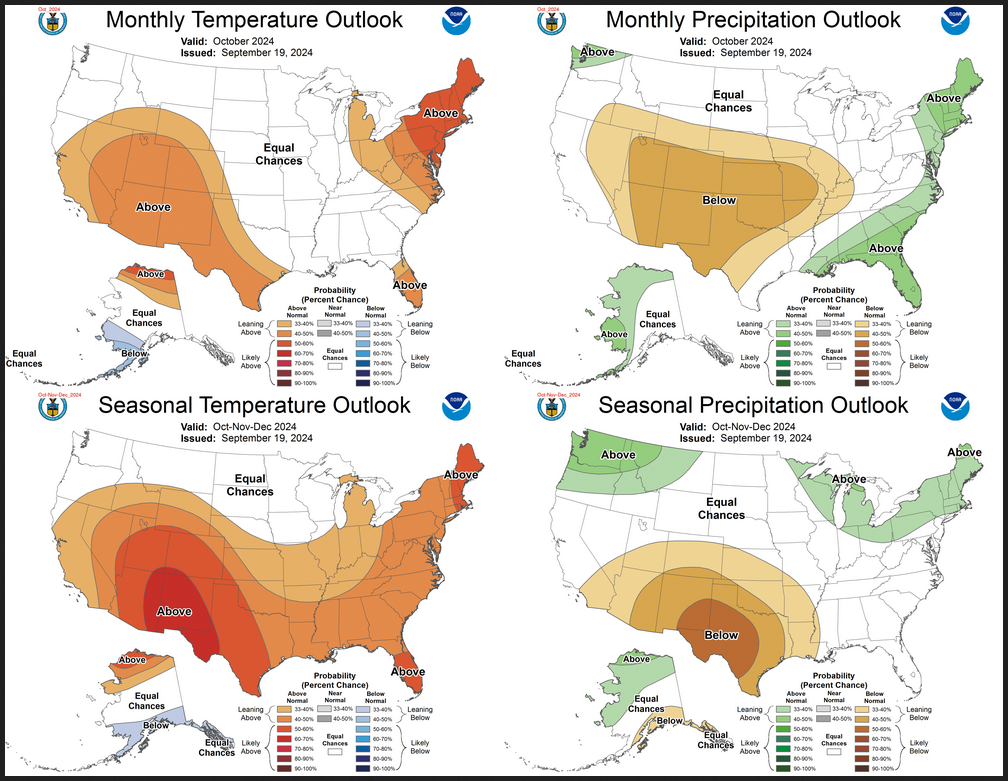
The top row is what is now called the Mid-Month Outlook for next month which will be updated at the end of this month. There is a temperature map and a precipitation map. The second row is a three-month outlook that includes next month.
Now more detail on the 48-Hour Forecast (It is a 48 to 72 Hour Forecast actually)
Daily weather maps. The Day 1 map updates twice a day and the Day 2 and 3 maps update only once a day. These maps update automatically. But if that does not happen, you can get updates by clicking HERE
TODAY (or late in the day the evening/overnight map will appear) (Key to surface fronts shown on maps and you will then also be able to insert a city name or zip code and get a local NWS forecast).
TOMORROW
NEXT DAY
We have a new animation of the forecast which shows how things may play out over the next 60 hours. To update click ANIMATION. Doing so will get you to the dashboard. You can then step through the animation or hit LOOP on the upper right of the display. You will have to hit the back arrow ← at the top left on your computer to get back into this article. It is a little more trouble than before but I think NOAA scrapped the animation routine I was using so we have to keep up with “progress”.
The NWS Climate Prediction Center’s: Watches, Warnings, and Advisories plus other information can be found HERE. That takes you to the NWC Severe Weather Site. From there you can select among many categories of information. Remember to hit the back arrow ← at the top left of your screen to return to this article.
ATMOSPHERIC RIVERS
This tells us what is approaching the West Coast. Click HERE to update If I have not gotten around to doing the update. Here is some useful information about Atmospheric Rivers.

Below is the current five-day cumulative forecast of precipitation (Updates can be found HERE)

Ski SnowReports will Resume in the Fall.
Now we look at Intermediate-Term “Outlook” maps for three time periods. Days 6 – 10, Days 8 – 14, and Weeks 3 and 4. An outlook differs from a forecast based on how NOAA uses these terms in that an “outlook” presents information as deviation from normal and the likelihood of these deviations.
Below are the links to obtain updates and additional information. They are particularly useful if you happen to be reading this article significantly later than when it was published. I always try to provide readers with the source of the information in my articles. These links may also be useful for those viewing this article on a cell phone or other small screen.
| Days 6 – 10 (shown in Row 1) | Days 8 – 14 (Shown in Row 2) | Weeks 3 and 4 (Shown in Row 3 but updates only on Fridays) |
| https://www.cpc.ncep.noaa. gov/products/predictions/610day/ | https://www.cpc.ncep .noaa.gov/products/predictions/814day/ | https://www.cpc.ncep.noaa.gov/products/predictions/WK34/ |
Showing the actual maps. They should now update automatically. The Week 3 – 4 Outlook only updates on Fridays. So below is what I call the Intermediate-term outlook. On Fridays, it extends out 28 Days. That declines day by day so on Thursday it only looks out 22 days until the next day when the Week 3 – 4 Outlook is updated and this extends the outlook by one additional week.
| 6–
10
|
|
|
| 8–
14 |
|
|
| 3–
4 |
|
|


HAZARDS OUTLOOKS
Click here for the latest complete Day 3 -7 Hazards forecast which updates only on weekdays. Once a week probably Monday or Tuesday I will update the images. I provided the link for readers to get daily updates on weekdays. Use your own judgment to decide if you need to update these images. I update almost all the images Friday Night for the weekend edition of this Weather Report. So normally readers do not need to update these images but if the weather is changing quickly you may want to.

Temperature month to date can be found at https://hprcc.unl.edu/products/maps/acis/MonthTDeptUS.png
Precipitation month to date can be found at https://hprcc.unl.edu/products/maps/acis /MonthPNormUS.png
World Forecast [that website is has been intermittent so be patient]
Below are the Day 1 -3 and 4-6 forecasts for temperature and precipitation. Updates and much additional information can be obtained HERE
World Temperature Anomalies


World Accumulated Precipitation


This information is provided by the University of Maine. They draw upon many different sources. There is a lot of information available at the link provided. I have just provided two useful forecasts. There are probably over a hundred different forecasts available from this source.
Worldwide Tropical Forecast (This is a NOAA Product)

This graphic updates on Tuesdays) If it has not been updated, you can get the update by clicking here Readers will only have to do that if they are reading this article much later than the date of it being published.
Information on Tropical Storms can be found HERE. Western Pacific information can be found HERE. Note that unless there is an out-of-season storm the below images will not update until the National Hurricane Center starts their seasonal update of these maps on June 1. I include them simply because there can be an out-of-season event in which case it should show up in these maps.


–
| I hope you found this article interesting and useful. |