This article focuses on what we are paying attention to in the next 48 to 72 hours. The article also includes weather maps for longer-term U.S. outlooks and a six-day World weather outlook which can be very useful for travelers.
First the NWS Short Range Forecast. The afternoon NWS text update can be found here after about 4 p.m. New York time but it is unlikely to have changed very much from the morning update. The images in this article automatically update.
Short Range Forecast Discussion
NWS Weather Prediction Center College Park MD
Sun Sep 15 2024
Valid 12Z Sun Sep 15 2024 – 12Z Tue Sep 17 2024…Heavy rain/flash flood threat continues today for portions of the Lower
Mississippi Valley and Southeast……A coastal storm will bring wind and rain to the Carolinas and
Mid-Atlantic over the next few days……A strong low pressure system will bring unsettled weather and well
below normal temperatures to the West with high-elevation snow in the
Sierra Nevada…Francine’s remnants will linger over the southeastern U.S. early this week
as a nearly stationary frontal boundary sags south to the Gulf Coast.
Chances for locally heavy rain and isolated to scattered instances of
flash flooding will continue today for portions of the Lower Mississippi
Valley and Southeast. There is a Slight Risk of Excessive Rainfall (level
2/4) for parts of Mississippi, Alabama, and the Florida panhandle where
flooding will be most likely. Chances for showers and storms will persist
across this region over the next few days, but the risk of flooding will
gradually decrease, with only isolated flooding concerns expected Monday
and Tuesday.Meanwhile, a separate area of low pressure will strengthen off the
Southeast Coast and gradually move north towards the Carolinas. This
system is likely to bring gusty winds, heavy rain, coastal flooding, and
dangerous beach conditions to the Carolinas and portions of the
Mid-Atlantic through mid-week. Strong high pressure over the Northeast
will slow the forward motion of this system, increasing the chance of
heavy rainfall totals and flash flooding. There is a Slight Risk of
Excessive Rainfall (level 2/4) for portions of the eastern Carolinas and
far southeastern Virginia with an embedded Moderate Risk (level 3/4) over
southeastern North Carolina where the risk of flash flooding will be
highest. The National Hurricane Center is also monitoring this system for
potential subtropical or tropical development, and has marked this area
with a 50% chance of tropical formation over the next 48 hours. There is
still quite a bit of uncertainty on the timing, intensity, and track of
this system, so regularly check for forecast updates over the next couple
of days.In the West, an unsettled pattern is beginning to take root as upper level
troughing moves into the region. A deep upper low will move over the West
Coast today and Monday and push across the Intermountain West to the
Rockies on Tuesday. This will push a strong frontal system across the West
that will bring widespread precipitation chances and much cooler
temperatures to the region over the next few days. Precipitation will
mainly fall as rain, but temperatures will be cold enough in the high
elevations of the Sierra Nevada for some early season snow. A Winter
Weather Advisory is in effect for portions of the Sierra Nevada above 8000
feet where up to 4 inches of snow may fall tonight and Monday.
Precipitation chances will also increase across the Southwest/Four Corners
region today as tropical moisture streams north from Tropical Cyclone
Ileana, which will support monsoon-like showers and thunderstorms through
Tuesday.Temperatures will have a large range across the United States over the
next few days. Forecast precipitation and cloud cover will keep
temperatures slightly below normal across the Southeast and Mid-Atlantic,
with highs from the mid 70s to the mid 80s. Well above average
temperatures are forecast for the Central U.S. and Northeast, with the
highest anomalies forecast to develop under high pressure in the Upper
Midwest/Great Lakes region. High temperatures will reach the 80s and 90s,
which will be 10-20 degrees above normal for some areas. Well below
average temperatures are forecast to spread across the West through
Tuesday under the deep upper low/trough, and high temperatures will be as
low as 15-25 degrees below normal. The coldest anomalies will be in
Oregon, Nevada, and California on Monday. Highs in the 50s will be common
in the Great Basin, and highs will likely only reach the 30s and 40s in
the Sierra Nevada.
To get your local forecast plus active alerts and warnings click HERE and enter your city, state or zip code.
Learn about wave patterns HERE.
Then, looking at the world and of course, the U.S. shows here also. Today we are looking at precipitation.
Please click on “Read More” below to access the full Daily Report issued today.
| Notices: What would you like to learn about? Please provide that to me via the comment section at the end of the article. |
Yesterday, we published the new Status Alert for ENSO and one of the graphics might have dropped out so I am repeating a part of that article before we go into the details of the short-term weather forecast and the full article can be accessed HERE.
CPC Probability Distribution
Here are the new forecast probabilities. The probabilities are for three-month periods e.g. ASO stands for August/September/October.

![]() Here is the forecast from last month.
Here is the forecast from last month.
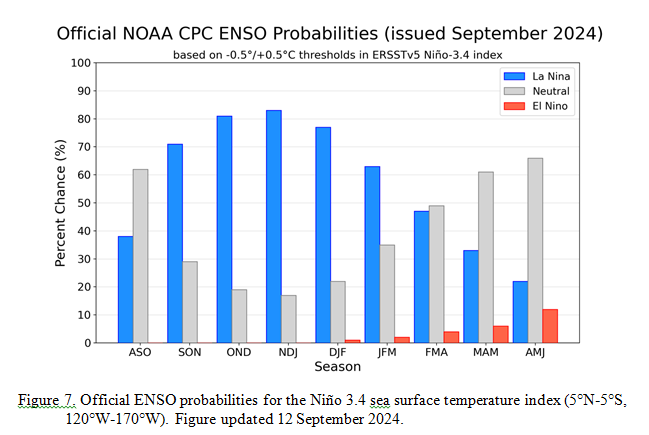
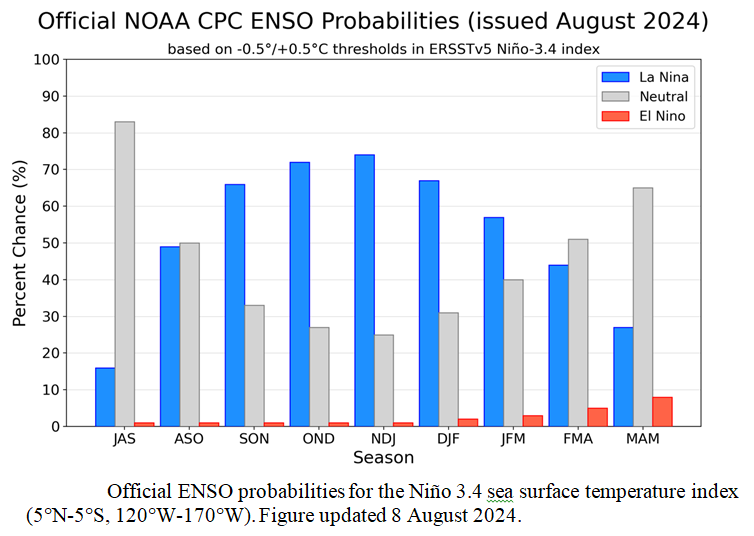
| The analysis this month and last month are a bit different with again the transition to La Nina being slightly slower than thought last month. This seems to be a trend. The La Nina is a bit slower to arrive and if it arrives it is likely to be marginal to weak. This raises questions as to the extent ot the impact of this potential weak La Nina. The full article can be accessed HERE. |
Now more detail on the 48-Hour Forecast (It is a 48 to 72 Hour Forecast actually)
Daily weather maps. The Day 1 map updates twice a day and the Day 2 and 3 maps update only once a day. These maps update automatically. But if that does not happen, you can get updates by clicking HERE
TODAY (or late in the day the evening/overnight map will appear) (Key to surface fronts shown on maps and you will then also be able to insert a city name or zip code and get a local NWS forecast).
TOMORROW
NEXT DAY
We have a new animation of the forecast which shows how things may play out over the next 60 hours. To update click ANIMATION. Doing so will get you to the dashboard. You can then step through the animation or hit LOOP on the upper right of the display. You will have to hit the back arrow ← at the top left on your computer to get back into this article. It is a little more trouble than before but I think NOAA scrapped the animation routine I was using so we have to keep up with “progress”.
The NWS Climate Prediction Center’s: Watches, Warnings, and Advisories plus other information can be found HERE. That takes you to the NWC Severe Weather Site. From there you can select among many categories of information. Remember to hit the back arrow ← at the top left of your screen to return to this article.
ATMOSPHERIC RIVERS
This tells us what is approaching the West Coast. Click HERE to update If I have not gotten around to doing the update. Here is some useful information about Atmospheric Rivers.

Below is the current five-day cumulative forecast of precipitation (Updates can be found HERE)

Ski SnowReports will Resume in the Fall.
Now we look at Intermediate-Term “Outlook” maps for three time periods. Days 6 – 10, Days 8 – 14, and Weeks 3 and 4. An outlook differs from a forecast based on how NOAA uses these terms in that an “outlook” presents information as deviation from normal and the likelihood of these deviations.
Below are the links to obtain updates and additional information. They are particularly useful if you happen to be reading this article significantly later than when it was published. I always try to provide readers with the source of the information in my articles. These links may also be useful for those viewing this article on a cell phone or other small screen.
| Days 6 – 10 (shown in Row 1) | Days 8 – 14 (Shown in Row 2) | Weeks 3 and 4 (Shown in Row 3 but updates only on Fridays) |
| https://www.cpc.ncep.noaa. gov/products/predictions/610day/ | https://www.cpc.ncep .noaa.gov/products/predictions/814day/ | https://www.cpc.ncep.noaa.gov/products/predictions/WK34/ |
Showing the actual maps. They should now update automatically. The Week 3 – 4 Outlook only updates on Fridays. So below is what I call the Intermediate-term outlook. On Fridays, it extends out 28 Days. That declines day by day so on Thursday it only looks out 22 days until the next day when the Week 3 – 4 Outlook is updated and this extends the outlook by one additional week.
| 6–
10
|
|
|
| 8–
14 |
|
|
| 3–
4 |
|
|


HAZARDS OUTLOOKS
Click here for the latest complete Day 3 -7 Hazards forecast which updates only on weekdays. Once a week probably Monday or Tuesday I will update the images. I provided the link for readers to get daily updates on weekdays. Use your own judgment to decide if you need to update these images. I update almost all the images Friday Night for the weekend edition of this Weather Report. So normally readers do not need to update these images but if the weather is changing quickly you may want to.

Temperature month to date can be found at https://hprcc.unl.edu/products/maps/acis/MonthTDeptUS.png
Precipitation month to date can be found at https://hprcc.unl.edu/products/maps/acis /MonthPNormUS.png
World Forecast [that website is has been intermittent so be patient]
Below are the Day 1 -3 and 4-6 forecasts for temperature and precipitation. Updates and much additional information can be obtained HERE
World Temperature Anomalies


World Accumulated Precipitation


This information is provided by the University of Maine. They draw upon many different sources. There is a lot of information available at the link provided. I have just provided two useful forecasts. There are probably over a hundred different forecasts available from this source.
Worldwide Tropical Forecast (This is a NOAA Product)

This graphic updates on Tuesdays) If it has not been updated, you can get the update by clicking here Readers will only have to do that if they are reading this article much later than the date of it being published.
Information on Tropical Storms can be found HERE. Western Pacific information can be found HERE. Note that unless there is an out-of-season storm the below images will not update until the National Hurricane Center starts their seasonal update of these maps on June 1. I include them simply because there can be an out-of-season event in which case it should show up in these maps.


–
| I hope you found this article interesting and useful. |