It is now updated. I will be adding comments for a little while but the images are now updated.
At the end of every month, NOAA updates its Outlook for the following month which in this case is August of 2024. We are reporting on that tonight.
There have been some significant changes in the Outlook for September and these are addressed in the NOAA Discussion so it is well worth reading. We provided the prior Mid-Month Outlook for September for comparison. It is easy to see the substantial changes in the weather outlook by comparing the Mid-Month and Updated Maps.
The article includes the Drought Outlook for September. NOAA also adjusted the previously issued Seasonal (SON) Drought Outlook to reflect the changes in the September Drought Outlook. We also provide the Week 2/3 Tropical Outlook for the World.
The best way to understand the updated outlook for September is to view the maps and read the NOAA discussion. I have highlighted the key statements in the NOAA Discussion.
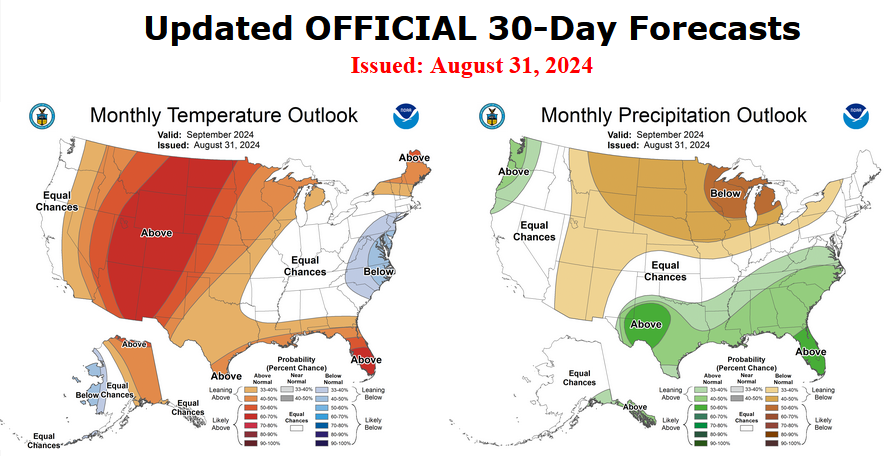
Here is the updated Outlook for September 2024.
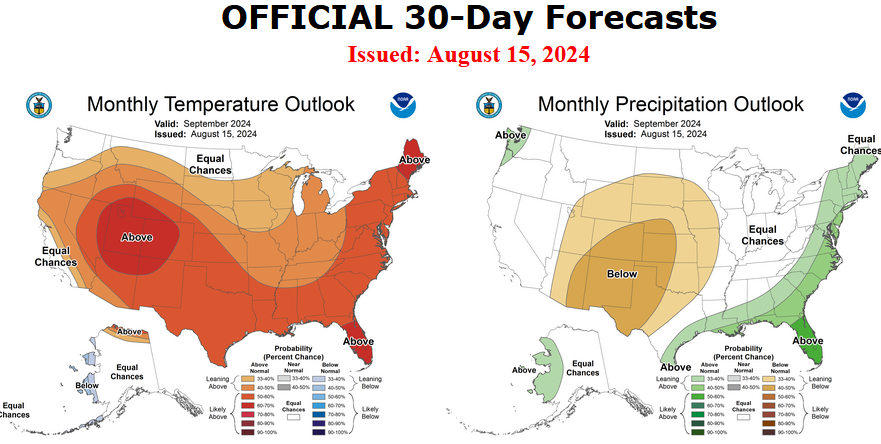
For Comparison Purposes, Here is the earlier Mid-Month Outlook for September.
| It is important to remember that the maps show deviations from the current definition of normal which is the period 1991 through 2020. So this is not a forecast of the absolute value of temperature or precipitation but the change from what is defined as normal or to use the technical term climatology.
It is a substantial change from what was issued on August 15, 2024. Remember, it is the first set of maps that are the current outlook for September. One expects some changes 16 days later. However, the changes to the updated September Outlook are very significant. This then gives us some reason to question the (August 15, 2024) three-month SON temperature and precipitation Outlooks which are shown in the following graphic. |
NOAA provided a combination of the Updated Outlook for September and the Three-Month Outlook.
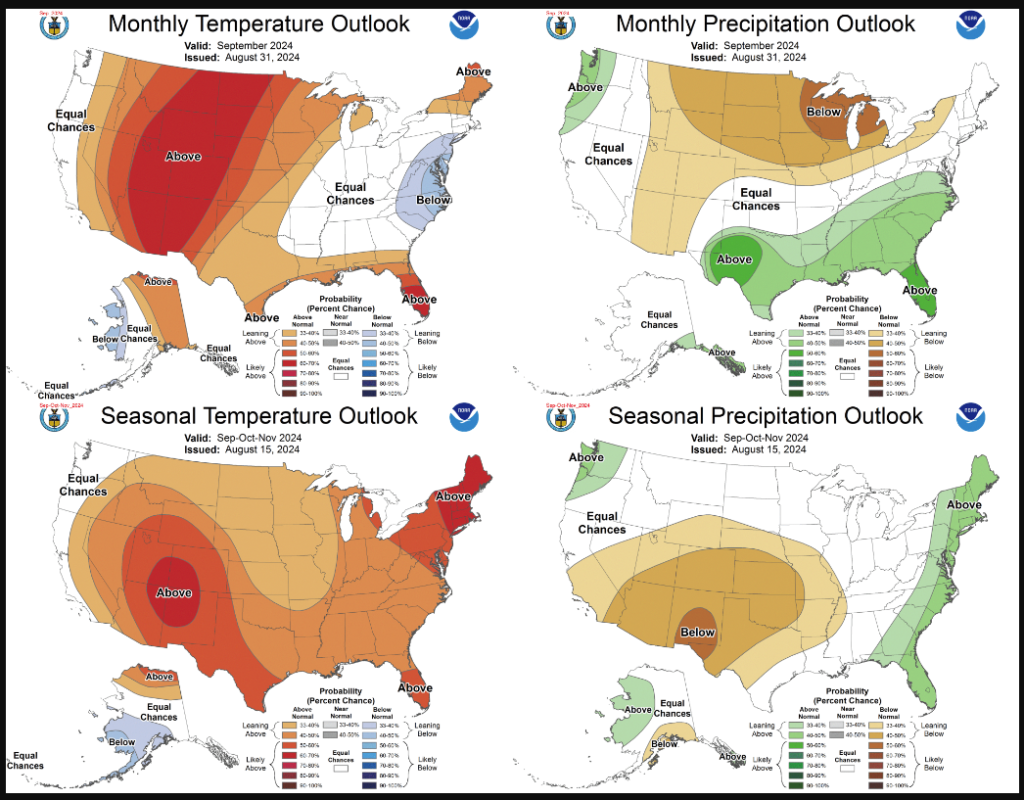
The top pair of maps are again the Updated Outlook for the new month. There is a temperature map and a precipitation map. The bottom row shows the three-month outlooks which includes August the new month. I think the outlook maps are self-explanatory.
To the extent that one can rely on a forecast, we would conclude that October and November will be very different than September, especially for precipitation. You can subtract September from the three-month Outlook and divide by two to get a combined October-November Outlook.However given the major change in the new September outlook from what was issued on August 15, 2024, we might not trust the Seasonal Outlook issued on August 15, 2024. Something to think about. But the major factor is the projected slower onset of La Nina. Thus this change is consistent with the pattern the NOAA has been predicting although they have been playing catch-up. I am still not convinced that there will be a La Nina Winter. |
Some readers may need to click “Read More” to read the rest of the article. Some will feel that they have enough information. But there is a lot more information in the rest of this article.
| Our regular Daily Weather article can be found HERE. In addition to the short-term forecast it also provides the 6 – 10 day, 8 – 14 day, and Week 3 – 4 Outlooks. That is not a full month but close to it. So it is helpful if one wants to understand how the full-month forecast is expected to vary through the month. And the maps in the Daily Article update throughout the month. |
What we knew about September before NOAA issued their Updated Outlook for September. It should update in this article but if not, you can find the updated version at econcurrents.com daily.
Below is the current five-day cumulative forecast of precipitation (Updates can be found HERE) Unfortunately I do not have a five-day temperature forecast.

Now we look at Intermediate-Term “Outlook” maps for three time periods. Days 6 – 10, Days 8 – 14, and Weeks 3 and 4. An outlook differs from a forecast based on how NOAA uses these terms in that an “outlook” presents information as deviation from normal and the likelihood of these deviations.
Below are the links to obtain updates and additional information. They are particularly useful if you happen to be reading this article significantly later than when it was published. I always try to provide readers with the source of the information in my articles. These links may also be useful for those viewing this article on a cell phone or other small screen.
| Days 6 – 10 (shown in Row 1) | Days 8 – 14 (Shown in Row 2) | Weeks 3 and 4 (Shown in Row 3 but updates only on Fridays) |
| https://www.cpc.ncep.noaa. gov/products/predictions/610day/ | https://www.cpc.ncep .noaa.gov/products/predictions/814day/ | https://www.cpc.ncep.noaa.gov/products/predictions/WK34/ |
Showing the actual maps. They should now update automatically. The Week 3 – 4 Outlook only updates on Fridays. So below is what I call the Intermediate-term outlook. On Fridays, it extends out 28 Days. That declines day by day so on Thursday it only looks out 22 days until the next day when the Week 3 – 4 Outlook is updated and this extends the outlook by one additional week.
| 6–10
|
|
|
| 8–14 |
|
|
| 3–4 |
|
|


So we had a 28-day outl00k in advance of NOAA issuing their updated outlook for September.
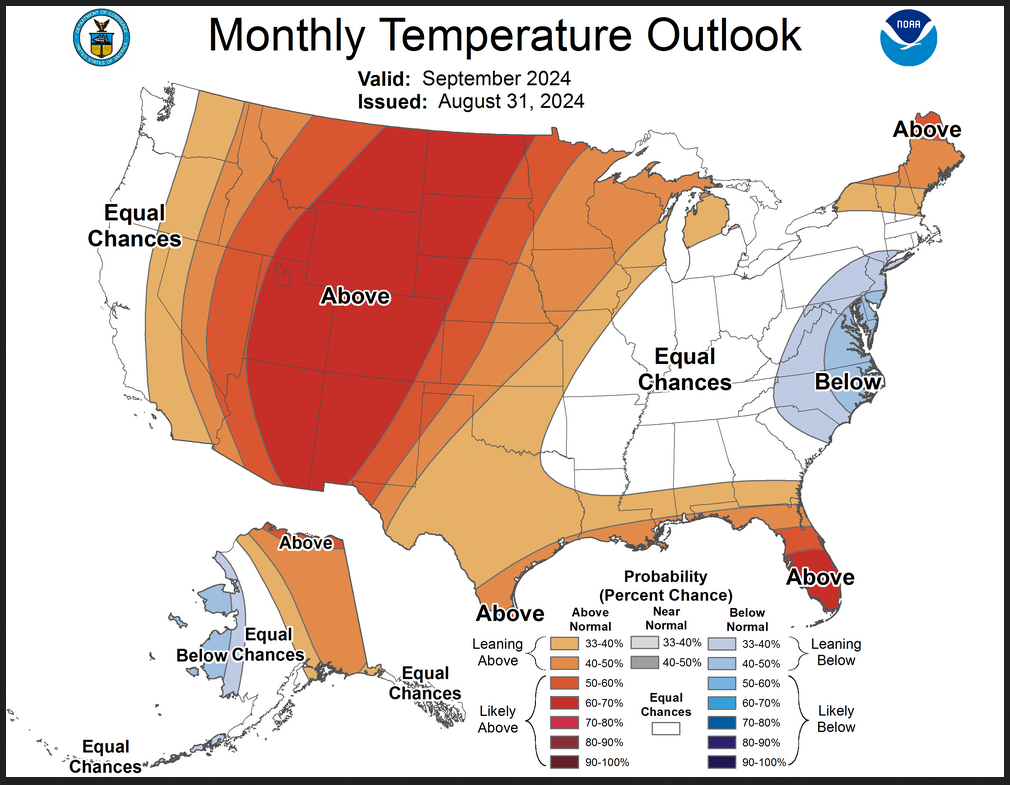
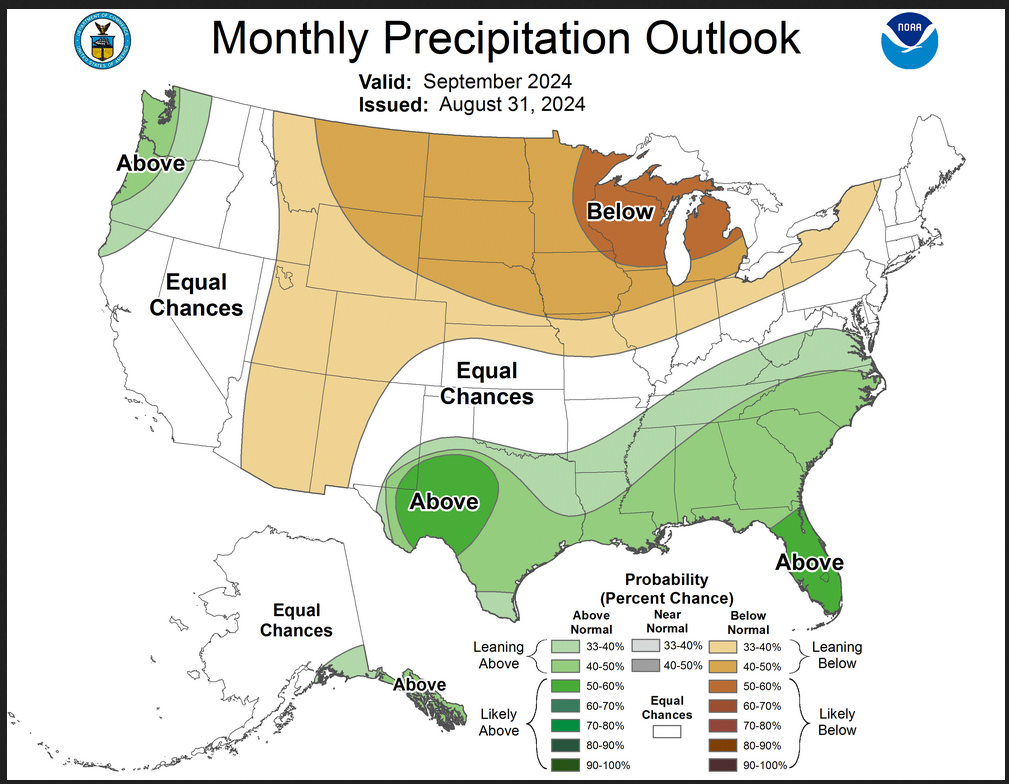
Here are larger versions of the September Temperature and Precipitation Outlook maps.
NOAA (Really the National Weather Service Climate Prediction Division CPC) Discussion. I have shown certain important points in bold type. My comments if any are in brackets [ ].
30-DAY OUTLOOK DISCUSSION FOR SEPTEMBER 2024
The updated September 2024 monthly temperature and precipitation outlooks are based on the latest dynamical model guidance, including the CFSv2 and GEFSv12 forecasts for the month of September, as well as the Weather Prediction Center (WPC) temperature and precipitation forecasts for the first week of the month, the CPC 6-10 day and 8-14 day temperature and precipitation outlooks, and the latest CPC Week 3-4 Outlook (valid September 14-27).
Although the El Niño Southern Oscillation (ENSO) remains in an ENSO-neutral state, a La Niña is predicted to likely develop over the next few months. However, atmosphere and ocean conditions remain neutral at present, and impacts of a developing La Niña were only considered in the update to the September outlook through the influence of the tropics on dynamical and statistical model forecasts. The Madden-Julian Oscillation (MJO) emerged over the Western Hemisphere in early August and propagated into the Indian Ocean. The MJO lost amplitude recently due to interference with other tropical variability, but is forecast by dynamical models to strengthen and propagate eastward across the Maritime Continent over the next few weeks. If the MJO regains amplitude and propagates into the Western Pacific, this would support less favorable conditions for tropical cyclone development over the Eastern Pacific and tropical Atlantic. However, conditions are expected to remain favorable for tropical cyclone development in the next few weeks due to other climate factors. The MJO was only considered in the monthly outlook to the extent that impacts may be associated with variability in the dynamical model forecasts for the month of September.
Dynamical models predict a large-scale wave pattern extending across the North Pacific into North America in the first week of September, with a mid-level ridge to the west of Alaska, a trough over the North Pacific, a ridge over western North America and the contiguous U.S. (CONUS), and a trough over eastern North America. While this pattern evolves and breaks down in model forecasts through the first week of the forecast period, this pattern is reestablished by the start of the 6-10 day period, with a weaker trough over the eastern CONUS. By the third and fourth week of September, dynamical model forecasts from the ECMWF and GEFS predict primarily positive 500-hPa height anomalies across most of the CONUS, with a ridge centered over the north-central CONUS and a trough extending from southwestern Alaska along the Pacific coast of North America to near or over the Pacific Northwest.
Temperature
The updated September temperature Monthly Outlook favors below normal temperatures for the west coast of Mainland Alaska and parts of the eastern Aleutians, due to persistent negative sea surface temperature (SST) anomalies in the region. The updated Monthly Outlook favors above normal temperatures across eastern Mainland Alaska consistent with the latest dynamical model guidance and Week 2 and Week 3-4 Outlooks. Above normal temperatures are likely for much of the western half of the CONUS, consistent with the latest 6-10 Day, Week 2, and Week 3-4 Outlooks. Equal chances (EC) of below, near and above normal temperatures are indicated for the Pacific coastal regions of the CONUS ahead of a predicted trough, similar to the Week 3-4 Outlook. A large area of EC is now indicated over much of the eastern CONUS, where the presence of a trough for much of the first half of September leads to forecasts of below normal temperatures and the Week 3-4 Outlook favors above-normal temperatures. Below normal temperatures are slightly favored for parts of the Mid-Atlantic region for the month of September, where cooler temperatures early in the month are likely to outweigh warmer temperatures later in the month in the September average. Above normal temperatures continue to be likely for the Gulf Coast, where sea surface temperatures are much above long-term averages. Above-normal temperatures continue to be likely for parts of the Northeast for the month of September, where potentially warmer temperatures later in the month outweigh cooler temperatures early in the month in model forecasts from the CFSv2 and GEFS for the entire month.
Precipitation
The updated September precipitation Monthly Outlook favors above normal precipitation for Southeast Alaska, ahead of a predicted trough and consistent with the Week 3-4 Outlook. Below normal precipitation continues to be slightly favored from parts of the Southwest northward across the Central Rockies into Montana, consistent with the latest dynamical model guidance. Below normal precipitation is likely from the northern Great Plains across the Great Lakes region, consistent with CFSv2 precipitation forecasts for September and the Week 2 and Week 3-4 Outlooks. Above normal precipitation is likely for parts of southeastern New Mexico, western Texas, and north-central Texas where WPC precipitation forecasts predict significant precipitation amounts in the first week of the month. Above normal precipitation is favored across the southeastern CONUS consistent with dynamical model guidance from the CFSv2 and the Week 3-4 Outlook.
Drought Outlook
Here is the newly issued Drought Outlook for the month.
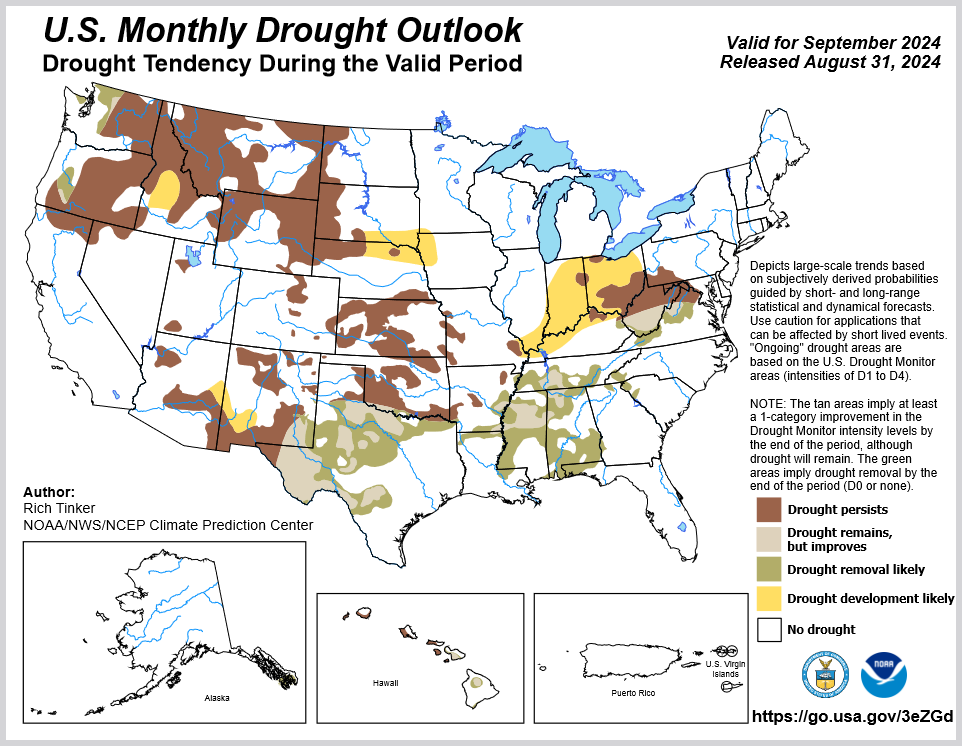
| You can see where drought development or persistence is likely. The summary and detailed discussions that accompany this graphic can be accessed HERE, but the short version is shown below. |
Here is the short version of the drought summary
Latest Monthly Assessment – Hurricane Debby and its remnants tracked north Florida through western New England in early August, dropping heavy to excessive rains on much of the Eastern Seaboard, especially the South Altantic States. Some locations from eastern South Carolina through northeastern Florida recorded over a foot of rain from the storm, and amounts in excess of 5 inches were common northward through the western mid-Atlantic region, the Northeast, and the northern Appalachians. Lesser amounts were observed across the eastern mid-Atlantic region, eastern Maine, and some locations along the immediate Northeast Coast. The rainfall associated with Debby was responsible for significant relief in the areas of drought along the Eastern Seaboard and portions of the Appalachians. Drought Monitor classifications improved by 2 or more categories over parts of central Georgia and from South Carolina northward through southern Pennsylvania, with improvements of 3 or 4 classifications introduced over much of eastern South Carolina. The only area of deterioration along the Eastern Seaboard extended from eastern Maryland and Delaware into southern New Jersey, where considerably less precipitation fell.
Another tropical system (Hone) brought heavy rains and significant drought relief to Hawaii. The heaviest rains (over 2 feet) fell on upslope areas on the Big Island near the center of the storm. Farther north, several inches of rain fell on many locations, resulting in improvement to the drought that has affected much of the state this summer.
Drought improvement was more limited farther west. Several areas from the southern Appalachians and adjacent areas northward through eastern Kentucky, southwestern Indiana, and northeastern Ohio improved over the past four weeks. In addition, scattered heavy precipitation was responsible for scattered patches of drought improvement from central Oklahoma through Kansas and in central and southern sections of the Rockies and High Plains.
Abnormal dryness or drought (D0-D4 on the Drought Monitor) persisted or deteriorated over many other parts of the country, especially in the central Appalachians and adjacent Ohio Valley, the lower Mississippi Valley and adjacent Southeast, northern Texas and part of adjacent Oklahoma, and parts of the northwestern Plains. Across the Plains and Rockies, precipitation was highly variable and localized, resulting in areas of deterioration and improvement being in close proximity to each other. To the north, moderate drought persisted in extreme southeastern Alaska.
By the end of September, abundant rainfall – especially early in the month – is expected to bring improving conditions to the areas of drought across the southern Plains, lower Mississippi Valley, Southeast, and the central Appalachians south of central West Virginia. The western fringes of the drought areas affecting the Northwest are also expected to see improvement or removal where normal September totals are at least 3 inches. Elsewhere, moderate drought in southeastern Alaska is expected to dissipate by the end of September, and improvement or removal is forecast across Maui and the Big Island of Hawaii.
In contrast, persistence or deterioration is anticipated for the remaining areas of drought in the contiguous 48 states; specifically in the northern Intermountain West, the Rockies, the Plains north of the Red River (south), the northern Lower Mississippi Valley, the Ohio Valley, the central Appalachians, and the Virginias’ Piedmont. Some drought development is expected in a few areas adjacent to existing drought in central Idaho, southwestern New Mexico, areas along and near the South Dakota/Nebraska border, and a large part of the central and western Ohio Valley. The extant drought in the central and western parts of Hawaii are also expected to continue or worsen through the end of the month.
Wet weather has prevailed for several months across Puerto Rico and the Virgin Islands. As a result, the region is drought-free, and is expected to remain so through at least the end of September.
We also have an updated Seasonal Drought Outlook (link).
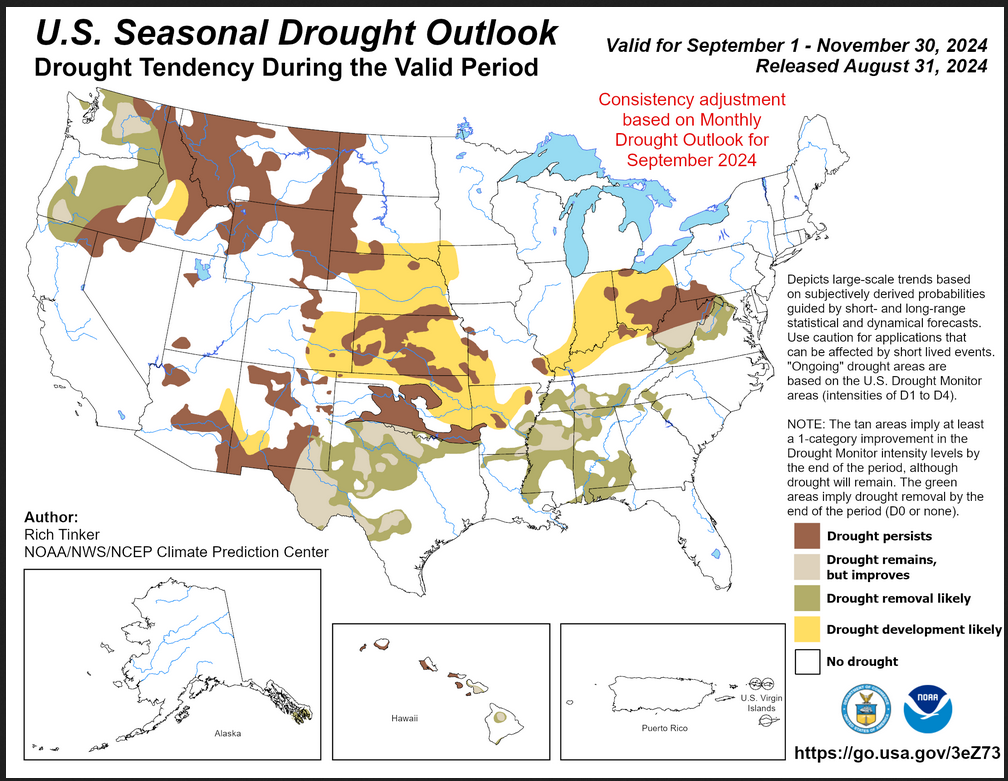
| This three-month outlook forecast is a combination of the mid-month three-month drought forecast and the revised drought forecast for September. Since I have a low level of confidence in the NOAA Outlooks for October and November I have a low level of confidence for this seasonal drought outlook. |
| To update this forecast (which updates on Tuesdays), click HERE |
It is useful to review the prior month.
Month-to-date Temperature as the current month evolves can be found at https://hprcc.unl.edu/products/maps/acis/MonthTDeptUS.png
Month-to-date Precipitation as the current month evolves can be found at https://hprcc.unl.edu/products/maps/acis/MonthPNormUS.png
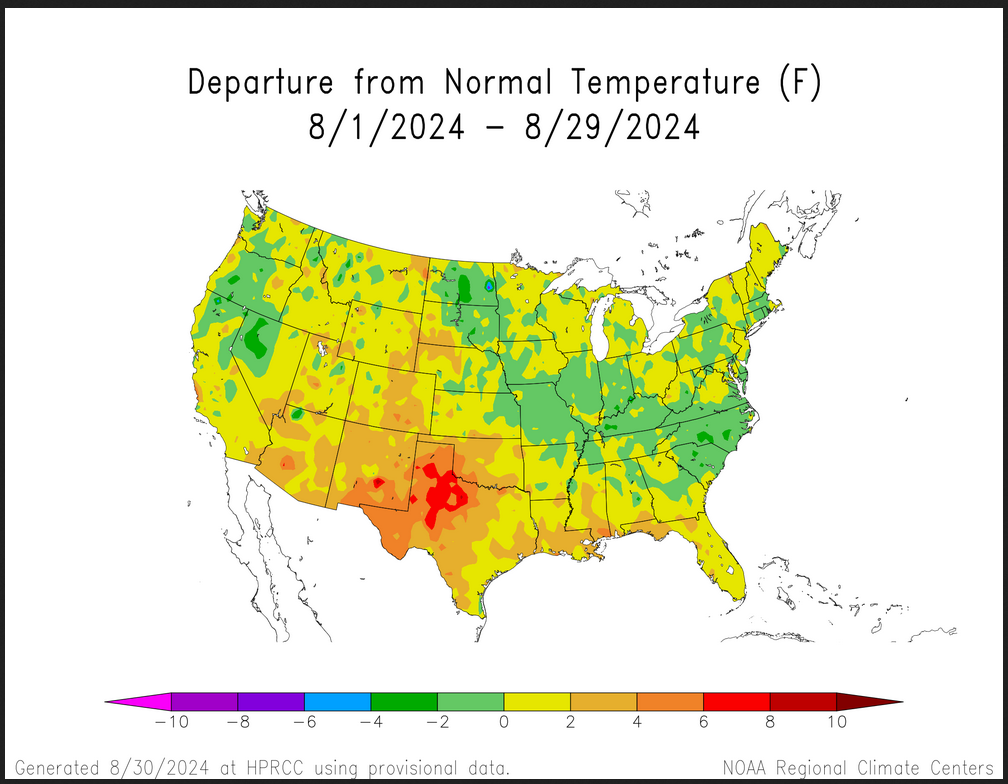
| You see an interesting pattern of warm, cool, warm with respect to a normal August. |
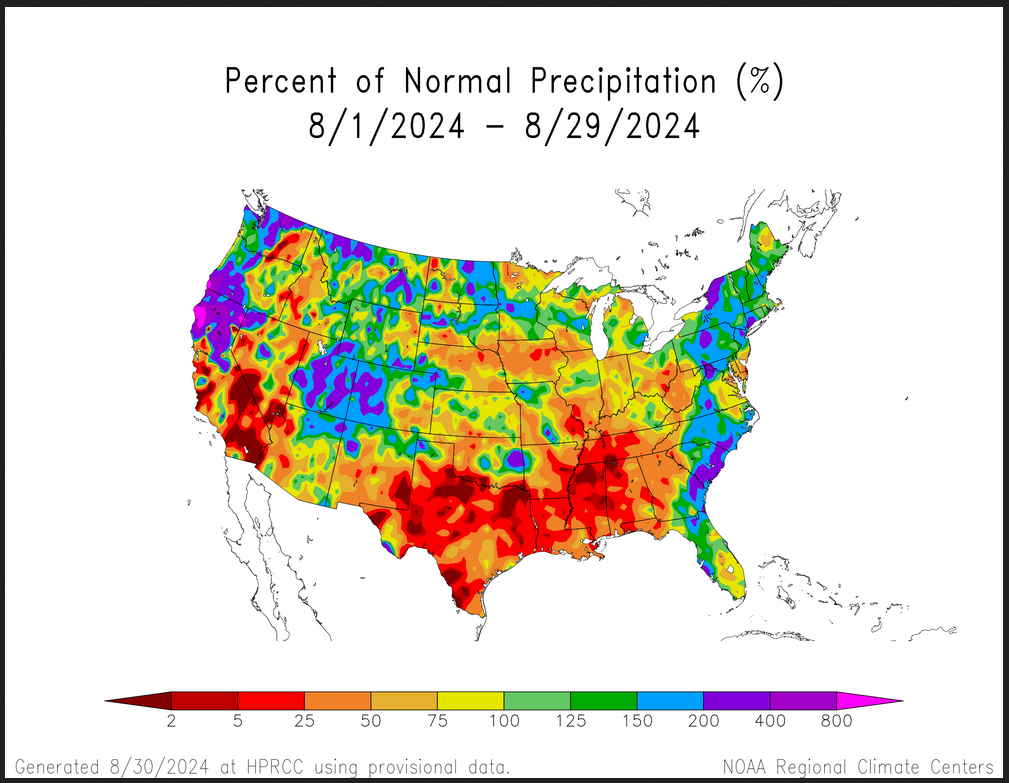
| You see both large areas of less than normal precipitation and more than normal precipitation. It is somewhat related to the August temperature pattern. |
Fire Outlook (The Site has Moved and I have not figured out how to fully use the new site yet. The link is HERE.
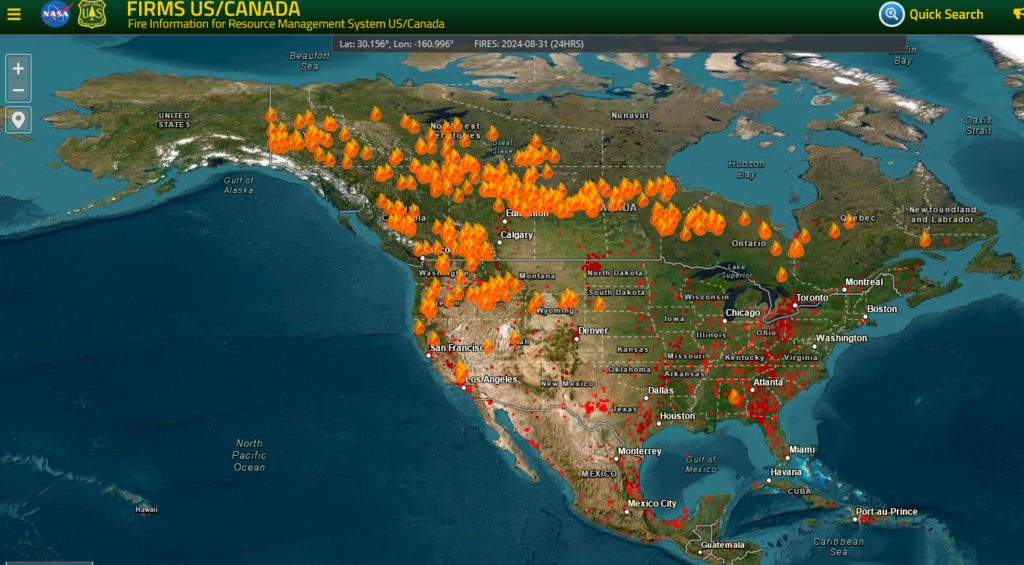
| But they for sure have good-looking maps. I will try to provide more information on the use of this website in the future. Canada has the major wildfire problem right now. |
| I hope you found this article interesting and useful |