A recent study found drought in the United States has led to approximately 300 million MWh in lost hydropower and $28 billion in lost revenue between 2003 and 2020.
Unraveling the hydropower vulnerability to drought in the United States
Pouya Moghaddasi
et al 2024
Environ. Res. Lett. 19 084038 DOI 10.1088/1748-9326/ad6200
Pouya Moghaddasi1,2,* , Keyhan Gavahi1,2, Hamed Moftakhari1,2 and Hamid Moradkhani1,2,*
This article is OPEN ACCESS so I have reproduced it here in its entirety. It is very well written so I have not seen the need to add comments to the article but I might highlight certain sentences. I will provide one caution which is that the period studied is a period that was characterized by a lot of drought so it may not be fully representative of the future.
Abstract
Drought, a potent natural climatic phenomenon, significantly challenges hydropower systems, bearing adverse consequences for economies, societies, and the environment. This study delves into the profound impact of drought on hydropower generation (HG) in the United States, revealing a robust correlation between hydrologic drought and hydroelectricity generation. Our analysis of the period from 2003 to 2020 for the Contiguous United States (CONUS) indicates that drought events led to a considerable decline in hydroelectricity generation, amounting to approximately 300 million MWh, and resulting in an estimated loss of $28 billion to the sector. Moreover, our findings highlight the adverse environmental effect of drought-induced HG reductions, which are often compensated by increased reliance on natural gas usage, which led to substantial emissions of carbon dioxide (CO2), sulfur dioxide (SO2), and nitrogen oxide (NOX), totaling 161 700 kilotons, 1199 tons, and 181 977 tons, respectively. In addition to these findings, we assess the state-level vulnerability of hydropower to drought, identifying Washington and California as the most vulnerable states, while Nevada exhibits the least vulnerability. Overall, this study enhances understanding of the multifaceted effects of drought on hydropower, which can assist in informing policies and practices related to drought management and energy production.
Some may need to click on “read more” to access the full article.
1. Introduction
Hydropower plants generate electricity from the kinetic energy of flowing water, which is a sustainable and renewable energy source [1–7]. In the United States, hydropower is one of the main sources of renewable energy [8] accounting for 6.3% of the country’s total electricity generation in 2021 and 31.5% of its renewable energy production [9, 10]. Despite some emissions occurring in hydropower plants, they still offer a more environmentally friendly option compared to fossil fuel power plants, emitting fewer greenhouse gases per kilowatt-hour of electricity generated [1, 11–13].
In hydropower plants, electricity generation involves converting the potential energy of water flow, known as hydraulic head, into electrical energy [14]. The magnitude of hydropower generation (HG) depends on the hydraulic head and the flow rate of water; larger flows or higher heads result in more electricity. Storage systems accumulate water in reservoirs via dams, optimizing flow through turbines and augmenting hydraulic head. Run-of-river systems rely on natural water flow and typically have lower hydraulic heads, making them more susceptible to streamflow fluctuations and volatile electricity generation. On the contrary, in storage systems, prolonged low flow can reduce hydraulic head and significantly decrease HG [12, 15, 16]. Therefore, hydrologic drought, assessed by comparing streamflow values to historical climatology, adversely affects HG causing a substantial decline in electricity production and putting energy security at risk [17–21]. Therefore, in order to improve energy planning and administration, it is crucial to characterize the impact of drought on hydroelectric production.
The consequences of drought extend beyond its impact on hydropower production, encompassing socioeconomic and environmental ramifications resulting from the decreased HG. The emissions from the power sector make up a substantial portion of total carbon dioxide (CO2) emissions [22–24] in the United States [22, 23, 25], and drought conditions can impact the fluctuation of emissions at the state and national levels [24, 26]. For instance, drought in California during 2012–2016 caused a significant rise in CO2 emissions from the energy sector, with an estimated increase of 33% in annual emissions as compared to pre-drought condition [27]. It also resulted in economic losses of 10 billion dollars throughout the state [28]. An estimate of the economic damage caused by this drought to California’s electric power grid was 2.45 billion dollars [29] representing the estimated market value of hydropower that could not have been generated due to the drought during the years 2012–2016 [30].
In this study, we specifically focus on the vulnerability of HG to hydrologic drought and assess the impact of drought on hydroelectricity generation across the United States. We begin by calculating hydrologic drought indicator and generating spatiotemporal drought maps. Streamflow data from 150 selected USGS stations for the period of 2003–2020 over the contiguous United States (CONUS) are used to characterize hydrologic drought. Subsequently, we calculate the correlation coefficient between hydrological drought and HG data to investigate the potential relationship between these variables. Additionally, the economic impact of drought on the energy sector is quantified by considering the economic loss due to the reduction in hydropower. Moreover, we assess the environmental impact of drought due to hydropower reduction. We estimate emissions resulting from using alternative energy sources to compensate for the reduction in hydropower. The reduction in hydropower necessitates the use of other energy sources to ensure the reliability of energy supply. However, such substitute energy sources may result in harmful emissions.
To illustrate the challenges presented by drought-induced conditions on HG, the hydropower vulnerability to drought is calculated across the CONUS. To develop this map, we define a set of indicators to evaluate each component of hydropower vulnerability. To estimate the relative importance of each of these indicators with their associated uncertainties, we used Latin hypercube sampling (LHS) method. Then, by aggregating vulnerability indicators, we assessed the vulnerability of hydropower to drought and identified regions that are more susceptible to such hydroclimate extremes. Consequently, this research provides valuable insights on the effects of drought on the hydropower system such that energy policymakers and stakeholders can utilize these findings to develop effective contingency plans that aim to mitigate the adverse impacts of drought on the hydroelectric industry.
2. Methods
2.1. Data
we utilized a targeted selection of streamflow data stations from the USGS [31] across the CONUS, as identified by Turner et al [32], focusing on 150 distinct HUC4 watersheds known for their conventional hydroelectric power plants. All of these stations have data coverage exceeding 90% in terms of temporal availability during this 18 year period. This means that for each of these stations, data are available for more than 90% of the days between 2003 and 2020, ensuring a high level of completeness and reliability in our analysis. The streamflow data, which had a daily temporal resolution, was utilized to evaluate hydrological drought. Additionally, we applied a moving window smoother to mitigate short-term fluctuations, thus enhancing the overall quality of the data utilized in our analysis.
Additionally, We used monthly HG data from the RectifHyd [32] and EIA-923 datasets, covering U.S. scale, plant-level data for approximately 1400 power plants from 2003 to 2020 [32]. We also gathered monthly retail electricity prices [33] as well as emission intensities (CO2, SO2, and NOx emissions) data from EIA [34].
2.2. Drought and HG relationship
In order to assess the connection between drought and HG, we calculate the correlation coefficient (CC) with its corresponding p-value [35].
The CC between the variables HG and drought index (DI) is calculated using equation (1):
where represents the HG for the ith month, represents DI for the ith month, is the mean of the HG across all months, and is the mean of DI across all months.
To determine the statistical significance of the correlation between HG and DI, we compute the test statistic (t) formulas shown in equation (2):
where CC is the Pearson correlation coefficient between HG and DI, and n is the number of months with no missing data for both variables. The degrees of freedom for the t-distribution are given by n − 2, which accounts for the estimation of two parameters (the mean and variance) in the correlation analysis [36]. The p-value associated with the test statistic can be calculated as 2 × Pr (T > |t|), where Pr denotes probability and T follows a t-distribution with n − 2 degrees of freedom [37]. The p-value represents the probability of obtaining a test statistic as extreme as t under the null hypothesis. A lower p-value suggests a higher statistical significance of the observed correlation.
By comparing the p-value to a significance level, we determine whether the correlation between HG and DI is statistically significant. If the p-value is less than the significance level, we reject the null hypothesis and conclude that there is a significant linear relationship between HG and DI [38].
2.3. Calculating hydrologic drought
To establish a streamflow climatology, we collected streamflow values for a specific day over a period of 18 years from every station in each state. In this context, climatology refers to the long-term conditions of streamflow for each day of the year, providing a baseline against which current streamflow can be compared. To construct the streamflow climatology, we first gather daily streamflow data from each monitoring station for a period of 18 years. The climatology for each calendar day is then assembled by collating the streamflow values for that specific day across all years. For instance, to create the streamflow climatology for January 3, we aggregated streamflow data of 3 January for all 18 years.
To increase the sample size and make the record smoother, we considered a 5 d moving window [39]. For example, the streamflow climatology for 3 January is created by aggregating all the streamflow values from 1 January to 5 January across all years, resulting in a total of 90 values for each calendar day (5 d multiplied by 18 years).
The resulting climatology was then used to calculate the daily streamflow percentiles by comparing each day’s streamflow value against the climatology (5 d × 18 years = 90 values). Then, the streamflow percentiles of individual stations within each state were averaged to derive a drought percentile representative of that particular state
where P is streamflow percentile for a station, representing hydrological drought, n is ordinal rank of a streamflow value in the climatology of the station, W is window size (5 d), and y is the number of years used to calculate climatology (18 years). Drought conditions were identified when the streamflow fell below the 30th percentile [40], marking these periods as times of significantly reduced water availability compared to the historical record.
2.4. Environmental and economic impact
To estimate the environmental and economic impact of drought, we should first determine the reduction in hydropower production in each hydropower plants during our study period. To do this, we compared HG in dry months with long-term monthly average of HG during typical water years for the same months. Typical water years are defined as years without drought occurrences. This approach, employing the long-term monthly average as our benchmark, enables us to properly reflect the natural variability in hydropower availability, assuming that the capacity of the hydropower fleet remains relatively stable throughout the analysis period. Although the hydropower infrastructure may undergo changes, this baseline is chosen because it represents typical generation patterns, which helps in accurately identifying deviations in hydropower production due to drought conditions. This approach aligns with methodologies employed in established studies such as Gleick [29], van Vliet et al [19], and Mostafazadeh et al [41], which utilized long-term averages to assess the impact of hydrological changes effectively. Despite its limitations, this method provides a consistent baseline for measuring fluctuations due to drought, smoothing out short-term anomalies in the data.
By examining historical streamflow patterns and identifying years without drought conditions, we can establish a baseline for average monthly generation levels during non-drought years. Subsequently, we compare HG in dry months during the study period with this baseline to quantify the reduction in hydropower production caused by droughts. In the next step, we calculate economic loss caused by hydropower reduction according to electricity prices in each state and year using the following equation:
where EL represents the economic loss in dollars, is year, is month number, indicates the electricity price in dollars per megawatt-hour (MWh), and
is the hydropower reduction in MWh. While this method provides an estimate of the economic impact on the hydropower sector, it may not fully capture the variability in electricity prices during drought periods, which can affect the overall economic impact.
After estimating the economic impact at the plant level, we calculated the overall economic impact at the state level by summing these impacts within each state. This state-level approach was chosen due to the availability of state-specific data and the utility of these insights for state policymakers. Although our initial analyses were carried out at the plant level for greater accuracy, we aggregated these results to the state level by summing plant-level results within each state to enhance visualization and to better inform state-level energy planning and policy decisions.
The analysis of state-level energy profiles revealed a pattern across multiple states: reductions in hydroelectric power generally corresponded with increases in natural gas generation. For instance, California’s experience during severe drought conditions showed a significant reliance on natural gas to fulfill energy demands, as detailed by the U.S. Energy Information Administration [42]. Furthermore, the study by Herrera–Estrada et al [24] supports the correlation between drought conditions and increased natural gas generation in many regions such as California, Idaho, Oregon, and Washington, thus supporting the assumptions made in our study.
Therefore, in our emissions analysis, we assume that reductions in hydroelectric generation are predominantly compensated by increased natural gas usage. However, we acknowledge that this assumption may not fully encapsulate the complexity of the electricity grid dynamics and inter-state electricity flows, which could also play significant roles in compensating for the reductions in hydroelectric power. Given this context, we employed equation (5) to estimate the environmental impacts (i.e. CO2, SO2, and NOx emissions) due to the shift to natural gas:
where GE is gas emission (tons) for each specific gas, is year, is month, is the emission factor in tons of emissions per MWh of electricity generated for natural gas, and represents the hydropower reduction in MWh. The emission factors are sourced from the U.S. Energy Information Administration (EIA) [43] and they reflect the average emissions associated with natural gas power generation. While our study focuses on the state-level impacts of increased fossil fuel consumption due to reduced HG, we recognize that the environmental effects of higher fossil fuel use, such as gas emissions, extend beyond state and national boundaries. For the purpose of this study, we assumed that these effects remain within state boundaries.
2.5. Vulnerability assessment
To assess the vulnerability of hydropower, we first defined relevant indicators, including drought frequency and population, as indicators for exposure, reduction in HG and the economic impact of drought on the hydroelectricity sector as indicators for sensitivity, and energy strength and economic strength along with drought plan availability as indicators for adaptive capacity. To account for uncertainty in the weights assigned to these indicators, we employed the LHS method [44]. The LHS method generates random samples of parameters, making it an effective tool in Monte Carlo simulations [45–47]. By employing LHS, we can effectively characterize the uncertainty while minimizing the number of simulations required [44, 48, 49]. Using the LHS method enables us to explore various combinations of indicator weights to evaluate their potential impacts on the vulnerability assessment. This approach ensures a more comprehensive analysis, considering different scenarios and reducing the reliance on a single set of fixed weights, which can be subject to biases or limitations. Through this process, we generated 1000 sets of random weights for the indicators, which were then used to calculate the weighted average of all indicators to determine the vulnerability index for each state (equation (6))
where I is indicator value, and w is indicator weight.
By repeating this process, we obtained a distribution of weighted average values, which allowed us to better understand the variability and uncertainty in the vulnerability assessment. This approach provides a probabilistic assessment of the state’s hydropower vulnerability to drought. However, it is essential to acknowledge that we lack observed data for directly validating vulnerability. Nonetheless, the probabilistic approach used in the LHS method helps to understand the variability with estimated uncertainty in the vulnerability calculation.
3. Results and discussion
3.1. Drought and HG relationship
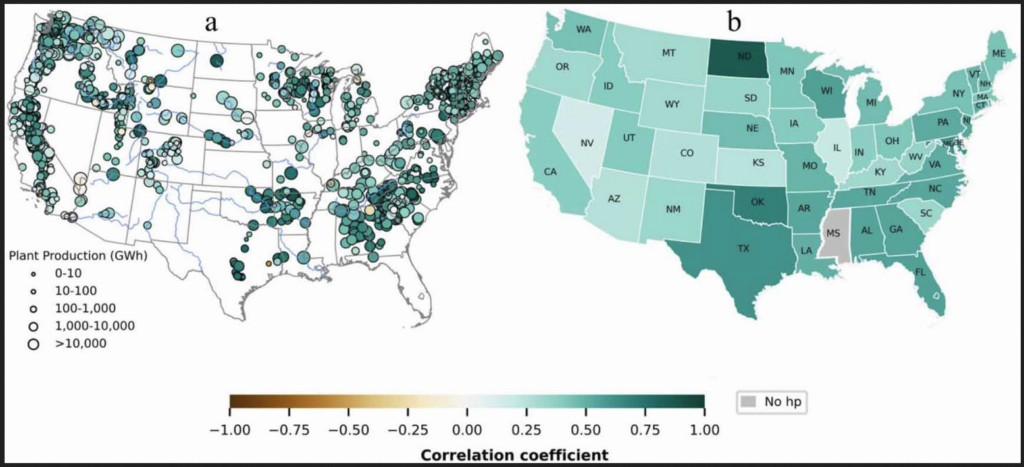
To evaluate the relationship between drought and HG, the CC is calculated and shown in figure 1. This analysis demonstrates how changes in drought conditions relate to HG from 2003 to 2020. In most states (42 out of 46), the calculated correlation coefficient has a p-value less than 0.05, indicating statistical significance at a 95% confidence level. This means that the observed associations between drought and HG in these states are meaningful. However, in Arizona, Colorado, Illinois, Nebraska, and Nevada, the correlation coefficient shows a p-value greater than 0.05, indicating that no strong statistical significance. According to this figure in most states, these two variables are highly correlated. In 41 out of 46 states correlation coefficient is greater than 30%. North Dakota, Oklahoma, Maryland, and Texas show the highest correlation coefficient among the states.
Figure 1. The correlation coefficient between hydropower generation and hydrological drought (2003–2020): (a) within individual hydropower plants and (b) across the U.S. States.
The relationship between drought and hydroelectricity generation is relatively weaker in states such as Nevada, Illinois, Kansas and Arizona the monthly HG and hydrological drought are not correlated. There are multiple factors that contribute to the lower correlation between hydropower production and hydrologic drought. Factors like over-year water storage in upstream reservoirs and soil moisture significantly influence this trend, especially following dry years when available precipitation is absorbed by the soil and used to replenish reservoirs rather than for power generation [21, 50]. The capacity of reservoir storage which ensures stability in electricity generation, is an additional significant factor that influences the lower correlation between HG and hydrological drought [21]. For instance, the Hoover Dam on the border between the Nevada and Arizona, has a large reservoir that ensures a reliable water supply for power generation, enabling consistent electricity production even in times of reduced rainfall. As a result, the correlation between HG and the hydrological DI is lower in such regions. Importantly, our study acknowledges the distinct allocations of electricity generation to Nevada and Arizona, due to the state line running through the powerhouse. Therefore, we meticulously preserved the separation of generation data for each state, without merging it into a single entity.
3.2. Economic impacts
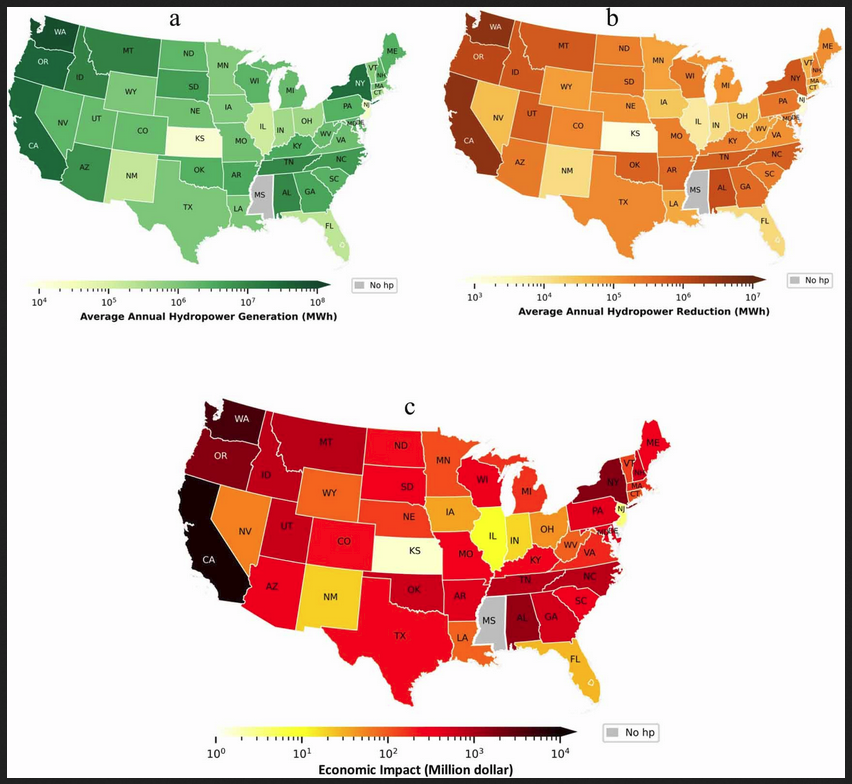
Considering the association found in most U.S. states between drought and HG, we further estimated the reduction in hydropower production during drought periods from 2003 to 2020, by comparing it with the average monthly generation levels during normal water years (figure 2(b)).
Figure 2. Drought impacts on hydropower generation. (a) Average annual hydropower generation (megawatt hours (MWh)), 2003–2020. (b) Average annual hydropower reduction (megawatt hours (MWh)) due to drought. (c) Economic impacts of drought on the energy sector.
We estimate that between 2003 and 2020, the cumulative reduction in hydroelectricity production in the U.S. amounted to approximately 300 million megawatt-hours (MWh), when compared to its long-term average from 2003 to 2020 this reduction is more than the total U.S. hydroelectricity generation observed in 2022. The impact of drought on HG is more significant on the West Coast of the United States compared to other regions. From 2003 to 2020, drought in the states of Washington, California, and Oregon led to a decrease in hydroelectric generation by 62, 59, and 20 million MWh, respectively, relative to the long-term average. This decrease is likely due to the increased frequency and intensity of drought conditions, which directly impacted the availability of water for hydroelectric power plants in these states. Furthermore, these states are also among the leading producers of hydropower, which amplified the impact of drought on their hydroelectric generation.
Our analysis continues by estimating the economic losses incurred from reduced HG. This involves calculating the economic losses associated with the reduction of HG, considering the variation in electricity prices over time across the CONUS. Figure 2(c) illustrates the monetary losses experienced by each state between 2003 and 2020 due to the decline in HG. Through our analysis, we estimated that the U.S. potentially incurred a loss of approximately $28 billion in the hydroelectricity sector due to drought between 2003 and 2020, 50% of which has incurred in the Western U.S. Specifically, drought in California, Washington, and Oregon are estimated to have led to cumulative economic losses exceeding 8.7, 4.2, and 1.6 billion dollars, respectively. This can be attributed to the greater impact of drought on hydropower reduction in these states. Also, these states are characterized by relatively high electricity prices, which in turn exacerbates the financial losses brought about by the reduction in HG due to the impact of drought. In contrast, Rhode Island, Kansas, New Jersey, and Illinois experienced minimal economic impacts due to their lower hydropower production and lesser drought occurrences. These findings underscore the necessity of managing drought impacts on hydropower to minimize economic losses in the energy sector. Effective strategies to address these challenges include improving drought forecasting and early warning systems for better preparedness and response [51, 52]. Optimizing water management practices is crucial to maximize hydropower potential during periods of scarcity [53]. Diversifying energy sources is key to reducing reliance on hydropower and enhancing sector resilience to drought fluctuations [54, 55]. Moreover, implementing economic policies like dynamic electricity pricing and drought insurance for energy producers can provide financial stability against water availability variability [56, 57]. Together, these approaches form a comprehensive strategy to safeguard the hydroelectric sector from the adverse economic effects of drought.
3.3. Environmental impacts
In the face of drought-induced challenges to HG, comprehending its impacts and effectively managing the energy sector becomes imperative. Our detailed analysis of the U.S. states’ energy profile, as outlined in the methodology section, demonstrates that natural gas often serves as the primary alternative source of energy in response to a decrease in hydropower production. Consequently, the increased use of natural gas for electricity production has led to a substantial increase in the emission of harmful gases including CO2, SO2, and NOX [58]. The accumulation of CO2 and other greenhouse gases in the atmosphere contribute to global warming [36], sea level rise [59, 60] and altered weather patterns. Additionally, the release of SO2 and NOx into the environment leads to acid deposition [61], impacting soil and water quality [62, 63], as well as causing damage to forests and vegetation [64]. Also, NOx plays a role in the formation of tropospheric ozone [65], and when exposed to sunlight, it can have adverse effects on human health [66, 67] and agricultural yields [58, 68, 69].
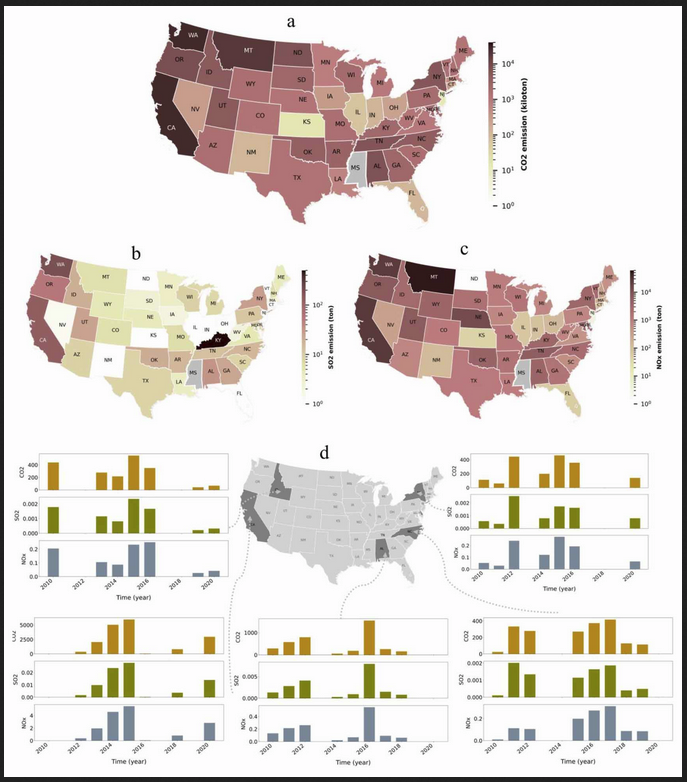
In figure 3, we estimate CO2, SO2, and NOx emissions associated with changes in electricity generation from hydroelectricity to natural gas due to the impact of drought in U.S. states. Our analysis indicates that from 2003 to 2020, drought in the U.S likely led to the release of a substantial amount of CO2, SO2, and NOX into the environment. Compared to the baseline emission in 2020, which were 1.59 billion tons of CO2, 0.79 million short tons of SO2, and 0.74 million short tons of NOx, the estimated additional emissions during the study period were approximately 10.2% of CO2, 0.15% of SO2, and 24.48% of NOX. Specifically, this corresponds to an extra 161 700 kilotons of CO2, 1199 tons of SO2, and 181 997 tons of NOX [53]. While the short-term increase in emissions due to drought may not seem alarming on its own, it is crucial to consider the cumulative impact of future droughts on the environment. Droughts can become more frequent and intense with the changing climate, leading to sustained periods of reduced HG and subsequent increases in greenhouse gas emissions. These findings provide valuable insights into the immediate impact of drought on emissions. However, to fully understand the potential consequences, we must also consider the projected frequency and intensity of future drought events.
Figure 3. Environmental impact of drought due to hydropower reduction. Total additional (a) CO2 (kiloton) emission, (b) SO2 (ton) emission, and (c) NOx (ton) emission from natural gas use during 2003–2020. (d) time series of CO2, SO2, and NOx emissions for five selected states.
Our results, as shown in figure 3(a), demonstrate that the states of Washington, California, Montana, and Oregon have recorded the most significant increments in CO2 emissions during the period 2003–2020 as a result of relying on natural gas to make up for the decrease in hydropower. The estimate of CO2 emissions during our study period in Washington was 27.4 million metric tons, the highest among the aforementioned states. Meanwhile, California had the second-highest CO2 emissions at 27.2 million metric tons, followed by Montana at 18.3 million metric tons and Oregon at 8.1 million metric tons. The results indicate that Kentucky, Washington, and California have experienced the most pronounced increases in SO2 emissions, from 2003 to 2020, by 493, 193, and 131 tons, respectively, as illustrated in figure 2(c). Additionally, based on our analysis, Montana, California, and Washington have the most significant rises in NOx emissions, with increases of 51, 25.7, and 24.4 kilotons respectively, from 2003 to 2020 (figure 3(c)). The larger impact of drought on hydropower reduction in Western and Northwestern US including California, Oregon and Washington is likely due to their heavy reliance on HG. As a result, drought-related reductions in HG have a more substantial impact on their overall energy production, leading to a greater increase in gas emissions to compensate for the shortfall. Moreover, the states of Montana and Kentucky exhibit relatively high gas emission per kWh in power plants. In these states, power plants may be less efficient in terms of converting fuel to electricity, resulting in a higher emission intensity per unit of electricity generated. Consequently, during drought periods when hydropower production declines, these states may experience a more substantial increase in gas emissions compared to other states with more efficient and cleaner power plants.
3.4. Vulnerability assessment
Amidst the challenges posed by drought-induced conditions on HG, it becomes crucial to contemplate the vulnerability of hydropower to drought. Vulnerability refers to the inclination or predisposition to experience negative impacts and encompasses several concepts and components, such as being sensitive or susceptible to harm and lacking the ability to cope and adapt [70]. The hydropower vulnerability to drought is determined by means of a set of indicators that pertain to three distinct categories: exposure, sensitivity, and adaptive capacity [71–73]. The level of exposure of a state to drought is evaluated using two indicators: drought frequency, indicating how often the state experiences drought conditions, and population size, representing an indirect measure of the state’s exposure to drought-related challenges [49, 74]. The sensitivity indicators have a connection to both the energy and economic conditions of the state. These indicators determine the likelihood of the state experiencing adverse effects during periods of drought. We have selected the reduction in HG caused by drought, as well as the economic impact of drought on the hydroelectricity sector, which are calculated as sensitivity indicators in the environmental and economic impacts section. Adaptive capacity refers to the state’s and its population’s capability to adapt and recover from drought occurrences. We quantify adaptive capacity through indicators including the energy diversity of the state, which assesses the portion of the state’s total energy generation from sources other than hydropower; the economic strength represented by GDP; and the state’s strategies to mitigate drought impacts, measured by the availability of a drought plan. Drought plan availability is assessed with a simple scoring system: states with an established drought plan are assigned a score of 1, while those without are scored as 0 [49]. We recognize that the effectiveness of these plans may vary and that some planning may occur at a basin level rather than state level. However, the presence of a plan indicates some level of preparedness.
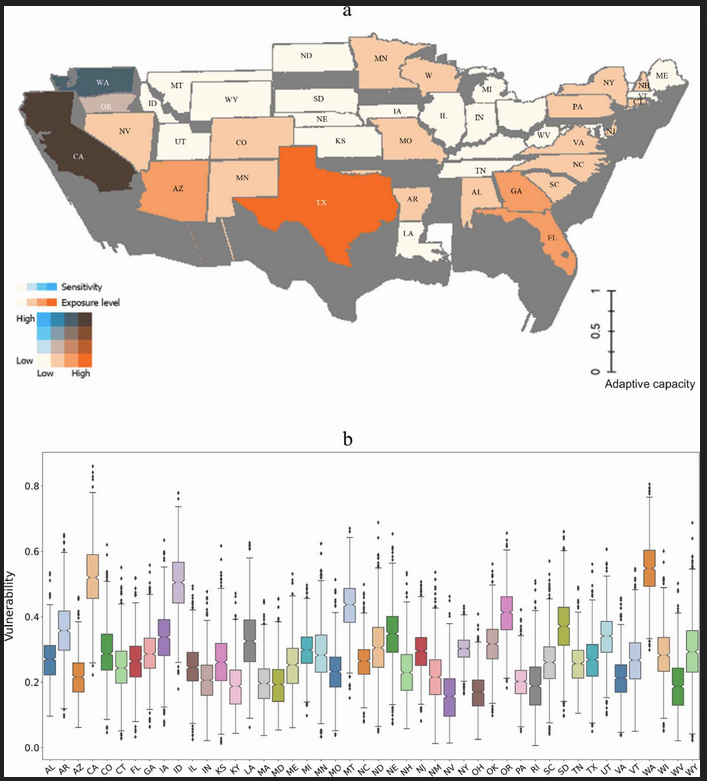
As explained in the method section, the vulnerability of hydropower to drought is assessed by aggregating vulnerability indicators using the LHS method, with the results presented in figure 4. Figure 4(a) displays the relative exposure, sensitivity, and adaptive capacity of each state as sub-indices used in calculation of the overall vulnerability score. The varying colors represent different levels of exposure and sensitivity, with darker shades of orange indicating higher exposure levels and darker shades of blue indicating greater sensitivity levels. The adaptive capacity of each state is represented by its respective height. Our results indicate that California, Texas, and Florida, are more exposed to drought. Also, the sensitivity scores of Washington and California were found to be significantly higher compared to those of other states. Furthermore, the heights of each state in figure 4(a), demonstrate that California, Texas, and Florida possess a more robust adaptive capacity, allowing them to cope with and recover from drought conditions more effectively. This is consistent with the findings of Engstrom et al [49].
Figure 4. Hydropower vulnerability to drought. (a) Vulnerability indicators level (i.e. sensitivity, exposure, and adaptive capacity level), (b) likelihood of hydropower vulnerability to drought for each state.
Moreover, figure 4(b) displays the likelihood of vulnerability of each state across the CONUS. The representation offers the main advantage of simplifying the comprehension of the vulnerability index, while still considering the uncertainty of the assigned weights to indicators. Our findings show that the West Coast, particularly the states of Washington and California, exhibits a notably higher vulnerability compared to other states, while Nevada is the least vulnerable. Washington’s prominent role in HG, contributing around 27% of the nation’s total hydroelectricity in 2020 [34], and its heavy reliance on hydropower (over 64% of electricity derived) contribute to its high vulnerability. Despite California’s commendable adaptability, it still ranks as the second most vulnerable state to hydropower in the U.S. This can be largely attributed to the state’s high sensitivity and exposure levels. In addition, the whisker lengths in figure 4(b) represent the variability of vulnerability scores across different states, reflecting the variation and uncertainty associated with the vulnerability assessment. States with longer whisker lengths have a wider range of vulnerability scores, indicating greater uncertainty in their vulnerability estimates. On the other hand, states with shorter whisker lengths have more consistent vulnerability scores, suggesting a higher level of confidence in the assessment results. According to this figure, Wyoming, California, and North Dakota exhibit higher uncertainty in vulnerability scores compared to other states. On the other hand, New York, Pennsylvania, and Ohio display a lower degree of uncertainty in their vulnerability scores.
As our findings highlight the significant impact of drought on HG and its associated environmental consequences, emphasizing the need for states to adopt more comprehensive and sustainable energy strategies. Diversifying the energy mix with renewable sources such as wind and solar can significantly enhance resilience against drought and promote a sustainable energy future.
Furthermore, state governments should collaborate to form regional or inter-state energy networks, leveraging each other’s strengths in renewable energy sources and energy storage capacities. Such collaborations can create a more interconnected and robust energy grid, reducing vulnerability to drought-induced hydropower disruptions.
Lastly, states should prioritize policies and incentives that promote energy efficiency and conservation. By encouraging energy-efficient practices among individuals, businesses, and industries, states can reduce overall energy demand and lessen reliance on hydropower during peak periods. Implementing these measures alongside expanding renewable energy sources can strengthen the energy sector’s resilience and sustainability, effectively mitigating the impacts of drought.
4. Conclusion
This study examines the impacts of drought on HG in the United States. Our analyses reveal significant correlations between hydrologic drought and hydroelectricity production in the majority of U.S. states. Our examination of streamflow data from 2003–2020 shows that drought events have led to a reduction of approximately 300 million MWh in hydroelectricity production, resulting in an estimated $28 billion loss to the hydropower sector. The adverse impact of drought is especially apparent across Western and Northwestern states including California, Oregon, and Washington which have experienced substantial drops in HG.
Additionally, our environmental analysis indicates that decreased hydropower production is often compensated through increased reliance on natural gas-based power generation. This substitution has led to significant increases in emissions of major air pollutants, including 161 700 kilotons of carbon dioxide (CO2), 119.9 tons of sulfur dioxide (SO2), and 181 977 tons of nitrogen oxide (NOx) during the study period. The additional release of these harmful emissions underscores the far-reaching environmental and public health consequences stemming from drought-related disruptions to renewable HG.
Although this study focuses primarily on the impacts of drought on HG, we recognize the broader implications of drought conditions, including the depletion of groundwater levels and increased water demands. These factors can exacerbate the challenges faced during drought periods and have implications for water resources management and energy production. While a comprehensive analysis incorporating all these aspects was beyond the scope of this study, we acknowledge that such an integrated approach could provide a more complete understanding of the impacts of drought and would be valuable for future research.
Furthermore, the state-level vulnerability assessment, which involves an analysis of exposure, sensitivity, and adaptive capacity indicators, reveals that Washington and California are the most vulnerable states to drought effects on hydropower, primarily owing to their heavy utilization and dependence on hydroelectricity. On the other end of the spectrum, the state of Nevada demonstrates the lowest drought vulnerability among U.S. states.
The findings from this study on the vulnerability of HG to droughts are intended to inform several key stakeholders:
1. Policy makers: policymakers can use these insights to develop strategies that mitigate the adverse effects of drought on HG. This could include investing in alternative renewable energy sources, improving water management practices, and implementing policies that promote energy efficiency.
2. Energy sector planners: energy planners can use the study’s results to better predict and prepare for the potential impacts of drought on HG. This could involve adjusting energy production strategies, optimizing water use efficiency, or incorporating alternative energy sources during periods of drought.
3. Academic and research community: the study contributes to the academic discourse on the interplay between climate variability and renewable energy production. It provides a basis for further research into adaptive strategies that can mitigate the impacts of droughts on renewable energy sources.
Additionally, the results can be applied in:
1. Risk assessment and management: the study’s vulnerability assessment framework can be adopted by state and regional authorities to conduct risk assessments for hydropower facilities. This will help in identifying the most vulnerable regions and implementing targeted interventions to reduce risk.
2. Public awareness and education: the findings can be used to raise public awareness about the impacts of drought on energy production and the importance of sustainable water and energy management practices. Educating the public can foster greater support for policies and initiatives aimed at enhancing energy resilience.
Overall, our study provides critical insights that can inform policies and practices related to drought management and energy production. As drought conditions are anticipated to become more frequent and intense due to climate change, prioritizing strategies to enhance the sustainability and resilience of the energy sector is imperative. This may involve diversification of energy sources, regional energy collaboration, and the promotion of energy efficiency measures. By taking proactive steps, states can better prepare for the challenges posed by drought, ultimately ensuring a more stable and sustainable energy future.
Acknowledgments
The authors acknowledge the financial support provided by the National Science Foundation (NSF-INFEWS) (Grant EAR-1856054).
–
I hope you found this article interesting and useful.
–
References
[1]Almeida R M et al 2019 Reducing greenhouse gas emissions of Amazon hydropower with strategic dam planning Nat. Commun.10 4281
[2]Gernaat D E H J, de Boer H S, Daioglou V, Yalew S G, Müller C and van Vuuren D P 2021 Climate change impacts on renewable energy supply Nat. Clim. Change11 119–25
[3]Gernaat D E H J, Bogaart P W, van Vuuren D P V, Biemans H and Niessink R 2017 High-resolution assessment of global technical and economic hydropower potential Nat. Energy2 821–8
[4]Apergis N, Chang T, Gupta R and Ziramba E 2016 Hydroelectricity consumption and economic growth nexus: evidence from a panel of ten largest hydroelectricity consumers Renew. Sustain. Energy Rev.62 318–25
[6]Arias M E, Farinosi F, Lee E, Livino A, Briscoe J and Moorcroft P R 2020 Impacts of climate change and deforestation on hydropower planning in the Brazilian Amazon Nat. Sustain.3 430–6
[7]Chaudhari S, Brown E, Quispe-Abad R, Moran E, Müller N and Pokhrel Y 2021 In-stream turbines for rethinking hydropower development in the Amazon basin Nat. Sustain.4 680–7
[10]Waldman J, Sharma S, Afshari S and Fekete B 2019 Solar-power replacement as a solution for hydropower foregone in US dam removals Nat. Sustain.2 872–8
[11]Levasseur A, Mercier-Blais S, Prairie Y T, Tremblay A and Turpin C 2021 Improving the accuracy of electricity carbon footprint: estimation of hydroelectric reservoir greenhouse gas emissions Renew. Sustain. Energy Rev.136 110433
[12]Wan W, Zhao J, Popat E, Herbert C and Döll P 2021 Analyzing the impact of streamflow drought on hydroelectricity production: a global-scale study Water Resour. Res.57 e2020WR028087
[14]Bilgili F, Lorente D B, Kuşkaya S, Ünlü F, Gençoğlu P and Rosha P 2021 The role of hydropower energy in the level of CO2 emissions: an application of continuous wavelet transform Renew. Energy178 283–94
[16]Tarroja B, AghaKouchak A and Samuelsen S 2016 Quantifying climate change impacts on hydropower generation and implications on electric grid greenhouse gas emissions and operation Energy111 295–305
[18]Zhao X, Huang G, Li Y and Lu C 2023 Responses of hydroelectricity generation to streamflow drought under climate change Renew. Sustain. Energy Rev.174 113141
[19]van Vliet M T H, Sheffield J, Wiberg D and Wood E F 2016 Impacts of recent drought and warm years on water resources and electricity supply worldwide Environ. Res. Lett.11 124021
[21]Turner S W D, Voisin N, Nelson K D and Tidwell V C 2022 Drought Impacts on Hydroelectric Power Generation in the Western United States (Pacific Northwest National Laboratory)
[24]Herrera-Estrada J E, Diffenbaugh N S, Wagner F, Craft A and Sheffield J 2018 Response of electricity sector air pollution emissions to drought conditions in the western United States Environ. Res. Lett.13 124032
[25]Bildirici M E and Gökmenoğlu S M 2017 Environmental pollution, hydropower energy consumption and economic growth: evidence from G7 countries Renew. Sustain. Energy Rev.75 68–85
[27]Hardin E, AghaKouchak A, Qomi M J A, Madani K, Tarroja B, Zhou Y, Yang T and Samuelsen S 2017 California drought increases CO2 footprint of energy Sustain. Cities Soc.28 450–2
[30]Kern J D, Su Y and Hill J 2020 A retrospective study of the 2012–2016 California drought and its impacts on the power sector Environ. Res. Lett.15 94008
[32]Turner S W D, Voisin N and Nelson K 2022 Revised monthly energy generation estimates for 1,500 hydroelectric power plants in the United States Sci. Data9 675
[40]Gavahi K, Abbaszadeh P and Moradkhani H 2022 How does precipitation data influence the land surface data assimilation for drought monitoring? Sci. Total Environ.831 154916
[41]Mostafazadeh R, Haji K, Esmali-Ouri A and Mirzaei S 2019 Estimating the monthly flow deficit during hydrological drought periods in gorganroud river basin J. Watershed Manage. Res.9 190–6
[42]U.S. Energy Information Administration 2014 California drought leads to less hydropower, increased natural gas generation (available at: www.eia.gov/todayinenergy/detail.php?id=18271)
[44]Helton J C and Davis F J 2003 Latin hypercube sampling and the propagation of uncertainty in analyses of complex systems Reliab. Eng. Syst. Saf.81 23–69
[46]Moghaddasi P, Kerachian R and Sharghi S 2022 A stakeholder-based framework for improving the resilience of groundwater resources in arid regions J. Hydrol.609 127737
[48]McKay M D, Beckman R J and Conover W J 1979 A comparison of three methods for selecting values of input variables in the analysis of output from a computer code Technometrics21 239–45
[50]Tina G M and Nicolosi C F 2023 A statistical assessment of water availability for hydropower generation in the context of adequacy analyses Appl. Sci.13 1986
[53]Pereira-Cardenal S J, Mo B, Gjelsvik A, Riegels N D, Arnbjerg-Nielsen K and Bauer-Gottwein P 2016 Joint optimization of regional water-power systems Adv. Water Resour.92 200–7
[54]Pupo-Roncallo O, Campillo J, Ingham D, Hughes K and Pourkashanian M 2019 Large scale integration of renewable energy sources (RES) in the future Colombian energy system Energy186 115805
[55]Denault M, Dupuis D and Couture-Cardinal S 2009 Complementarity of hydro and wind power: improving the risk profile of energy inflows Energy Policy37 5376–84
[57]Foster B T, Kern J D and Characklis G W 2015 Mitigating hydrologic financial risk in hydropower generation using index-based financial instruments Water Resour. Econ.10 45–67
[59]Meehl G A, Washington W M, Collins W D, Arblaster J M, Hu A, Buja L E, Strand W G and Teng H 2005 How much more global warming and sea level rise? Science307 1769–72
[60]Irvine P J, Sriver R L and Keller K 2012 Tension between reducing sea-level rise and global warming through solar-radiation management Nat. Clim. Change2 97–100
[61]Tan L, Yang Q, Peng L, Xie C, Luo K and Zhou L 2022 Molecular engineering-based a dual-responsive fluorescent sensor for sulfur dioxide and nitric oxide detecting in acid rain and its imaging studies in biosystems J. Hazard. Mater.435 128947
[62]Cosby B J, Wright R F, Hornberger G M and Galloway J N 1985 Modeling the effects of acid deposition: estimation of long-term water quality responses in a small forested catchment Water Resour. Res.21 1591–601
[63]Duffy C, Prudhomme R, Duffy B, Gibbons J, Iannetta P P M, O’Donoghue C, Ryan M and Styles D 2022 Randomized national land management strategies for net-zero emissions Nat. Sustain.5 973–80
[64]de Vries W, Dobbertin M H, Solberg S, van Dobben H F and Schaub M 2014 Impacts of acid deposition, ozone exposure and weather conditions on forest ecosystems in Europe: an overview Plant Soil380 1–45
[65]Johnson C, Henshaw J and Mclnnes G 1992 Impact of aircraft and surface emissions of nitrogen oxides on tropospheric ozone and global warming Nature355 69–71
[67]Wang T, Jiang Z, Zhao B, Gu Y, Liou K-N, Kalandiyur N, Zhang D and Zhu Y 2020 Health co-benefits of achieving sustainable net-zero greenhouse gas emissions in California Nat. Sustain.3 597–605
[68]McGrath J M, Betzelberger A M, Wang S, Shook E, Zhu X-G, Long S P and Ainsworth E A 2015 An analysis of ozone damage to historical maize and soybean yields in the United States Proc. Natl Acad. Sci.112 14390–5
[71]Weis S W M, Agostini V N, Roth L M, Gilmer B, Schill S R, Knowles J E and Blyther R 2016 Assessing vulnerability: an integrated approach for mapping adaptive capacity, sensitivity, and exposure Clim. Change136 615–29
[72]Singh N P, Bantilan C and Byjesh K 2014 Vulnerability and policy relevance to drought in the semi-arid tropics of Asia—A retrospective analysis Weather Clim. Extrem.3 54–61
[74]Ahmadalipour A, Moradkhani H, Castelletti A and Magliocca N 2019 Future drought risk in Africa: integrating vulnerability, climate change, and population growth Sci. Total Environ.662 672–86
Mr. Silber is a mathematician and an economist with many years of experience in a variety of technologies. He started his career at Bell Telephone Laboratories and has worked in and provided consulting to many participants in the computer and communications industries. He has also been very involved with Natural Resources having been a V.P. of Planning and Financial Analysis for Kennecott Minerals. Mr. Silber has also taught a graduate course in Information Economics at Polytechnic University which is now part of New York University. Mr. Silber has served as an elected Supervisor and Secretary Treasurer of the Santa Fe - Pojoaque Soil and Water Conservation District. In addition to his consulting practice, Mr. Silber is working on a book that will address the economic issues related to Global Warming.