At the end of every month, NOAA updates its Outlook for the following month which in this case is August of 2024. We are reporting on that tonight.
There have been some significant changes in the Outlook for August and these are addressed in the NOAA Discussion so it is well worth reading. We provided the prior Mid-Month Outlook for August for comparison. It is easy to see the substantial changes in the weather outlook by comparing the Mid-Month and Updated Maps.
The article includes the Drought Outlook for August. NOAA also adjusted the previously issued Seasonal (ASO) Drought Outlook to reflect the changes in the August Drought Outlook. We also provide the Week 2/3 Tropical Outlook for the World.
The best way to understand the updated outlook for August is to view the maps and read the NOAA discussion. I have highlighted the key statements in the NOAA Discussion.
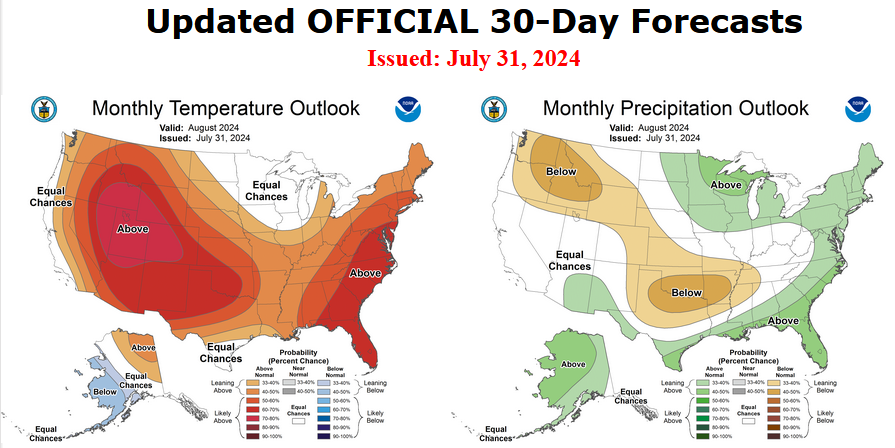
Here is the updated Outlook for August 2024.
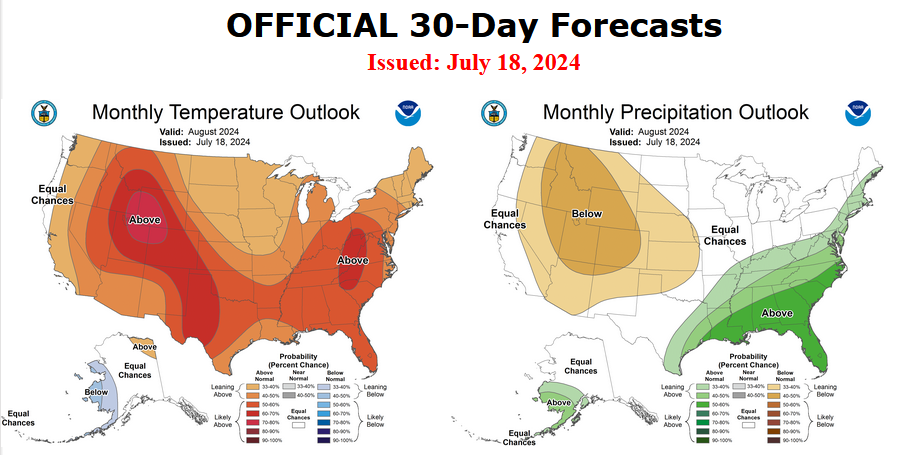
For Comparison Purposes, Here is the earlier Mid-Month Outlook for August.
| It is important to remember that the maps show deviations from the current definition of normal which is the period 1991 through 2020. So this is not a forecast of the absolute value of temperature or precipitation but the change from what is defined as normal or to use the technical term climatology.
It is a substantial change from what was issued on July 18, 2024. Remember, it is the first set of maps that are the current outlook for August. One expects some changes 13 days later. However, the changes to the updated August Outlook are significant, particularly with respect to precipitation. This then gives us some reason to question the (July 18, 2024) three-month ASO temperature and precipitation Outlooks which are shown in the following graphic. |
NOAA provided a combination of the Updated Outlook for August and the Three-Month Outlook.
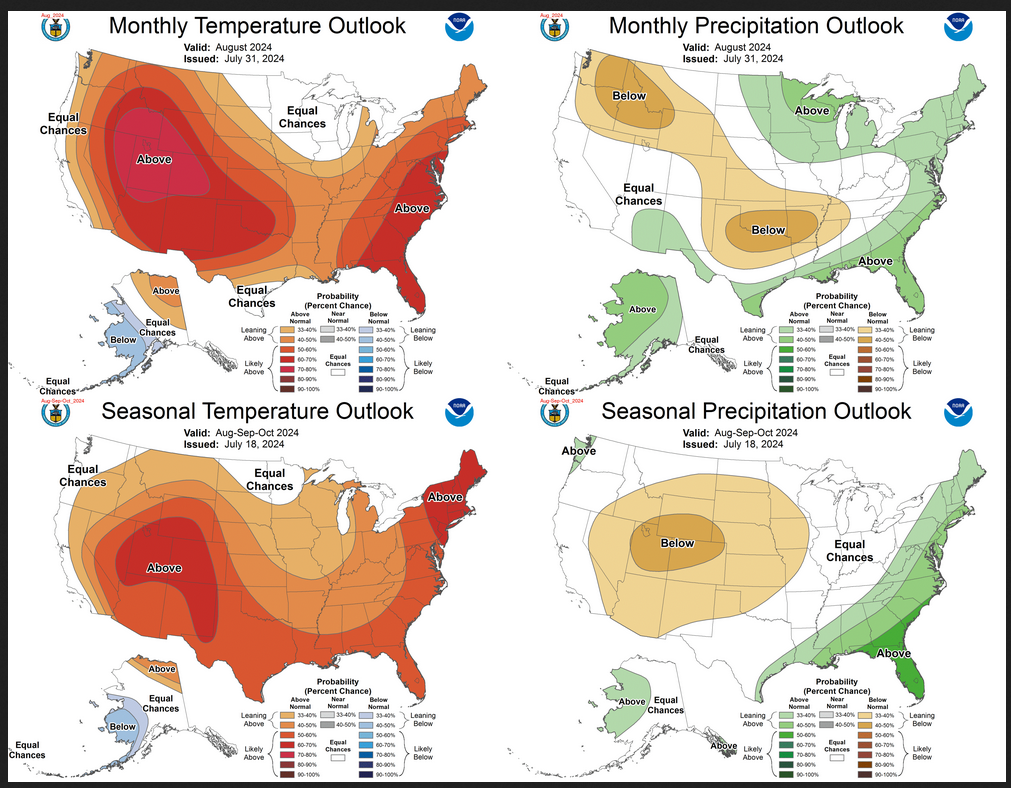
The top pair of maps are again the Updated Outlook for the new month. There is a temperature map and a precipitation map. The bottom row shows the three-month outlooks which includes August the new month. I think the outlook maps are self-explanatory.
To the extent that one can rely on a forecast, we would conclude that September and October will be very different than August, especially for precipitation. You can subtract Augusts from the three-month Outlook and divide by two to get a combined September-October Outlook.However given the major change in the new August outlook from what was issued on July 18, 2024, we might not trust the Seasonal Outlook issued on July 18, 2024. Something to think about. But the major factor is the projected slower onset of La Nina. Thus this change is consistent with the pattern the NOAA has been predicting although they have been playing catch-up. |
Some readers may need to click “Read More” to read the rest of the article. Some will feel that they have enough information. But there is a lot more information in the rest of this article.
| Our regular Daily Weather article can be found HERE. In addition to the short-term forecast it also provides the 6 – 10 day, 8 – 14 day, and Week 3 – 4 Outlooks. That is not a full month but close to it. So it is helpful if one wants to understand how the full-month forecast is expected to vary through the month. And the maps in the Daily Article update throughout the month. |
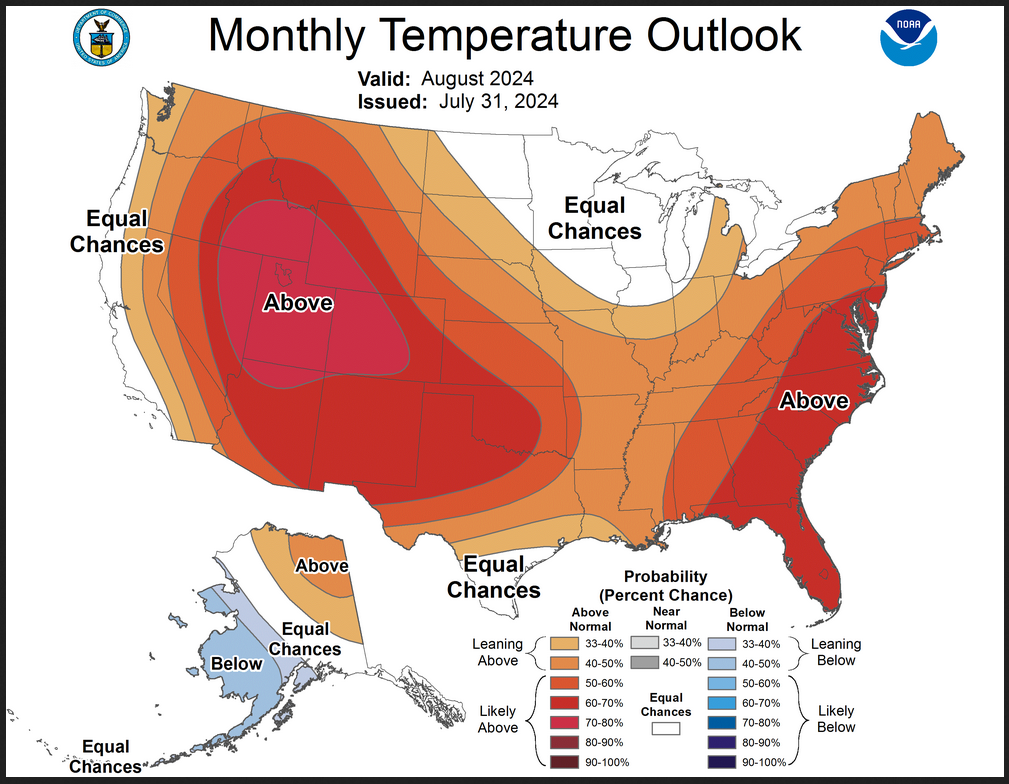
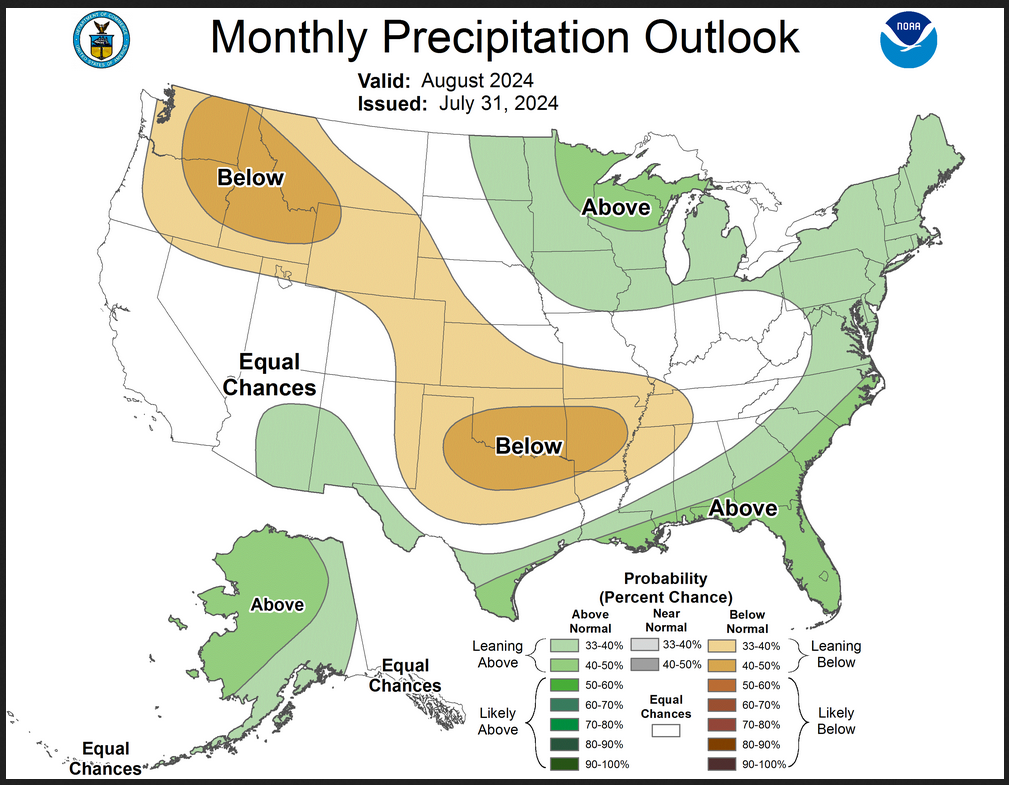
Here are larger versions of the August Temperature and Precipitation Outlook maps.
NOAA (Really the National Weather Service Climate Prediction Division CPC) Discussion. I have shown certain important points in bold type. My comments if any are in brackets [ ].
30-DAY OUTLOOK DISCUSSION FOR AUGUST 2024
The updated monthly temperature and precipitation outlooks for August 2024 are based on official forecasts and outlooks from WPC (week-1), CPC (week-2, weeks 3-4), and dynamical model guidance from the GEFS and European ensemble suite. A weighted GEFS-CFSv2 30-day forecast for both temperature and precipitation is also used, where weighting is based on recent 500-hPa height anomaly correlation scores. The updated outlooks also consider the latest soil moisture anomalies, coastal sea-surface temperatures (SSTs), 14-day precipitation deficits, initial conditions, climatology, long-term trends , and expected tropical cyclone activity in the Atlantic and East Pacific basins.
Temperature
The updated temperature outlook for August 2024 favors above-normal temperatures across much of the contiguous U.S. (CONUS) and most of the northeast half of the Alaska Mainland. Maximum probabilities exceed 60 percent over the Middle and Southern Atlantic coast states, and 70% over central portions of the Interior West. This broad expanse of favored warmer-than-normal temperatures is supported by the 30-day European ensemble forecast, 30-day weighted GEFS-CFSv2 temperature forecast, and is consistent with most of the dynamical model guidance and official temperature outlooks noted in the first paragraph. The 30-day European ensemble forecast depicts 500-hPa heights to be above-normal across practically all of the CONUS, with the larger height departures predicted over the West and Northeast. This leaves the general vicinity of the Mississippi Valley open to a weak mean trough and expected cooler surface temperatures. This weak trough, and the fact that this portion of the Lower 48 states has seen a large amount of temperature and precipitation variability over the past month, are the main reasons underpinning the forecast of Equal Chances (EC) of below-, near-, and above-normal temperatures. This is also the basis for reducing the probabilities for above-normal temperatures relative to the rest of the CONUS. Below-normal temperatures are favored over most of the southwestern half of the Alaska Mainland, the Alaska Peninsula, and the eastern Aleutians. This is supported by the last 9 runs of the CFSv2 model, anomalously cold SSTs near the western and northern coasts of Alaska, the 30-day European ensemble forecast, and the weighted GEFS-CFSv2 temperature forecast. Some of these tools, but not all, support above-normal temperature chances over the northeast half of the Mainland. In areas where temperature tools were at odds, or where temperature signals were weak, EC is indicated.
Precipitation
The updated precipitation outlook for August 2024 favors above-normal precipitation for the eastern Dakotas, Upper Mississippi Valley, Great Lakes region, Atlantic coast states, the Gulf Coast area, southern Texas, and into the Four Corners region. This is based on some of the objective tools and considers a very active hurricane season in the Atlantic basin that is forecasted. Relatively warm SSTs are observed along most of the Gulf and Atlantic coasts, which would benefit any tropical cyclones passing over them. The latest extended-range (out to 2 weeks) runs of the European ensemble and GEFS depict a significant chance of a tropical system approaching the Southeast coast sometime around August 8th and 9th. If this scenario materializes, portions of the Southern and Middle Atlantic coasts could easily receive enough rain to exceed their monthly normal precipitation for August. Over the vicinity of the Upper Mississippi Valley and Great Lakes region, the favored above-normal precipitation, which is predicted by many (but not all) of the tools, is consistent with the idea of a weak monthly mean trough over or just upstream of this region. Weak to moderate mid-level ridging centered over the northwestern CONUS favors a slight tilt in the odds towards above-normal precipitation for portions of the southern Four Corners states, in the deeper easterly flow south of the mean ridge axis. Therefore, a slightly enhanced monsoon is favored across this portion of the Southwest. This same ridge, along with negative soil moisture anomalies, favors below-normal precipitation across much of the northwestern quarter of the CONUS, with a southeastward extension across south-central portions of the Great Plains and MIssissippi Valley, and into western Tennessee. Elsewhere across the CONUS, EC is favored. For Alaska, above-normal precipitation is favored across most of the state, with the exception of EC over Southeast Alaska and the western Aleutians. This is primarily based on the 30-day European ensemble, and to a lesser extent, the GEFS-CFSv2 precipitation forecast, the last several runs of the CFS, and extended-range precipitation outlooks.
Drought Outlook
Here is the newly issued Drought Outlook for the month.
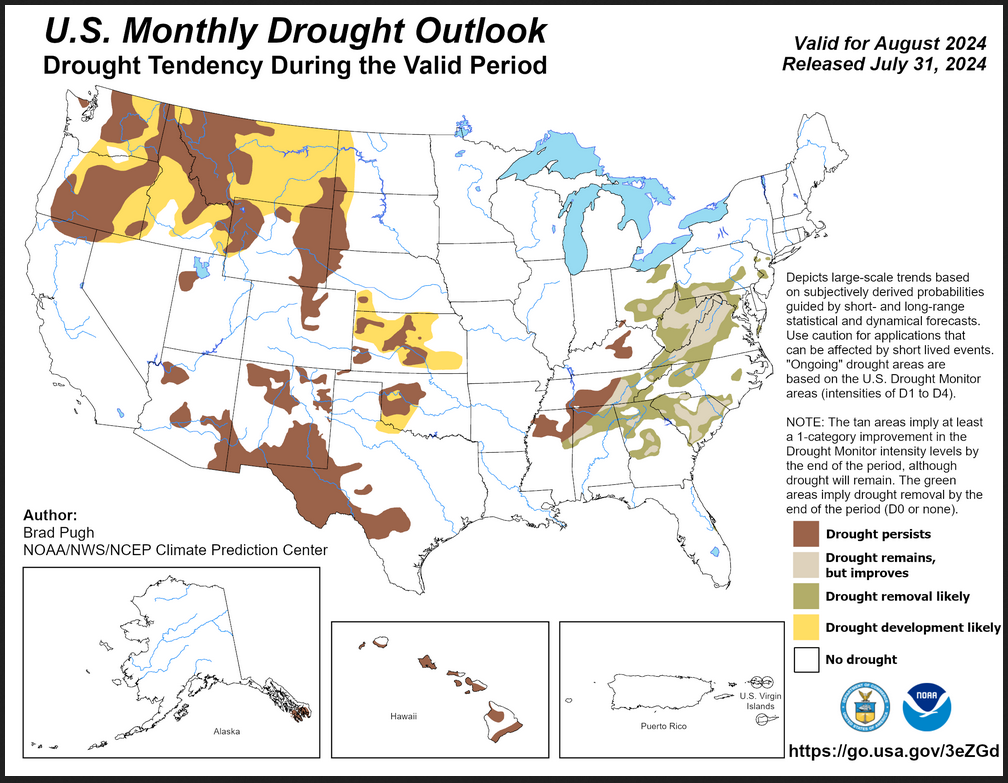
| You can see where drought development or persistence is likely. The summary and detailed discussions that accompany this graphic can be accessed HERE, but the short version is shown below. |
Here is the short version of the drought summary
Latest Monthly Assessment – According to the U.S. Drought Monitor from June 25 to July 23, drought coverage increased from 16.13 to 19.97 percent across the contiguous U.S. During that four week time period, the rapid onset and intensification of drought was focused across the Central to Southern Applachians and Tennessee Valley. Widespread heavy rainfall resulted in improving drought conditions for much of the Carolinas, Georgia, and Alabama during the latter half of July. The improvement and removal forecast across the eastern U.S. is based on: a wet start to August and the updated August precipitation outlook which favors above-normal precipitation near and to the east of the Appalachians. Forecast confidence in widespread improving conditions is lowest across West Virginia, northern to central Virginia, and western Maryland where drought impacts may linger. Persistence is more likely across parts of Kentucky, Tennessee, and northern Mississippi where precipitation amounts are predicted to be lower through mid-August.
Drought is expected to expand across the Great Plains early in August, but model guidance remains consistent that a cooler, wetter pattern becomes established by mid-month. Persistence is forecast for the ongoing drought areas of the Great Plains, while development is most likely for areas of rapidly drying topsoil such as northwestern Texas, southwestern to central Oklahoma, parts of Kansas, the western Dakotas, and Montana. Consistent with the updated August precipitation and temperature outlooks, persistence and development are forecast for the northern Rockies, Intermountain West, and Pacific Northwest. Broad-scale persistence is forecast for the long-term drought areas of the Southwest. Persistence is also forecast for southeastern Alaska and Hawaii, while Puerto Rico and the U.S. Virgin Islands are likely to remain drought-free
We also have an updated Seasonal Drought Outlook (link).
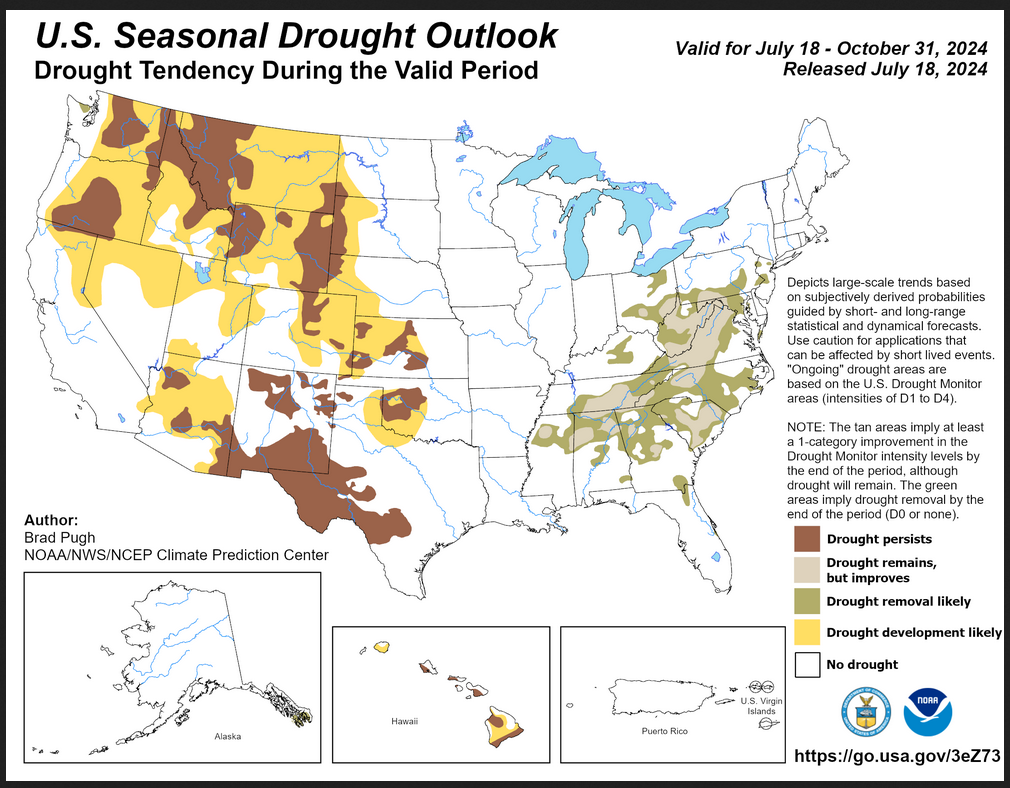
| This three-month outlook forecasts more drought than the single-month outlook and it covers a longer period of time. It shows both areas of drought development and drought persistence as well as drought improvement in the Eastern U.S. |
| To update this forecast (which updates on Tuesdays), click HERE |
It is useful to review the prior month.
Month-to-date Temperature as the current month evolves can be found at https://hprcc.unl.edu/products/maps/acis/MonthTDeptUS.png
Month-to-date Precipitation as the current month evolves can be found at https://hprcc.unl.edu/products/maps/acis/MonthPNormUS.png
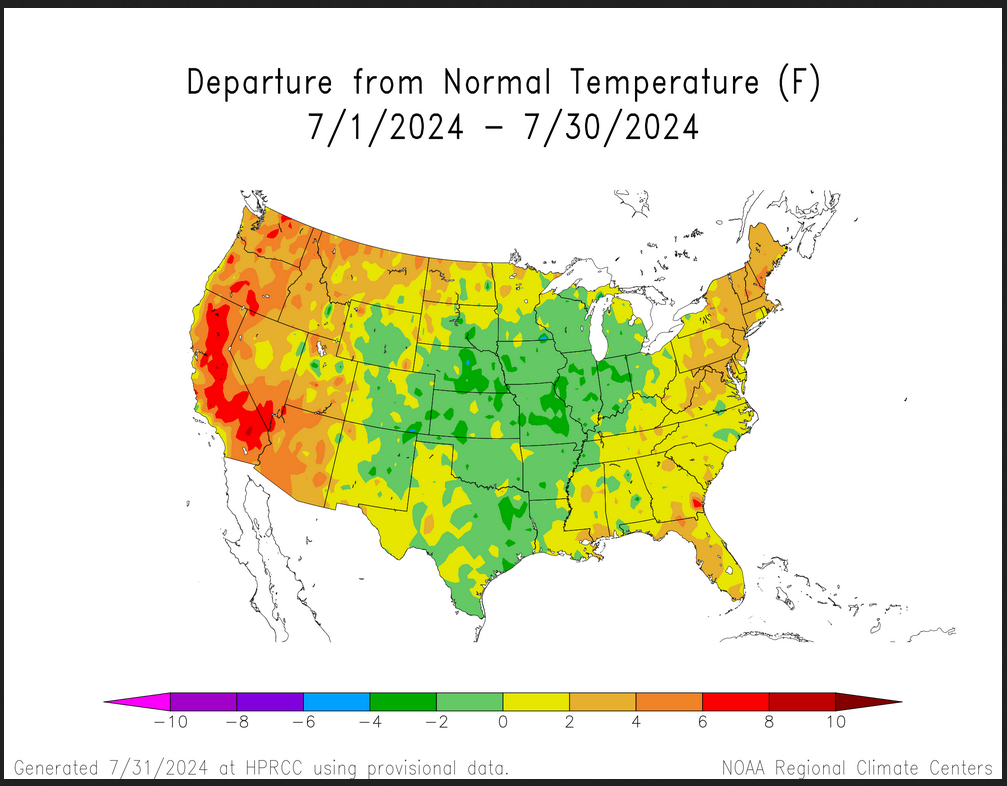
| You see an interesting pattern of warm, cool, warm with respect to normal July. |
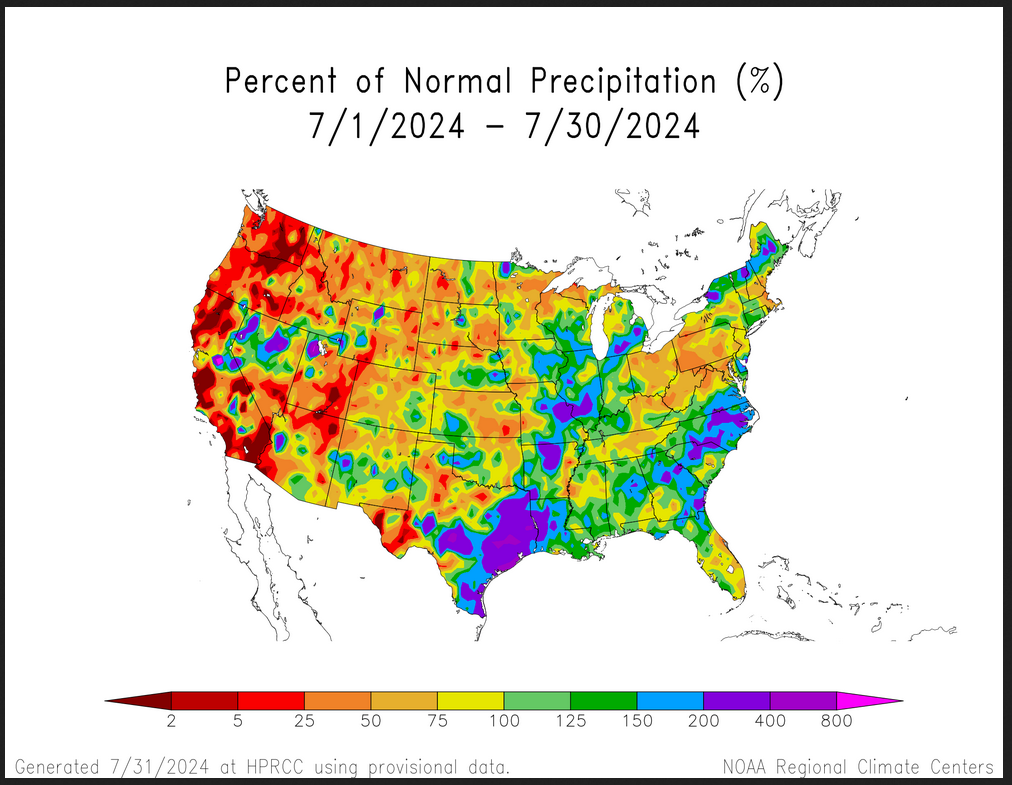
| You see both large areas of less than normal precipitation and more than normal precipitation. It is somewhat related to the July temperature pattern. |
Fire Outlook (The Site has Moved and I have not figured out how to fully use the new site yet. The link is HERE.
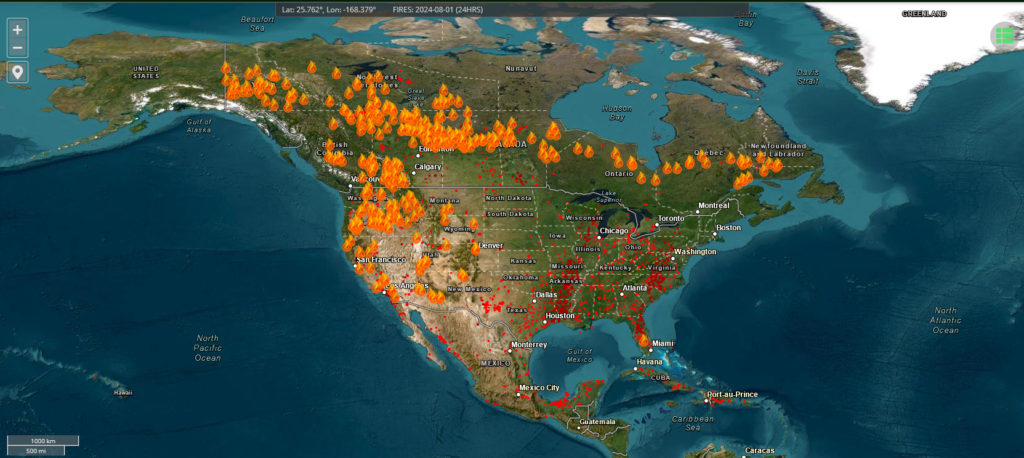
| But they for sure have good-looking maps. I will try to provide more information on the use of this website in the future. |
| I hope you found this article interesting and useful |