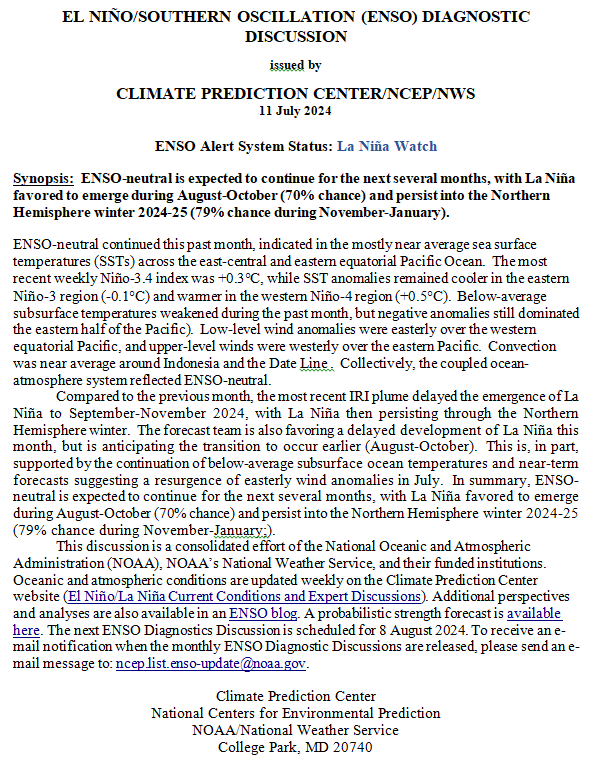
“Synopsis: ENSO-neutral is expected to continue for the next several months, with La Niña favored to emerge during August-October (70% chance) and persist into the Northern Hemisphere winter 2024-25 (79% chance during November-January).”
So we are really in ENSO Neutral but NOAA may not want to admit their forecast was wrong so they present it this way. It is correct that we are in La Nina Watch but it is also correct that we currently remain in ENSO Neutral..
On the second Thursday of every month, NOAA (really their Climate Prediction Center CPC) issues its analysis of the status of ENSO. This includes determining the Alert System Status. NOAA now describes their conclusion as “ENSO Alert System Status: La Nino Watch”
The exact timing of the transition is now less clear which should decrease the reliability of the Seasonal Outlook to be issued next Thursday.
We have included an ENSO Blog article by Emily Becker.
 >
>
CLIMATE PREDICTION CENTER ENSO DISCUSSION
| The second paragraph is what is important:
“Compared to the previous month, the most recent IRI plume delayed the emergence of La Niña to September-November 2024, with La Niña then persisting through the Northern Hemisphere winter. The forecast team is also favoring a delayed development of La Niña this month, but is anticipating the transition to occur earlier (August-October). This is, in part, supported by the continuation of below-average subsurface ocean temperatures and near-term forecasts suggesting a resurgence of easterly wind anomalies in July. In summary, ENSO-neutral is expected to continue for the next several months, with La Niña favored to emerge during August-October (70% chance) and persist into the Northern Hemisphere winter 2024-25 (79% chance during November-January).” Below is the middle paragraph from the discussion last month. “The most recent IRI plume indicates La Niña may develop during July-September 2024 and then persist through the Northern Hemisphere winter. The forecast team is also favoring the development of La Niña during July-September because the rate of cooling has slowed since last month. The team still favors La Niña to emerge sometime during the summer months, given the persistent below-average subsurface ocean temperatures and changes in the tropical atmospheric circulation. In summary, ENSO-neutral conditions are present. La Niña is favored to develop during July-September (65% chance) and persist into the Northern Hemisphere winter 2024-25 (85% chance during November-January; “ |
We now provide additional details.
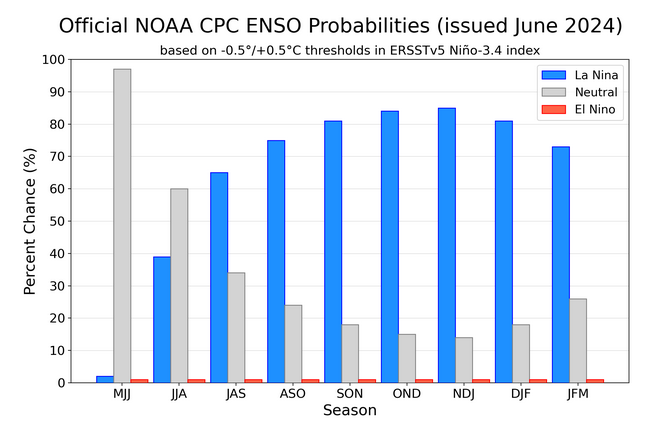
CPC Probability Distribution
Here are the new forecast probabilities. The probabilities are for three-month periods e.g. JJA stands for June/July/August.

Here is the current release of the probabilities:
| This chart shows the forecast progression of the evolution of ENSO from the current El Nino State to Neutral and by the summer to La Nina. This kind of bar chart is not very good at showing uncertainty. |
Here is the forecast from last month.
| The analysis this month and last month are a bit different with again the transition to La Nina being slower than thought last month. This seems to be a trend. I am not sure that we will actually have a La Nina. |
Some will need to click on “Read More” to read the rest of this article.
What Does the NOAA Proprietary ENSO Model Forecast?
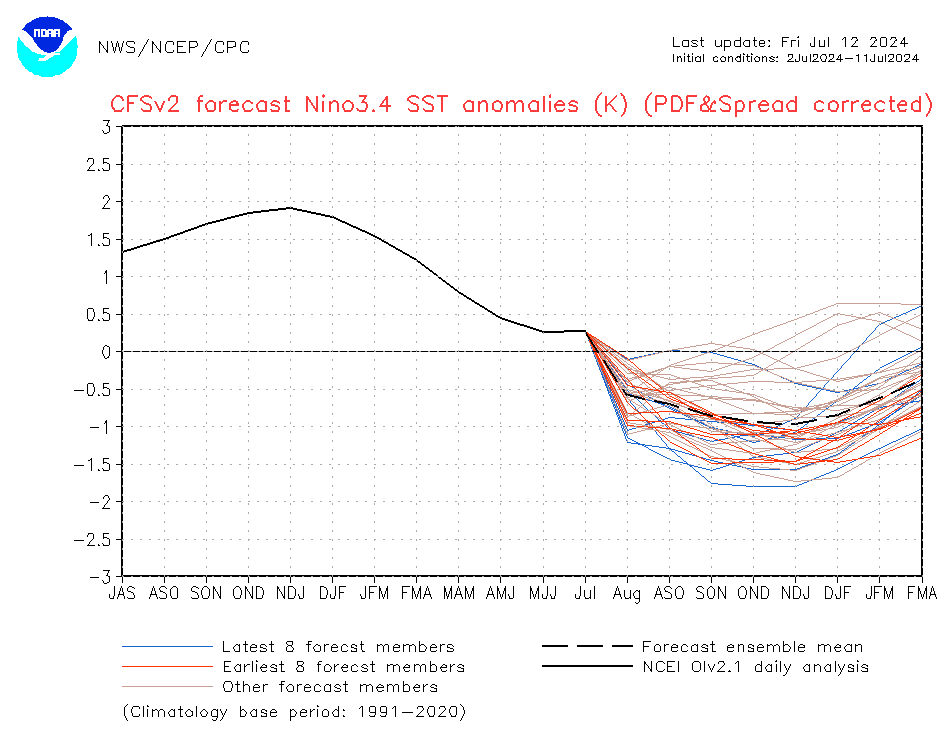
| Notice the wide spread of the solutions. If you want to see an updated version you can view an updated version by clicking HERE. This is not the official CPC forecast but a secondary tool that they use. It shows a fairly modest La Nina coming. |
View of other Models.
I have the JAMSTEC forecasts.
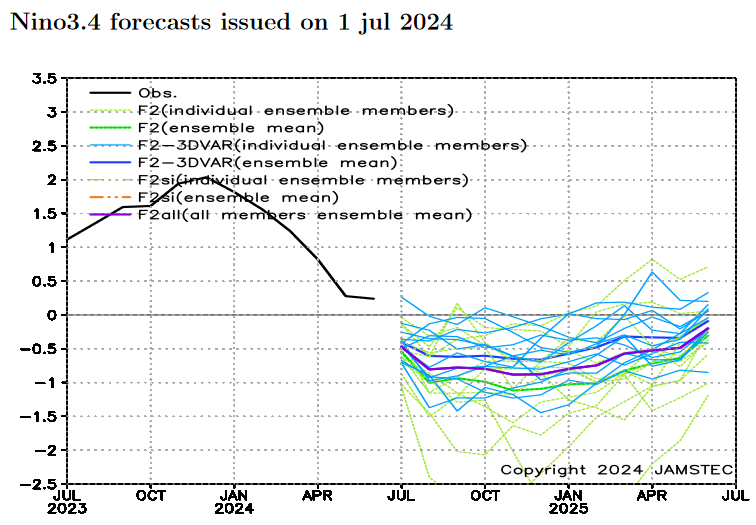
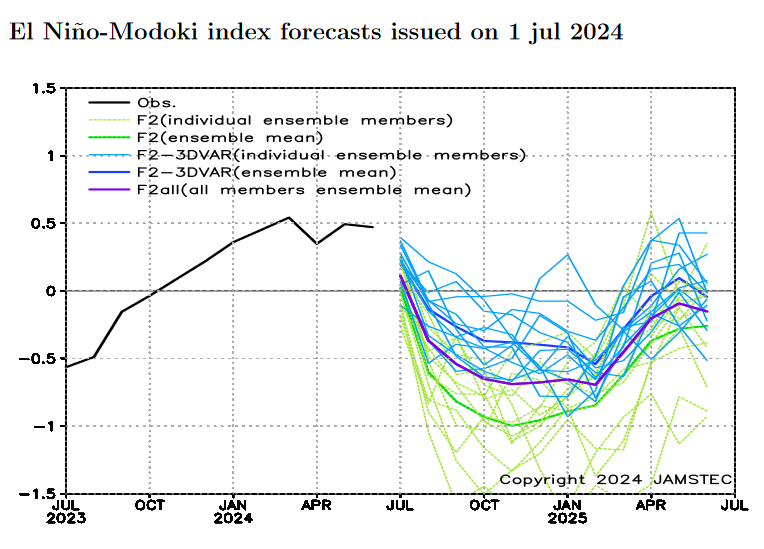
| Both the traditional Nino 3.4 and the Japanese-developed Modoki Index are similar and forecast a fairly weak La Nina. |
Looking at Actual Current Conditions.
NOAA reports some derived data that describes the current situation and a forecast. But what if we want to form our own opinion? After all, meteorologists are looking at the actual current situation and making predictions.
This shows the current actual situation for the surface of oceans. To update this graphic click HERE.
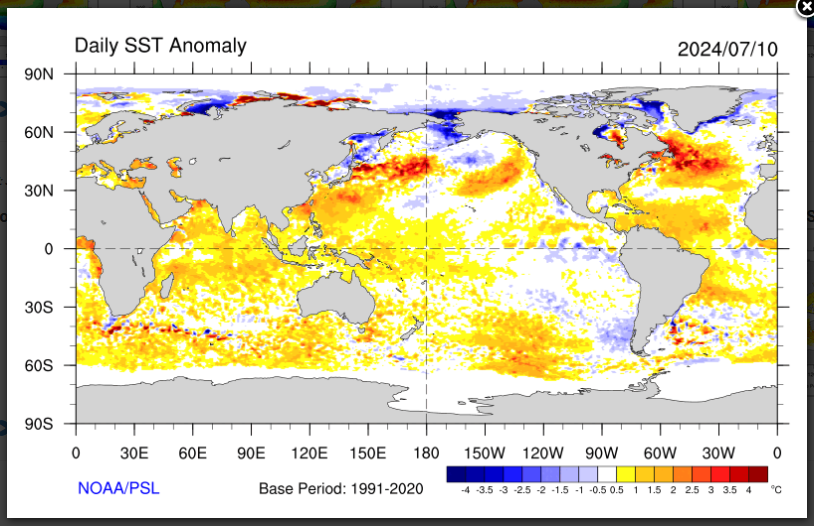
| You can no longer see the warm tongue of water extending from Ecuador and Peru. It has been replaced by a cold tongue but it is not consistent. We are discussing ENSO tonight but you can see a lot of interesting things here. It is only a one-day snapshot so keep that in mind. There is not much warm water along any coast of the United States. The situation for South America and the Western Caribbean is different and facilitates a robust hurricane season. |
Putting the historical information in motion. Updates can be found HERE. but should not be needed.

Now we look at the below surface temperature anomalies. Mapping the details. (Cross-Section along the Equator). The data is a five-day average centered on the date shown.
Here is the new map followed by the prior two months to show the progression. The undercutting of the warm water by the cooler water is clear but when does it reach the surface?
![]()

![]()
| I am not sure that this La Nina is developing the way the CPC claims that it is. I would not be shocked if it did not develop at all. |
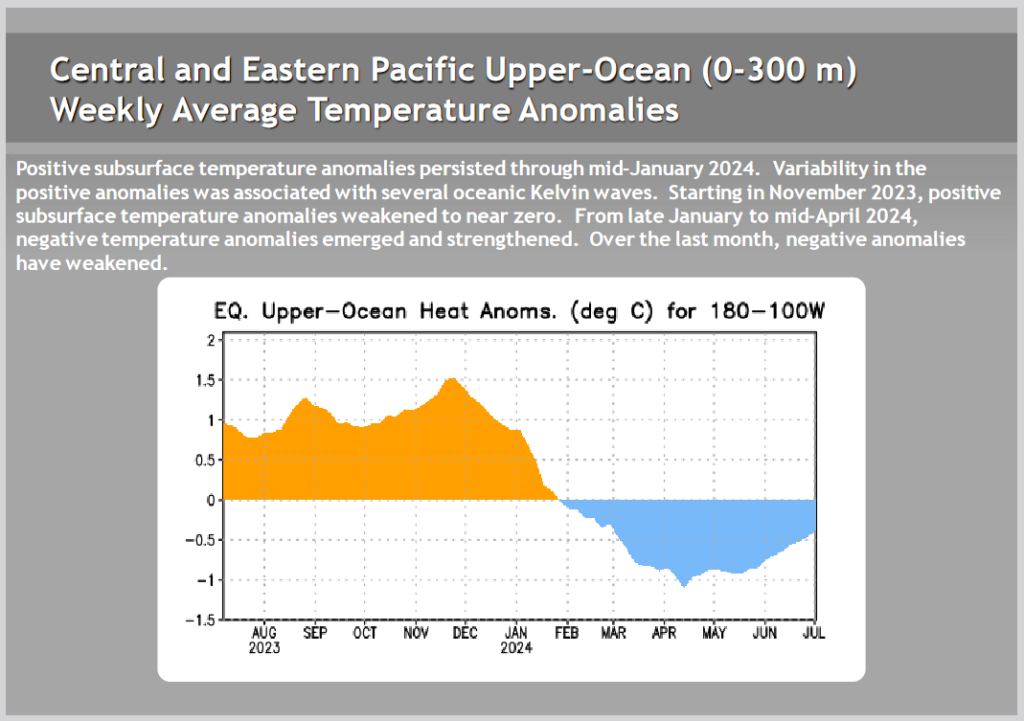
| This shows the water column anomaly is now negative i.e. the warmer water near the surface is dominated by the cooler water below. But the forecast is not for this La Nina to get very intense. In fact, the cold water anomaly column is becoming less intense. |
Kelvin Waves
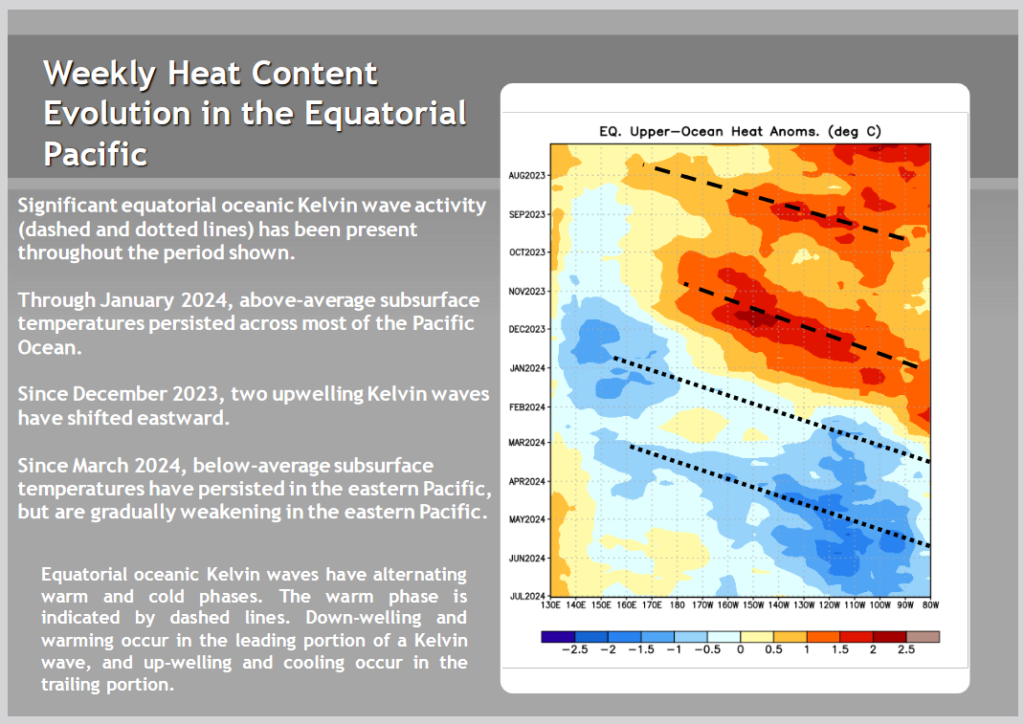
Are they now predicting a downwelling Kelvin Wave? More skepticism on my part related to the Outlook. |
Is the response of the atmosphere sufficient to sustain an El Nino? This made me want to take a look at the SOI Index, HERE is the U.S. version. HERE is the link to the Australia Bureau of Meteorology version of that graph. I prefer the BOM version but there could be an argument that the U.S. version is more accurate but I am not convinced of that.
With respect to the BOM version,
“The Southern Oscillation Index, or SOI, gives an indication of the development and intensity of El Niño or La Niña events in the Pacific Ocean. The SOI is calculated using the pressure differences between Tahiti and Darwin.
Sustained negative values of the SOI below −7 often indicate El Niño episodes. These negative values are usually accompanied by sustained warming of the central and eastern tropical Pacific Ocean, a decrease in the strength of the Pacific Trade Winds, and a reduction in winter and spring rainfall over much of eastern Australia and the Top End. You can read more about historical El Niño events and their effect on Australia in the Detailed analysis of past El Niño events.
Sustainted positive values of the SOI above +7 are typical of a La Niña episode. They are associated with stronger Pacific trade winds and warmer sea temperatures to the north of Australia. Waters in the central and eastern tropical Pacific Ocean become cooler during this time. Together these give an increased probability that eastern and northern Australia will be wetter than normal. You can read more about historical La Niña events and their effect on Australia in the Detailed analysis of past La Niña events.”
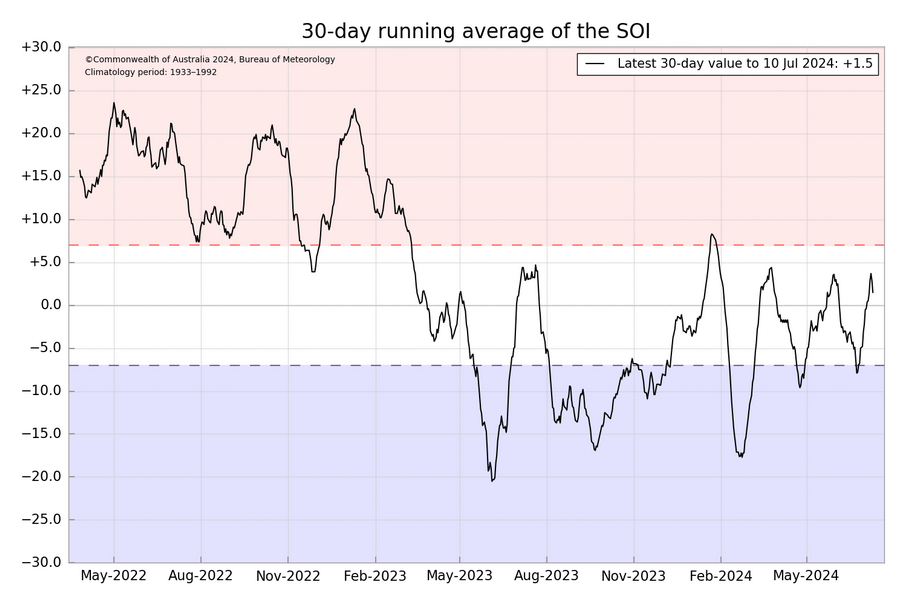
| The SOI is now solidly in ENSO Neutral territory. This is covered in the CPC discussion. |
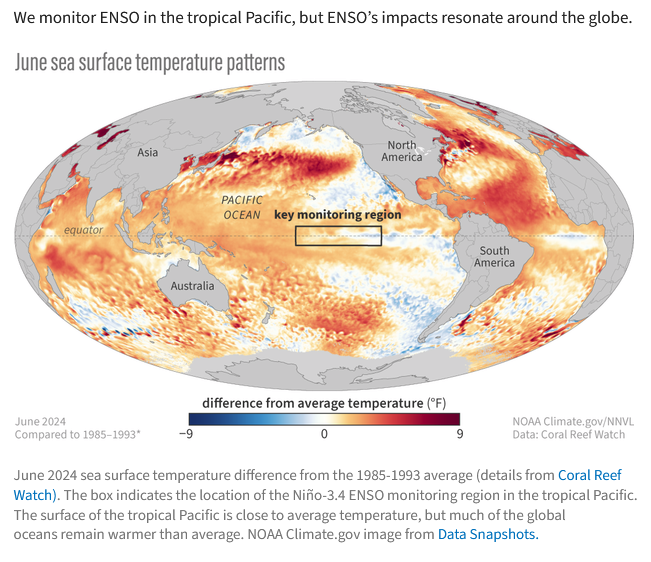
Now we present the recent ENSO Blog Post by Emily Becker. I am showing two of the graphics from her blog post. You can read the full Emily Becker Post HERE.
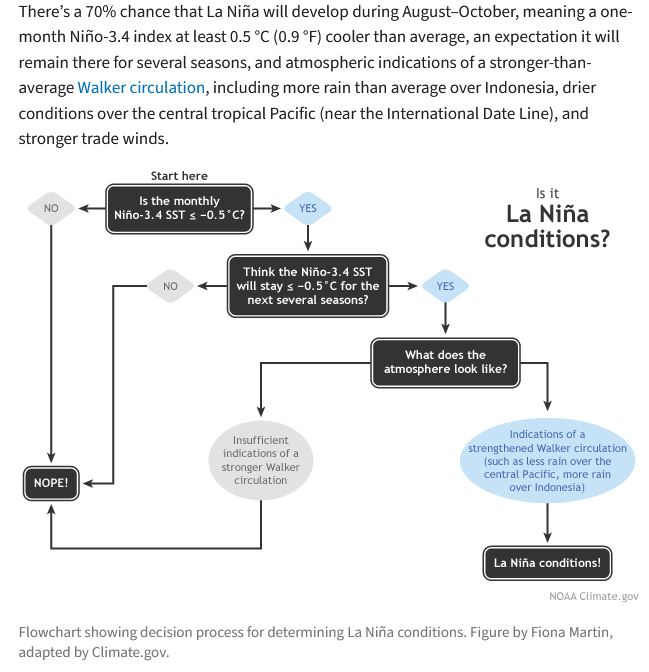
The below is lo0king ahead to when we will be in La Nina and shows how the decision flowchart will then confirm that we are indeed in ENSO La Nina.
| I hope you found this article interesting and useful. |
thanks for all the info. Its amazing and overwhelming.
It will be curious to see what the next months predictions/actual weather does.
Me too.