At the end of every month, NOAA updates its Outlook for the following month which in this case is July of 2024. We are reporting on that tonight.
There have been some significant changes in the Outlook for July and these are addressed in the NOAA Discussion so it is well worth reading. We provided the prior Mid-Month Outlook for July for comparison. It is easy to see the substantial changes in the weather outlook by comparing the Mid-Month and Updated Maps.
The article includes the Drought Outlook for July. NOAA also adjusted the previously issued Seasonal (JAS) Drought Outlook to reflect the changes in the July Drought Outlook. We also provide the Week 2/3 Tropical Outlook for the World.
The best way to understand the updated outlook for July is to view the maps and read the NOAA discussion. I have highlighted the key statements in the NOAA Discussion.
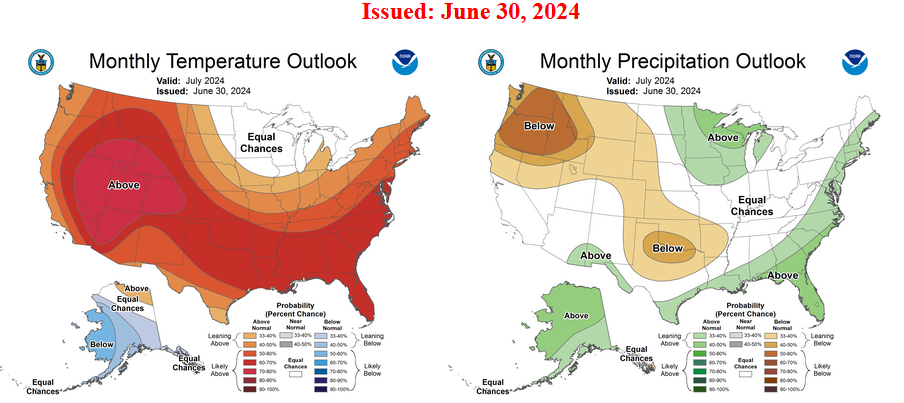
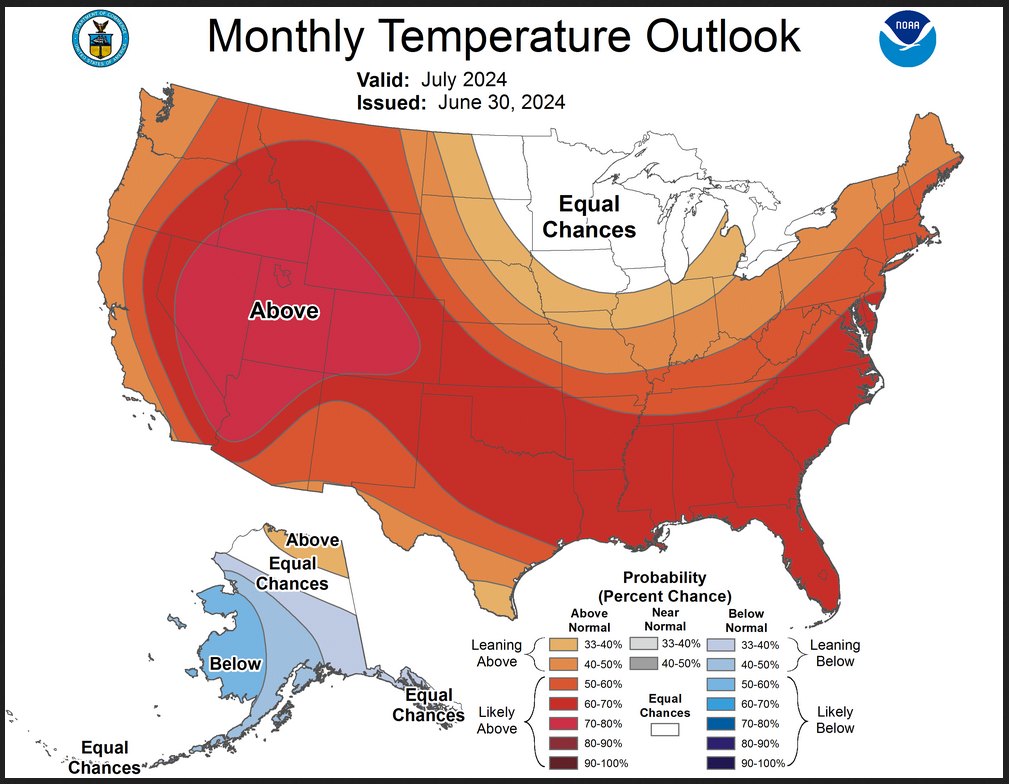
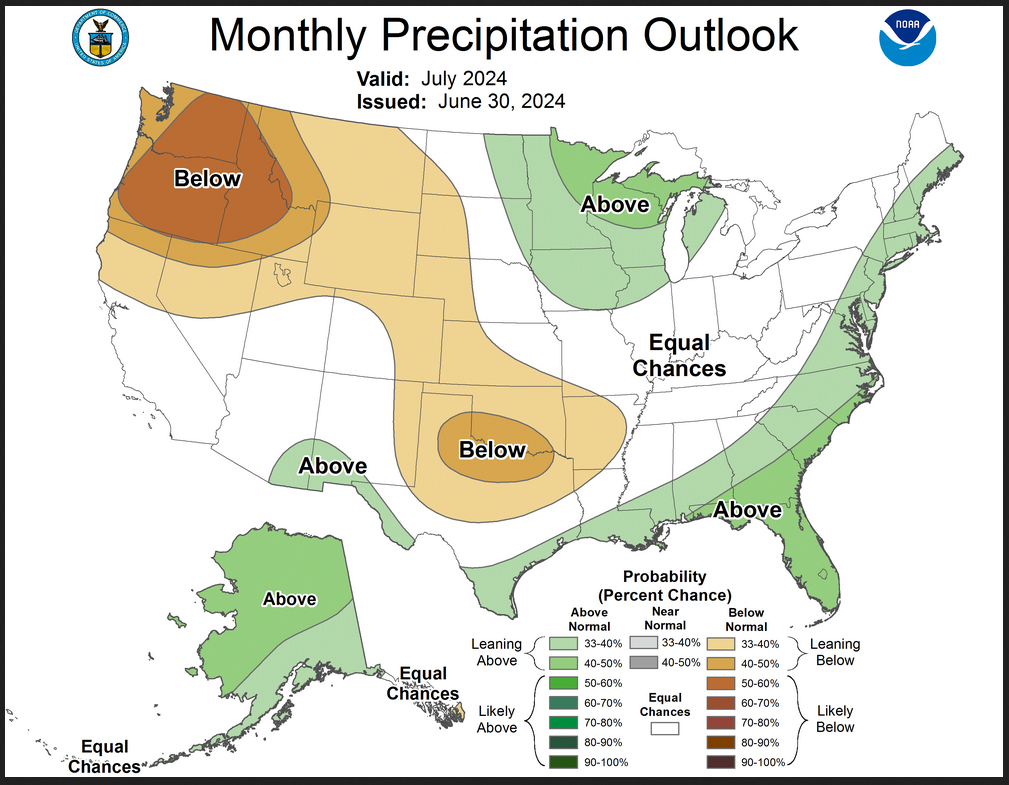
Here is the updated Outlook for July 2024.
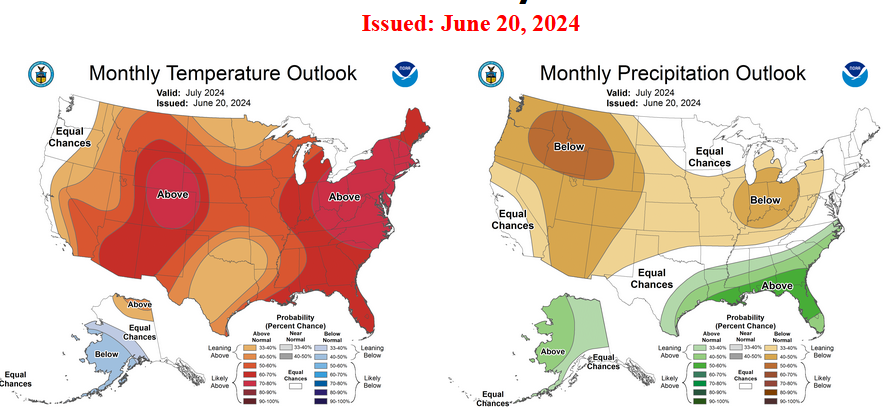
For Comparison Purposes, Here is the earlier Mid-Month Outlook for July.
| It is important to remember that the maps show deviations from the current definition of normal which is the period 1991 through 2020. So this is not a forecast of the absolute value of temperature or precipitation but the change from what is defined as normal or to use the technical term climatology.
It is a substantial change from what was issued on June 20, 2024. Remember, it is the first set of maps that are the current outlook for July. One expects some changes 10 days later. However, the changes to the updated July Outlook are significant. This then gives us some reason to question the (June 20, 2024) three-month JAS temperature and precipitation Outlooks which are shown in the following graphic. |
NOAA provided a combination of the Updated Outlook for July and the Three-Month Outlook.
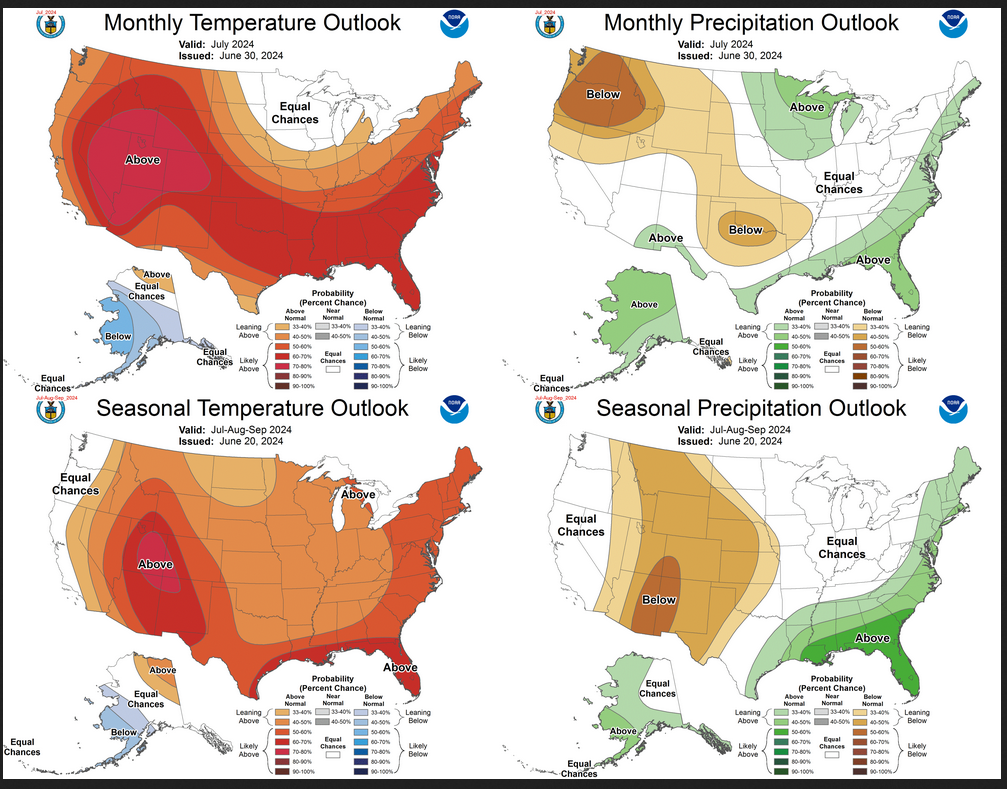
The top pair of maps are again the Updated Outlook for the new month. There is a temperature map and a precipitation map. The bottom row shows the three-month outlooks which includes July the new month. I think the outlook maps are self-explanatory.
To the extent that one can rely on a forecast, we would conclude that August and September will be very different than July, especially for precipitation. You can subtract July from the three-month Outlook and divide by two to get a combined August-September Outlook.However given the major change in the new July outlook from what was issued on June 20, 2024, we might not trust the Seasonal Outlook issued on June 20, 2024. Something to think about. |
Some readers may need to click “Read More” to read the rest of the article. Some will feel that they have enough information. But there is a lot more information in the rest of this article.
| Our regular Daily Weather article can be found HERE. In addition to the short-term forecast it also provides the 6 – 10 day, 8 – 14 day, and Week 3 – 4 Outlooks. That is not a full month but close to it. So it is helpful if one wants to understand how the full-month forecast is expected to vary through the month. And the maps in the Daily Article update throughout the month. |
Here are larger versions of the July Temperature and Precipitation Outlook maps.
NOAA (Really the National Weather Service Climate Prediction Division CPC) Discussion. I have shown certain important points in bold type. My comments if any are in brackets [ ].
30-DAY OUTLOOK DISCUSSION FOR JULY 2024
The updated July 2024 temperature and precipitation outlooks for the contiguous U.S. (CONUS) and Alaska (AK) take into account the most recently observed physical drivers and the latest initializations from the ensemble suites of the dynamical models (ECMWF, GEFSv12, GEM, CFSv2, and JMA).
Neither El Niño Southern Oscillation (ENSO) nor the Madden-Julian Oscillation (MJO) are expected to have a meaningful impact on the eventual temperature and precipitation outcome over CONUS and AK. Niño3.4 anomalies indicate ENSO neutral conditions, although 200-hPa velocity potential anomalies are beginning to resemble a La Niña background state with enhanced divergence over the Maritime Continent and convergence farther east. The MJO is currently weak, with any remaining signal indicating the convectively active phase over the Indian Ocean. Some ensemble suites of the dynamical models forecast a strengthening MJO propagating to the Maritime Continent. However, convection in this region would also be consistent with an emerging La Niña. Regardless, the Northern Hemisphere extratropical teleconnections to anomalous tropical convection are weak during July.
In the extratropics, sea surface temperature (SST) and soil moisture anomalies remain largely unchanged from the original outlook. Namely, below normal coastal SSTs are still observed along the western coast of Alaska and the West Coast, particularly near California. Above normal coastal SSTs are found along the Gulf Coast and East Coast. Soil moisture anomalies are strongly positive in the Upper Mississippi Valley. They are negative from the Central Plains to the Mid-Atlantic. Soils are becoming increasingly dry across southern OK and northern Texas. Despite heavy rains earlier in June, the recent ~3 weeks have been very dry along the Red River Valley.
Significant updates to the temperature and precipitation outlooks for July are largely related to short term model output for Week 1, which typically has high forecast skill. The overall 500-hPa height pattern during Week 1 features very strong ridging developing along the West Coast, transient troughing in the Northern Plains, and downstream ridging over the East Coast. This pattern differs from model initializations last week, which failed to predict the ridge along the West Coast and the depth of the trough in the Northern Plains. Over AK, ridging is expected over the southern half of the state and troughing is anticipated along the North Slope. This pattern leads to a moist onshore flow from the Bering Strait. As the month of July progresses into Weeks 2, 3, and 4, the troughing in the Northern Plains is forecast to diminish; the ridge along the West Coast is expected to move more inland, becoming more centered over the Northern Rockies; and the pattern over Alaska looks to persist.
Temperature
The updated temperature outlook reflects the ridge axis predominantly residing over western CONUS with the highest probabilities for above normal temperatures reaching 70 to 80% over the Great Basin, Southwest, and Intermountain West. In fact, temperatures over California during Week 1 are forecast to be excessively hot, which has necessitated the removal of any equal chances (EC) of above-, near-, or below-normal temperatures along the California coast. The much above normal temperatures are forecast to build northward into the Pacific Northwest as Week 1 progresses, which has also led to the removal of EC in that region. Some relief may occur along the immediate West Coast via sea breeze mechanisms. Entering Week 2, the ridge axis is forecast to move more inland which would push temperatures to above normal values in the Northern Rockies, after a near-normal or slightly-below normal start to the month due to transient troughing in the neighboring Northern Plains. It should also be noted that long-term temperature trends are positive in western CONUS during July, and the temperature outlook reflects that reality. In the Northern Plains and upper Great Lakes, EC is forecast in this updated outlook due to some near- to below-normal temperatures advecting in from the north during Week 1 along with above normal soil moisture anomalies. Most models, including the ECMWF, expect the transient troughing to abate during Week 2, although the GEFS shows some lingering colder than normal temperatures. Farther south and east into the Southern Plains, Texas, Southeast, Ohio Valley, Mid-Atlantic, and New England elevated odds of above normal temperatures are supported by warm air advection downstream of the anticipated troughing in the Northern Plains, long-term trends during July, and strong model agreement.
Precipitation
The updated precipitation outlook features a few notable changes. A decent moisture plume during the first week of July is anticipated to produce relatively widespread thunderstorm activity in the Desert Southwest. While this activity lessens during Week 2, there is some indication of it re-emerging as the month unfolds. This tilts the odds from below normal in the original outlook toward a broad region of EC with a small embedded region of above-normal near the southern borders of New Mexico and Arizona. Farther north in the Pacific Northwest and Northern Rockies, below normal precipitation is still expected with strong ridging over the region. However, some monsoon moisture cannot be ruled out, so probabilities for below-normal precipitation were broadly lowered. Above normal precipitation is now favored over the Upper Mississippi Valley due to heavy rain anticipated during Week 1 as a result of the transient troughing. Below normal precipitation is favored along the Red River Valley of Oklahoma and Texas, as most models agree the region will remain dry with below normal soil moisture anomalies and no apparent moisture advection into the region. A thin sliver of above normal precipitation is forecast along the Gulf Coast, Florida, and East Coast. Models are mixed in this region, but ultimately the long term trend and potential tropical activity tilt the odds to above normal. With respect to tropical activity, it should be noted that the eventual track of Hurricane Beryl in addition to disturbances in the Gulf of Mexico and Main Development Region of the Atlantic all lead to uncertainty in the current precipitation outlook. Finally, for Alaska, onshore flow from the Bering Strait is typically a wet and cool pattern during July. Thus, nearly all of the state is favored to have below normal temperatures with the exception of the eastern portion of the North Slope due to long-term trends . Above normal precipitation is also expected over the entire state with the exception of the Panhandle where the influence of the ridge along the West Coast results in EC being forecast.
Drought Outlook
Here is the newly issued Drought Outlook for the month.
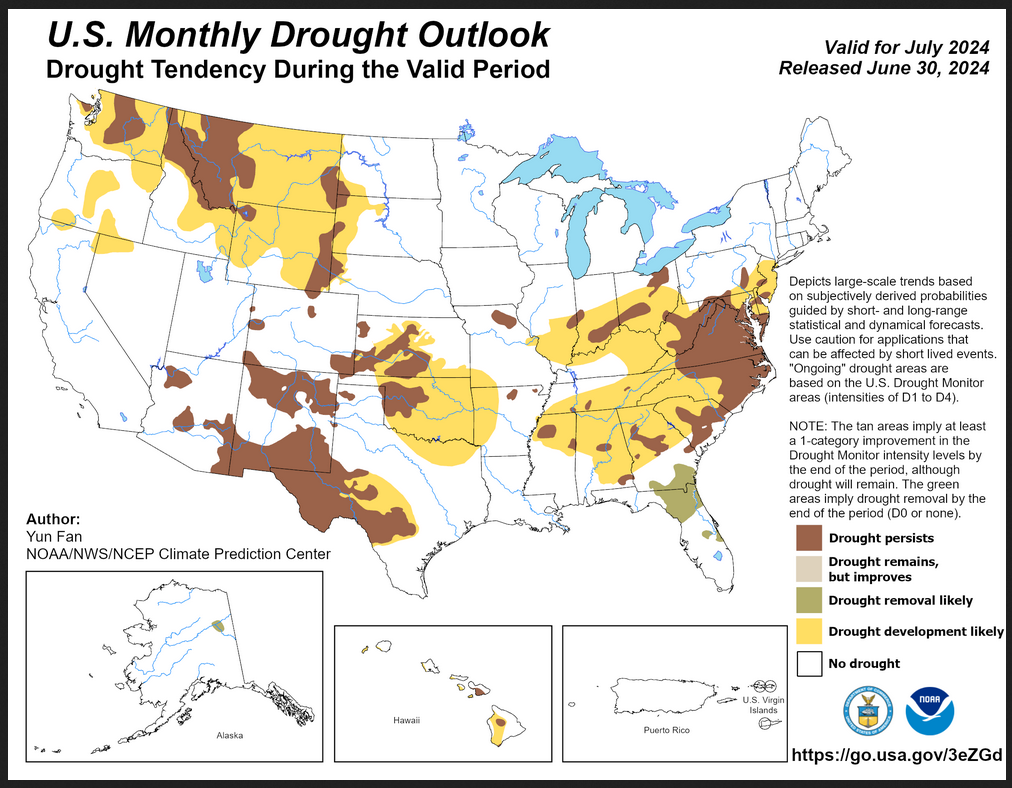
| You can see where drought development or persistence is likely. The summary and detailed discussions that accompany this graphic can be accessed HERE, but the short version is shown below. |
Here is the short version of the drought summary
Latest Monthly Assessment – During the past month, beneficial rainfall was observed across the Great Plains and brought 1-3 class drought improvement or removal over the region. Moderate to severe (1-2 class) drought developed rapidly in late May and early June over parts of the central-southern Florida Peninsula and then much of the drought was wiped out by extreme heavy rainfall recently. Sporadic drought improvement was seen over portions of the Pacific Northwest, Northern Rockies and Four Corners due to beneficial rainfall received. However, much of the eastern CONUS did miss out on meaningful precipitation coupled with anomalous heat recently, especially across portions of the Mid-Atlantic, coastal Carolinas, southern Georgia and northern Florida where anomalous dryness and moderate to severe drought developed rapidly. For much of Montana and Wyoming, and portions of the Southern Plains, where precipitation deficits have continued to mount and excessive heat has exacerbated the dryness across the regions in recent weeks.
Looking forward to July 2024, persistence, resulting in intensification, is favored for the existing drought regions across the western contiguous U.S. (CONUS), due to warmer and drier than normal conditions predicted across much of those regions. Those predictions also favor the potential for drought conditions to develop over anomalous dry areas across portions of the interior Pacific Northwest eastward to Northern Plains. Persistence is also forecast for the existing drought over portions of the Central and Southern Plains with coincident development favored in parts of the Central and Southern Plains, supported by antecedent dryness, warmer and drier than normal conditions forecast throughout much of July. Persistence is predicted for the existing drought across much of the eastern CONUS with potential development favored across the portions of the Ohio and Tennessee Valleys and Southern Appalachians due to lack of wet signals in forecast coupled with warmer than normal conditions, except for the Florida Peninsula where drought removal is favored due to forecast above normal precipitation for the July and favorable time of year for soil moisture recharge. In east-central mainland Alaska, a small moderate drought developed recently in the and is likely to be removed by the end of July due to forecast favorable wet signals. Puerto Rico and the U.S. Virgin Islands are forecast to remain drought-free by the end of July 2024. In Hawaii, persistence is favored for the existing drought, with the potential for drought development in some areas currently experiencing abnormal dryness (D0 as depicted in the U.S. Drought Monitor).
We also have an updated Seasonal Drought Outlook (link).
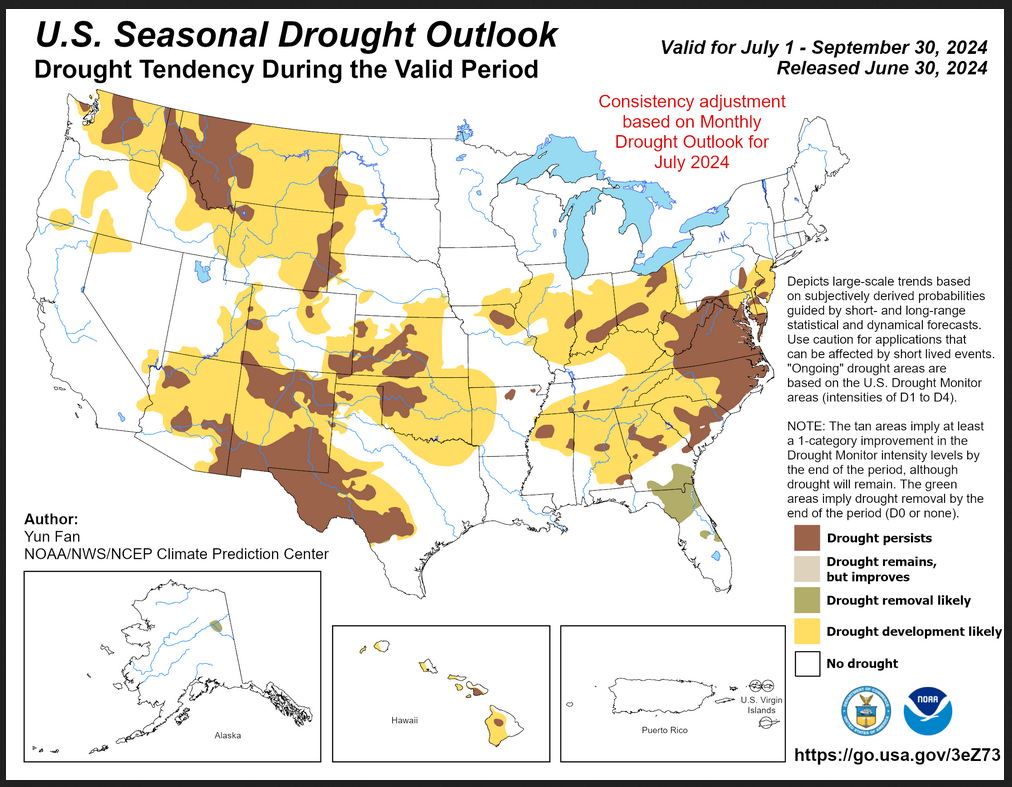
| This three-month outlook forecasts more drought than the single-month outlook and it covers a longer period of time. It shows both areas of drought development and drought persistence. |
| To update this forecast (which updates on Tuesdays), click HERE |
Month-to-date Temperature as the current month evolves can be found at https://hprcc.unl.edu/products/maps/acis/MonthTDeptUS.png
Month-to-date Precipitation as the current month evolves can be found at https://hprcc.unl.edu/products/maps/acis/MonthPNormUS.png
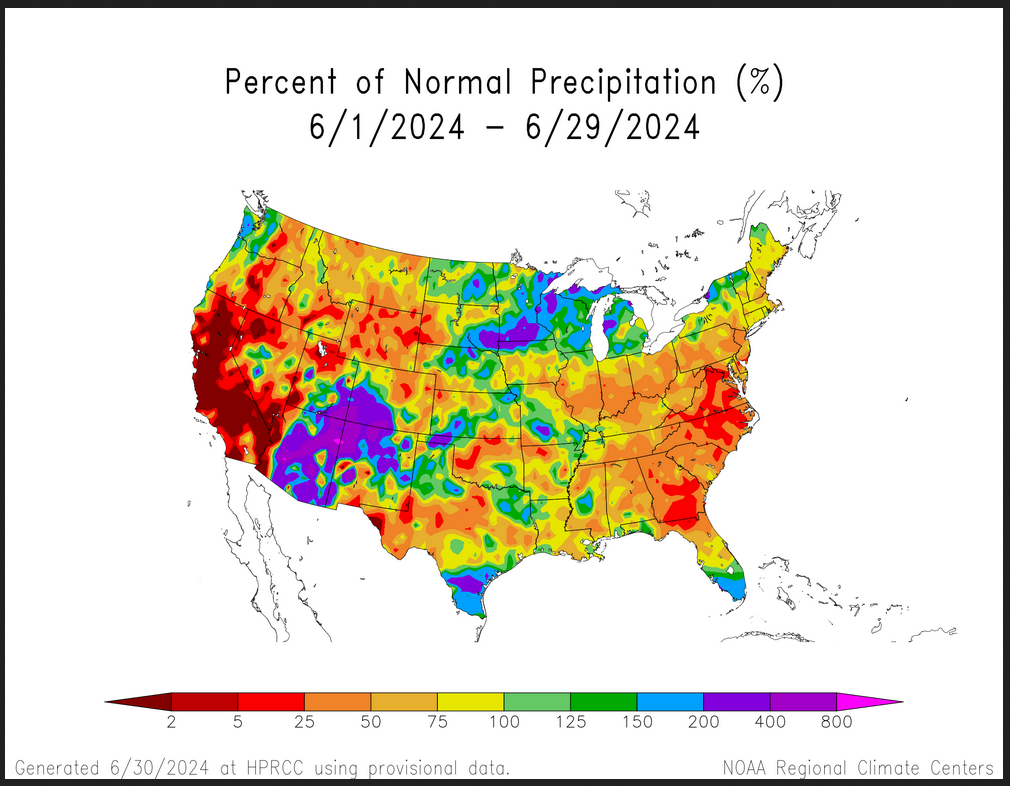
| You see both large areas of less than normal precipitation and more than normal precipitation. |
Fire Outlook (The Site has Moved and I have not figured out how to print images from the new site yet. The link is HERE.
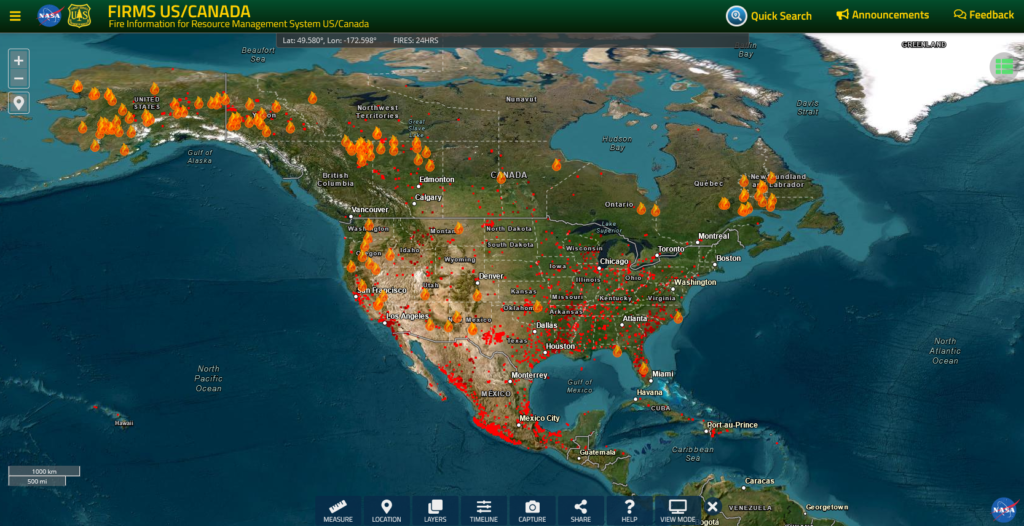
| But they for sure have good-looking maps. |
| I hope you found this article interesting and useful |