At the end of every month, NOAA updates its Outlook for the following month which in this case is June of 2024. We are reporting on that tonight.
There have been some significant changes in the Outlook for June and these are addressed in the NOAA Discussion so it is well worth reading. We provided the prior Mid-Month Outlook for June for comparison. It is easy to see the changes by comparing the Mid-Month and Updated Maps.
The article includes the Drought Outlook for June. NOAA also adjusted the previously issued Seasonal (JJA) Drought Outlook to reflect the changes in the June Drought Outlook. We have included a map showing the water-year-to-date precipitation in the Western States. We also provide the Week 2/3 Tropical Outlook for the World. We also include a very interesting ENSO Blog Post.
The best way to understand the updated outlook for June is to view the maps and read the NOAA discussion. I have highlighted the key statements in the NOAA Discussion.
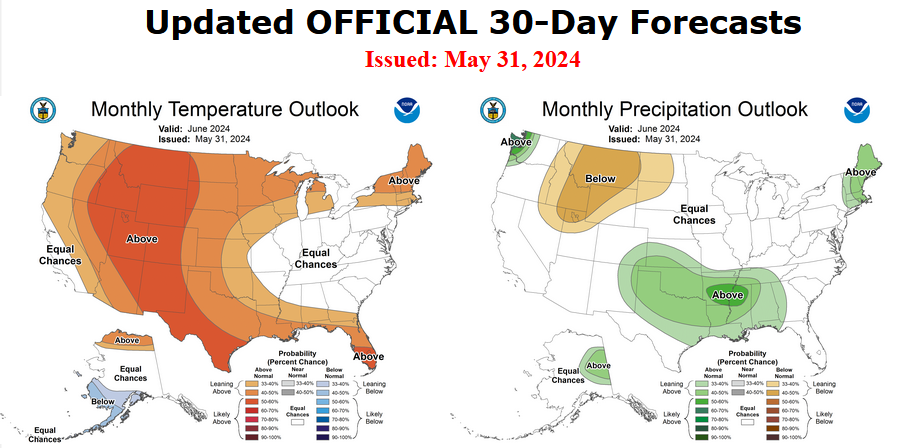
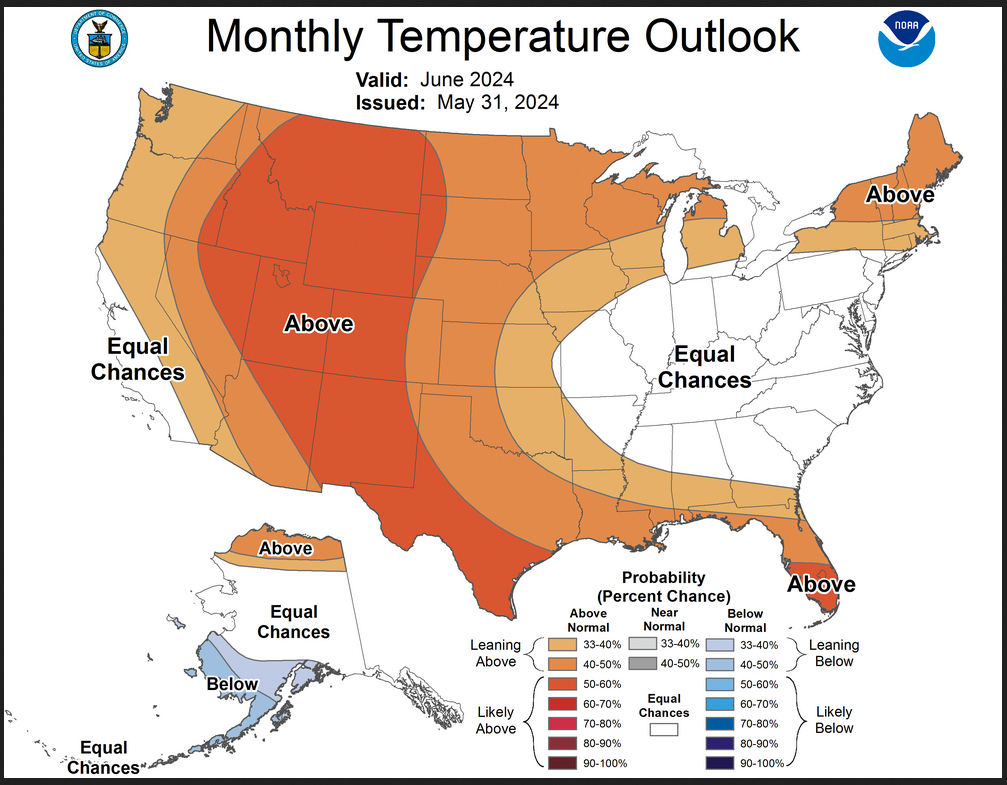
Here is the updated Outlook for June 2024.
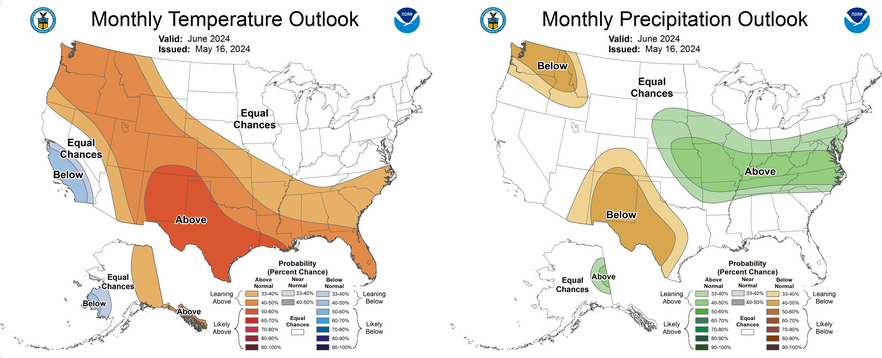
For Comparison Purposes, Here is the earlier Mid-Month Outlook for June.
| It is important to remember that the maps show deviations from the current definition of normal which is the period 1991 through 2020. So this is not a forecast of the absolute value of temperature or precipitation but the change from what is defined as normal or to use the technical term climatology.
It is a substantial change from what was issued on May 16, 2024. Remember, it is the first set of maps that are the current outlook for June. One expects some changes 15 days later. However, the changes to the June Outlook are significant. This then gives us some reason to question the (May 16, 2024) three-month JJA temperature and precipitation Outlooks which are shown in the following graphic. |
NOAA provided a combination of the Updated Outlook for June and the Three-Month Outlook.
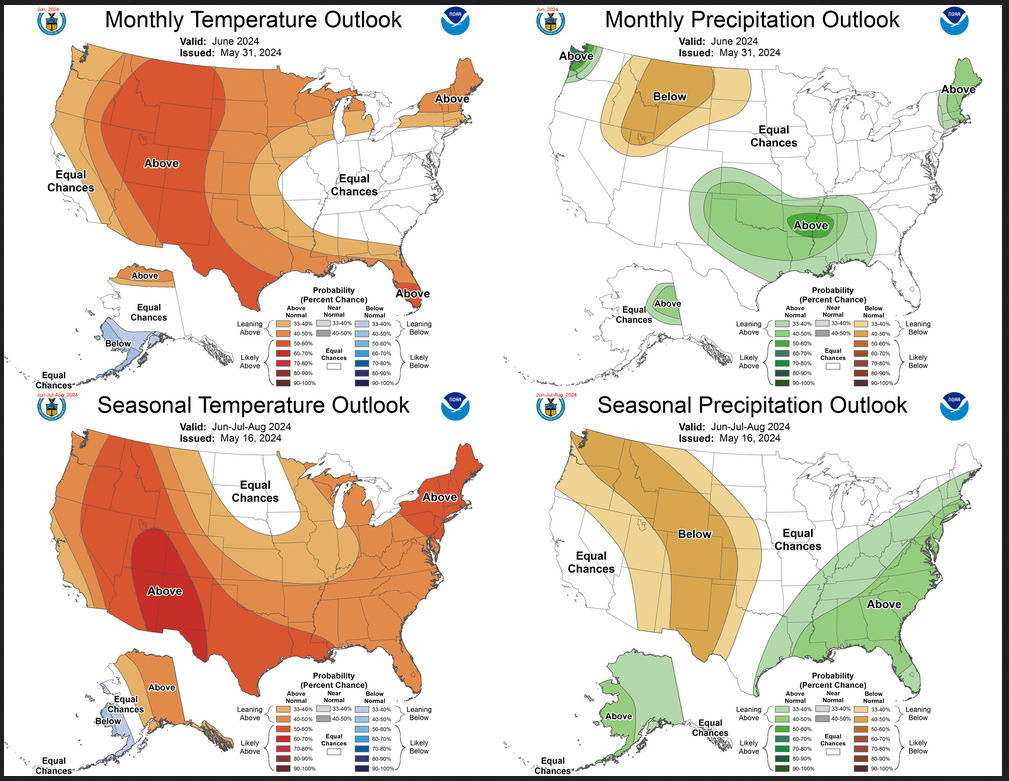
The top pair of maps are again the Updated Outlook for the new month. There is a temperature map and a precipitation map. The bottom row shows the three-month outlooks which include the new month. I think the outlook maps are self-explanatory.
To the extent that one can rely on a forecast, we would conclude that July and August will be very different than June, especially for temperature. You can basically subtract June, the three-month Outlook and divide by two to get a combined July-August Outlook.However given the major change in the new June outlook from what was issued on May 16, 2024, we might not trust the Seasonal Outlook issued on May 16, 2024. Something to think about. |
Some readers may need to click “Read More” to read the rest of the article. Some will feel that they have enough information. But there is a lot more information in the rest of this article.
| Our regular Daily Weather article can be found HERE. In addition to the short-term forecast it also provides the 6 – 10 day, 8 – 14 day, and Week 3 – 4 Outlooks. That is not a full month but close to it. So it is helpful if one wants to understand how the full-month forecast is expected to vary through the month. And the maps in the Daily Article update throughout the month. |
Here are larger versions of the June Temperature and Precipitation Outlook maps.
 <imgsrc=”https://econcurrents.com/wp-content/uploads/2024/06/N-June-2024-Precipitation-May-31.-2024.png”/>
NOAA (Really the National Weather Service Climate Prediction Division CPC) Discussion. I have shown certain important points in bold type. My comments if any are in brackets [ ].
30-DAY OUTLOOK DISCUSSION FOR JUNE 2024
The updated June temperature and precipitation outlooks primarily utilized model guidance across multiple forecast time scales that included short-, extended- and subseasonal-range information. The MJO remained disorganized and was not a substantial player in the June updated outlook. Coastal SSTs and land surface anomalies continued to be considered in preparation of the outlook.
Temperature
The updated June temperature outlook maintained much of the forecast from the middle of the month outlook. An extensive area of favored above-normal temperatures remains highlighted along the southern tier of the U.S., for the central and southern Plains, the Southwest, much of the Rockies and Pacific Northwest. Model guidance across time scales supports increasing probabilities of monthly mean temperatures for much of the western CONUS. Short- and subseasonal-range model guidance supports increasing forecast coverage for above-normal temperatures to include the northern Plains and portions of the Great Lakes and Northeast.
There will be periods of troughing over the first couple of weeks of June in the east-central U.S. most likely resulting in below-normal temperatures for areas in the Ohio Valley, Tennessee Valley and greater Midwest. Favored warmer than normal temperatures early in the month and after mid-month are forecast to offset this and along with a recent warmer than observed model bias across ensemble systems, Equal-Chances (EC) is depicted in the Ohio Valley, Tennessee Valley and mid-Atlantic due to the uncertainty in the final monthly mean June temperatures.
Given consistent model guidance for a heat wave to impact much of the western U.S. including California early in the month and generally warmer than normal conditions forecast across time scales, the favored below-normal temperatures along the California coast is removed. Even though coastal SSTs remain below-average, it is unlikely that below-normal monthly mean temperatures are realized in this region. Coastal SSTs and model guidance supports an area of favored below-normal temperatures for southwest Alaska and parts of the south coast. Moreover, model guidance across multiple time scales supports the adjustment of favored above-normal temperatures to now be situated over the entire North Slope in Alaska.
Precipitation
For precipitation, more changes are required than that for the updated June temperature outlook. Strong ridging across the west central U.S. forecast for much of the period favors below-normal monthly total precipitation to shift northward, as compared to the mid-month outlook, to the northern Rockies and northern High Plains. The favored ridge-trough forecast pattern over the CONUS from west to east for much of the first half of June supports a downstream mean frontal zone from the Southeast westward across the southern Plains to the south-central Rockies. This is further southward than described in the mid-month outlook discussion and so the above-normal precipitation area is shifted southwestward and extends from the Southeast westward to the south central Rockies.
High odds for above-normal precipitation is forecast for a small region in the far Pacific Northwest. High precipitation amounts during the first week of June will likely produce amounts already in the above-normal category given the point in the seasonal cycle – even with potential little additional precipitation during an increasing dry time of year. Forecast troughing in proximity to the Great Lakes favors unsettled conditions downstream and so elevated odds of above-normal precipitation is forecast for the Northeast. The forecast for Alaska is unchanged.
Drought Outlook
Here is the newly issued Drought Outlook for the month.
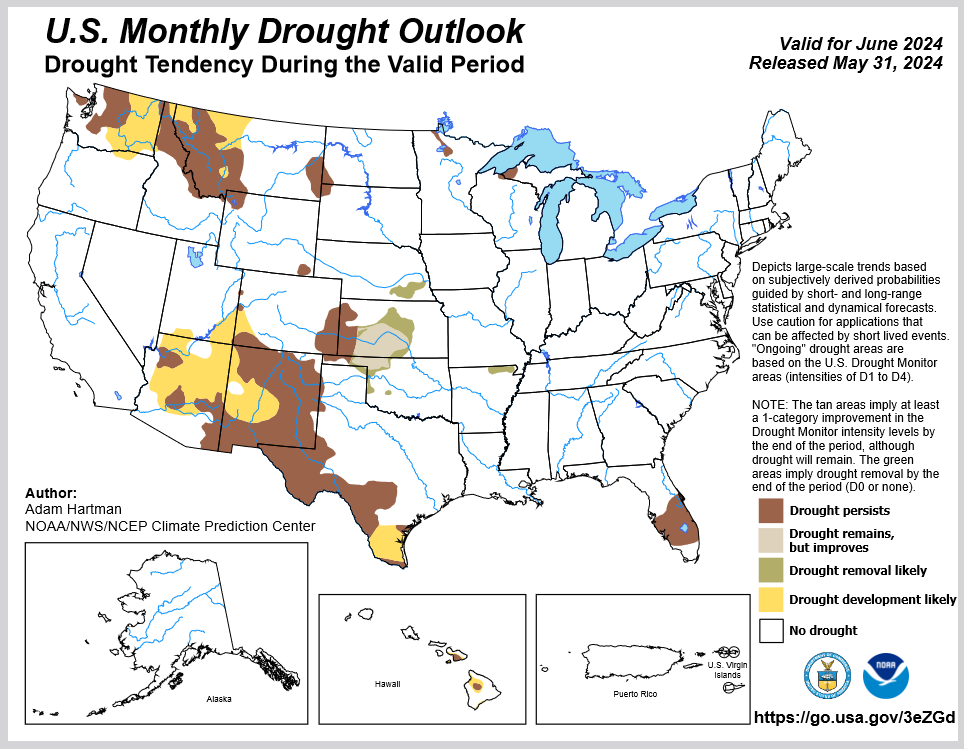
| You can see where drought development or reduction is likely. The summary and detailed discussions that accompany this graphic can be accessed HERE, but the short version is shown below. |
Here is the short version of the drought summary
Latest Monthly Assessment – Since the May 2024 Monthly Drought Outlook released on April 30, 2024, drought has continued to slowly improve across much of the U.S. The exceptions are across interior portions of the Intermountain West, the western Central Plains, southern Texas, and parts of the Florida Peninsula, where precipitation deficits have continued to mount and, in the case of southern Texas and Florida, excessive heat has exacerbated the dryness in recent weeks.
Looking forward to June 2024, drought persistence is favored across the western contiguous U.S. (CONUS), the western and eastern Gulf Coast, and the Upper Midwest. Warmer and drier than normal conditions are predominantly favored across the Intermountain West, favoring the potential for drought conditions to develop across portions of the interior Pacific Northwest, Northern Rockies, and the Four Corners region. Drought is also favored to develop in southern Texas, supported by antecedent dryness and warmer and drier than normal conditions forecast throughout much of June. Some offsetting signals across the north-central CONUS favor persistence of long-term drought conditions in localized portions of the Upper Midwest. Climatology and favorable precipitation outlooks favor improving drought conditions across the Central Plains and into the Middle Mississippi Valley. Uncertainty is greatest across the Upper Midwest and in the Florida Peninsula due to the risk of clustered thunderstorm and tropical activity, respectively, in addition to this being a wetter time of year climatologically for both areas. Alaska, Puerto Rico, and the U.S. Virgin Islands are forecast to remain drought-free by the end of June 2024. In Hawaii, drought persistence is favored, with the potential for drought development in areas currently experiencing abnormal dryness (D0 as depicted in the U.S. Drought Monitor).
We also have an updated Seasonal Drought Outlook (link).
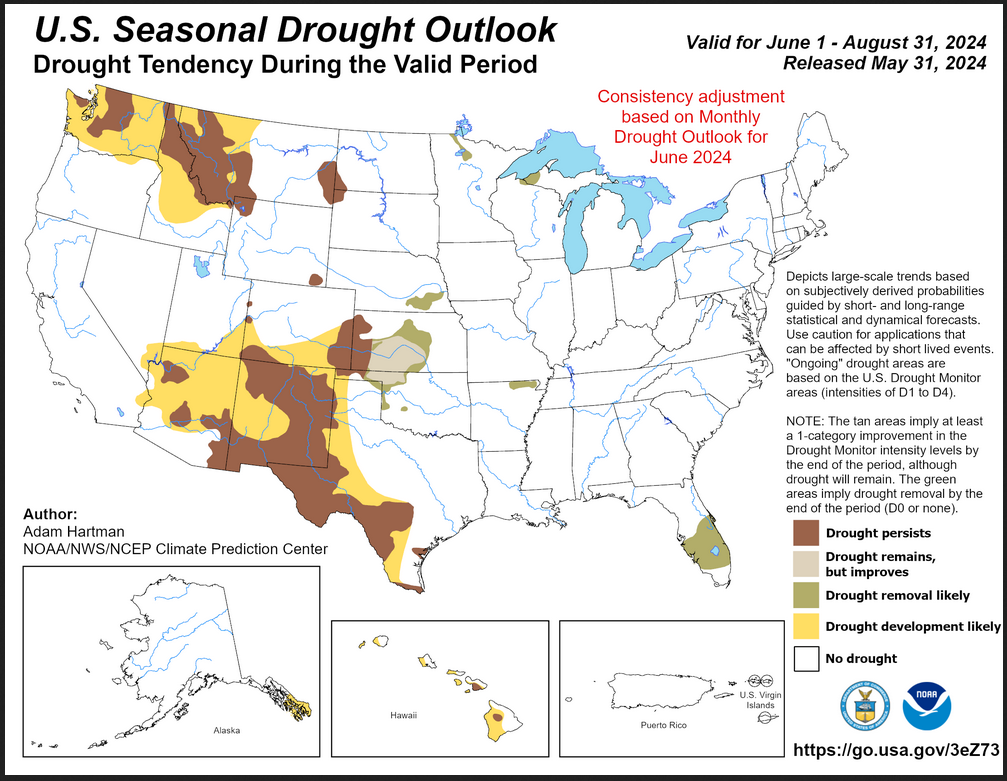
| This three-month outlook forecasts more drought than the single-month outlook and it covers a longer period of time. Unlike the one-month outlook. It shows both areas of drought reduction and development. |
| To update this forecast (which updates on Tuesdays), click HERE |
Month-to-date Temperature as the current month evolves can be found at https://hprcc.unl.edu/products/maps/acis/MonthTDeptUS.png
Month-to-date Precipitation as the current month evolves can be found at https://hprcc.unl.edu/products/maps/acis/MonthPNormUS.png
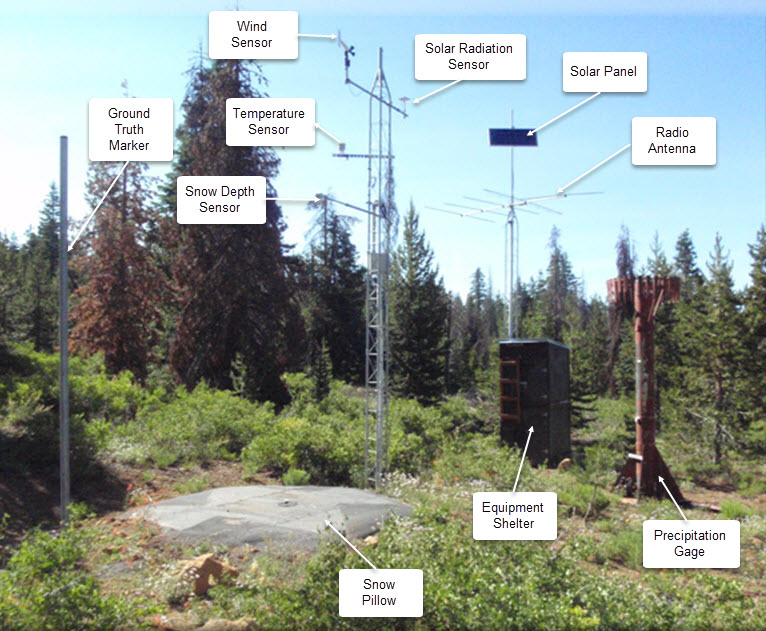
Current SWE (water contained in snow) is pretty much gone so I thought I would provide the water year-to-date precipitation. I will be reporting on the projected water supply soon probably in a separate article. For those who want continual updates, here is the LINK. You can select a variety of maps with the information provided by SNOTEL sites. Snow telemetry is mostly used in the West because in the winter most of the precipitation is in the form of snow and it is mostly in the mountains. That situation exists in Central and Eastern U.S. also but the ratio of precipitation in the mountains to precipitation at lower elevations is higher in the West. SNOTEL is useful but it has the problems that any system has which uses a small sample of measurement locations.

Image of a typical SNOTEL Site.
| This provides a very clear picture of the precipitation pattern since October 1, 2023. The pattern of where there is more precipitation than normal and where there is less than normal is pretty interesting. In Central and Eastern U.S. they mostly use a different method to keep track of precipitation. |
Fire Outlook (The Site has Moved and I have not figured out how to print images from the new site yet. The link is HERE.
| I hope you found this article interesting and useful |