Much of the information in this report comes from the monthly emails I receive from John Bateman. He does public outreach for NOAA and in particular NCEI. I could find the same information and more on the NCEI website but John Bateman produces a good summary so I use it or most of it. I also add additional information from NCEI or other NOAA websites. At the end of the article, I provide links that will get you to the full reports and much additional information.
Looking at the trend for April over time.
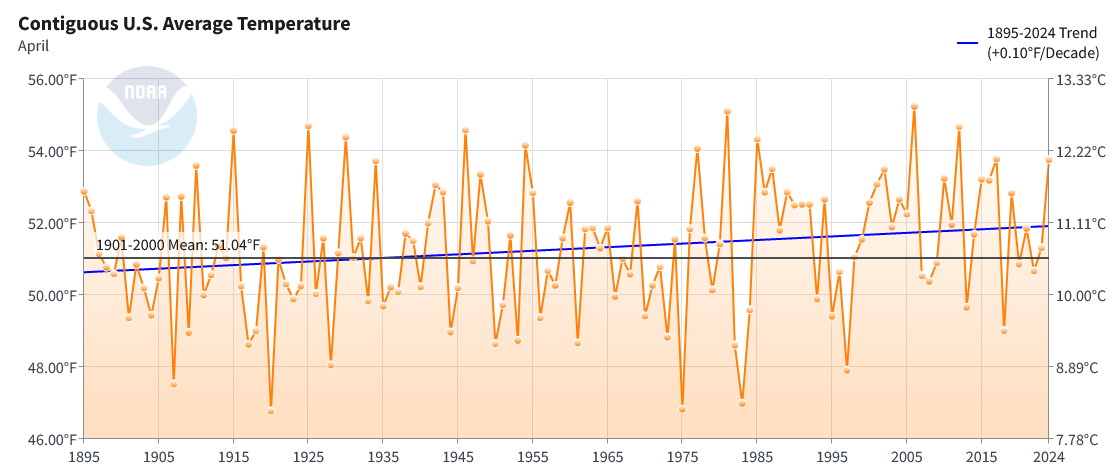
| This is the temperature trend for April in CONUS. |
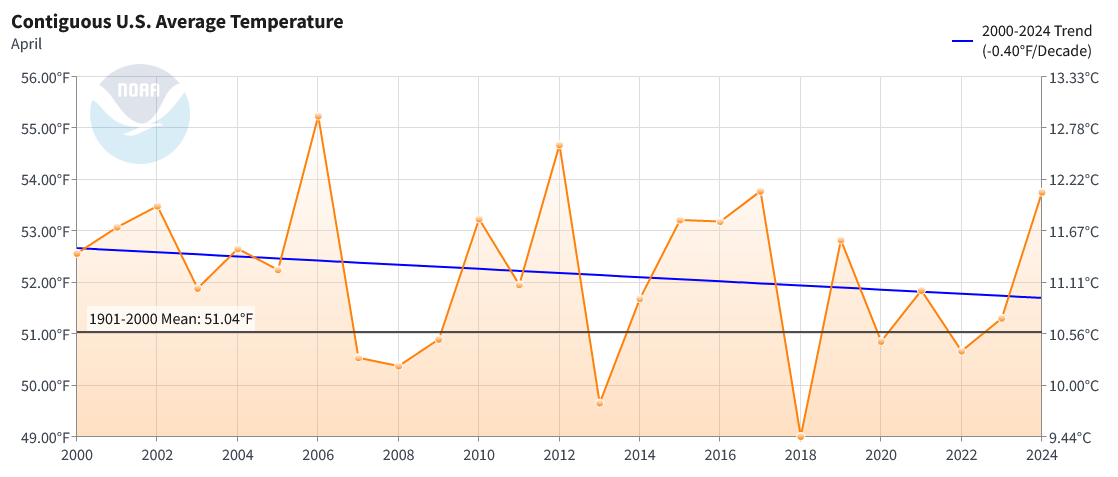
| But look at this the most recent 25 years. No increase but a decrease. Data can be misleading if you do not look at it carefully |
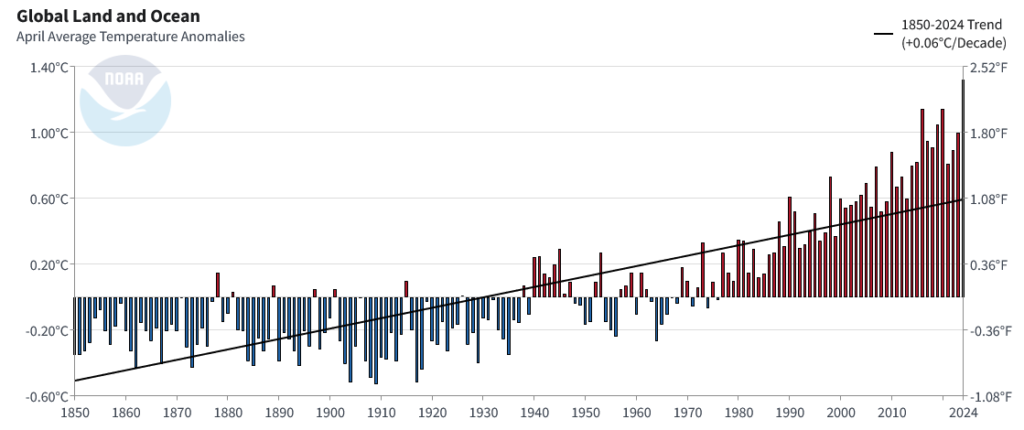
| The temperature for the world, land and water hit a new record. |
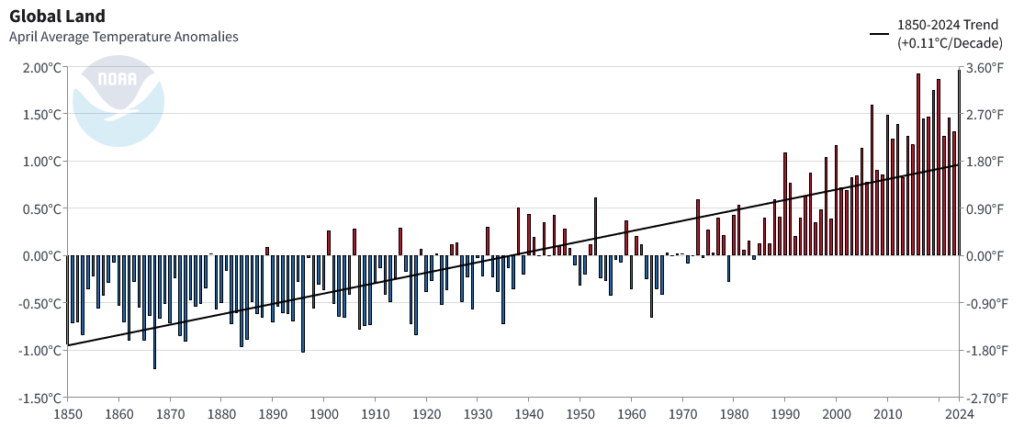
| The temperature for the world, land only also was a record. |
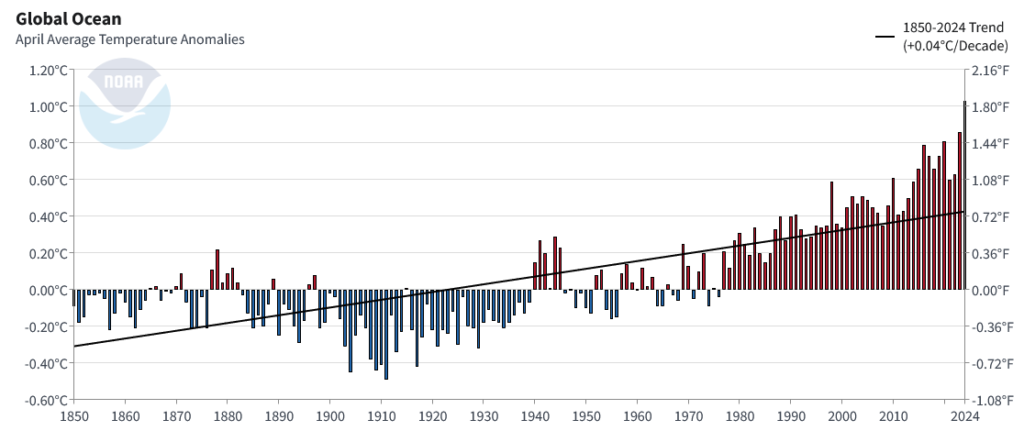
| The temperature for the world’s oceans also hit a record. Notice the slope is less. You can see the impact of ENSO in this graphic. |
To read the rest of this article some will have to click on “Read More”.
Other U.S. Highlights:
Temperature
The average temperature of the contiguous U.S. in April was 53.8°F, 2.7°F above average, ranking 12th warmest in the 130-year record. April temperatures were above average across much of the contiguous U.S., while near- to below-average temperatures were observed in parts of the West, northern Plains, Upper Midwest, Southeast and in small pockets of the Northeast. Virginia and West Virginia each had their fifth-warmest April on record.
The Alaska statewide April temperature was 27.2°F, 3.9°F above the long-term average, ranking in the warmest third of the 100-year period of record for the state. Above-average temperatures were observed across most of the state with near- to below-normal temperatures in parts of the Southwest and in parts of the Panhandle.

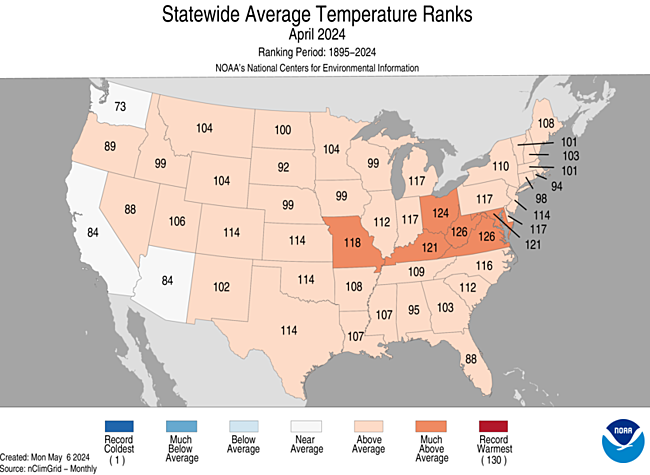
| Data can be looked at in different ways. Above there is the departure from average and note the period of time used for the average. Below there is my preferred approach the state rankings over the last 130 years. Both approaches and others are useful. No state made a record in April of 2024 but five were much above average. |
For January–April, the average contiguous U.S. temperature was 43.0°F, 3.8°F above average, ranking fifth warmest on record for this period. Temperatures were above average across nearly all of the contiguous U.S., while record-warm temperatures were observed in parts of the Northeast and Great Lakes. Wisconsin, Michigan, New York, Vermont, New Hampshire and Maine each ranked second warmest for the January–April period.
The Alaska January–April temperature was 13.9°F, 3.6°F above the long-term average, ranking in the warmest third of the historical record for the state. Much of the state was above normal for this four-month period while temperatures were near average across parts of the East, Southeast and parts of the Panhandle.
Precipitation
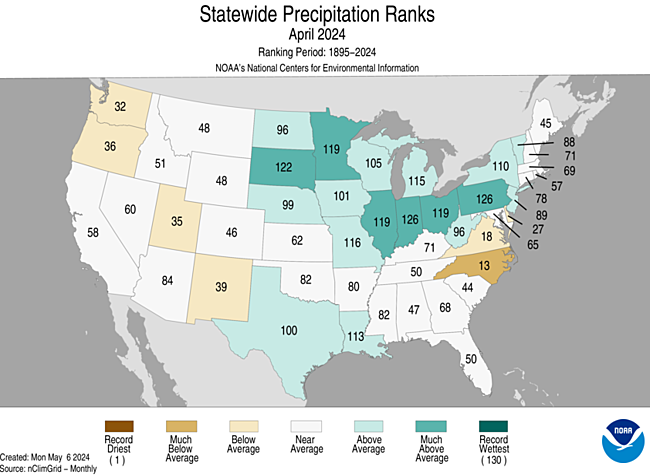
April precipitation for the contiguous U.S. was 2.77 inches, 0.25 inch above average, ranking in the wettest third of the historical record. Precipitation was below average across much of the West, Southeast, and parts of the central and southern Plains. Conversely, precipitation was above normal from portions of the Plains to the Northeast, and in parts of the Southwest. Indiana and Pennsylvania each had their fifth-wettest April on record.
Alaska’s average monthly precipitation ranked in the driest third of the historical record. Precipitation was above average in parts of the North Slope and West Coast, while below-normal precipitation was observed in parts of the Southeast Interior and Panhandle during the month.
The January–April precipitation total for the contiguous U.S. was 10.95 inches, 1.48 inches above average, ranking 11th wettest in the 130-year record. Precipitation was above average across much of the contiguous U.S., with Pennsylvania having its second-wettest year-to-date period on record. Conversely, precipitation was below average across parts of the Northern Tier and western and southern Plains, and in a small portion of the Southeast during the January–April period.
The January–April precipitation for Alaska ranked in the middle third of the 100-year record, with above-average precipitation observed across much of the state, while near-normal precipitation was observed in parts of the northeast Interior and al


ong parts of the Gulf of Alaska coast. Below-average precipitation were observed in portions of Interior and south-central Alaska and parts of the southern Panhandle during this period.
| Six much above-average states and one much below-average |
Billion-Dollar Disasters
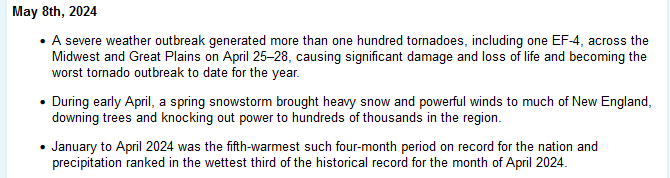
Five new billion-dollar weather and climate disasters were confirmed in April 2024, including three severe storm events that impacted the central, southern and eastern U.S. in mid-February and early April. There were also two winter storms that impacted the northwest and central U.S. in mid-January.
There have been seven confirmed weather and climate disaster events this year, each with losses exceeding $1 billion. These disasters consisted of five severe storm events and two winter storms.
The U.S. has sustained 383 separate weather and climate disasters since 1980 where overall damages/costs reached or exceeded $1 billion (including CPI adjustment to 2024). The total cost of these 383 events exceeds $2.720 trillion.
Other Notable Events
A spring storm brought rain, heavy snow, damaging winds and thunderstorms across much of the Great Lakes on April 2, knocking out power to over 100,000 people across the region during the height of the storm.
Severe weather across the Southeast produced a hailstorm that caused over $5 million in damages in Rock Hill, SC on April 20.
On April 26, severe weather across the central Plains resulted in the National Weather Service in Omaha, Nebraska issuing 48 tornado warnings—the most the office has ever issued in a single day.
Drought
According to the April 30 U.S. Drought Monitor report, about 17% of the contiguous U.S. was in drought, down about 1% from the beginning of April. Drought conditions expanded or intensified in much of the central and southern Plains, and parts of the Northwest and Southeast this month. Drought contracted or was reduced in intensity across much of the central Mississippi Valley and Upper Midwest, and in parts of the Southwest, northern Plains, Hawaii and Puerto Rico.
Monthly Outlook
Above-average temperatures are favored to impact areas from the southern Plains to the East Coast in May while above-average precipitation is likely to occur from much of the central Plains to the Mid-Atlantic and parts of the Upper Midwest. Drought is likely to persist along portions of the Northern Tier, the Southwest and Hawaii. Visit the Climate Prediction Center’s Official 30-Day Forecasts and U.S. Monthly Drought Outlook website for more details.
Significant wildland fire potential for May is above normal across the Hawaiian Islands and in portions of the Southwest and Florida Peninsula. For additional information on wildland fire potential, visit the National Interagency Fire Center’s One-Month Wildland Fire Outlook.
This monthly summary from NOAA’s National Centers for Environmental Information is part of the suite of climate services NOAA provides to government, business, academia and the public to support informed decision-making. For more detailed climate information, check out our comprehensive April 2024 U.S. Climate Report scheduled for release on May 13, 2024. For additional information on the statistics provided here, visit the Climate at a Glance and National Maps webpages.
Other Global Highlights
Temperature
The April global surface temperature was 2.38°F (1.32°C) above the 20th-century average of 56.7°F (13.7°C), making it the warmest April on record and the 11th consecutive month of record-high global temperatures. According to NCEI’s Global Annual Temperature Outlook, there is a 61% chance that 2024 will rank as the warmest year on record and a 100% chance that it will rank in the top five.
April temperatures were above average across most of the global land surface except for much of mainland Australia, Scandinavia and northwest Russia, parts of southern Asia and East Africa and much of east Antarctica. South America had its warmest April on record while Europe had its second warmest. Sea surface temperatures were above average over most areas (and record warm over the tropical Atlantic Ocean), while parts of the Southern, southeastern Pacific and southern Indian Oceans were below average. The global oceans have been record-warm since April 2023.
Temperatures in the mid-troposphere (approximately 2–6 miles above the Earth’s surface) were record-warm in April, according to satellite data from NESDIS. Each of the past ten months set global records for the mid-troposphere.
The year-to-date (January–April) global surface temperature was 2.41°F (1.34°C) above the 20th-century average, making it the warmest such period on record. South America and Europe had their warmest year-to-date period, whereas Africa and North America were second warmest.
Snow Cover
Northern Hemisphere snow cover extent in April was the smallest on record. Both Eurasia and North America were below average (by 350,000 and 470,000 square miles, respectively). In general, much of western Russia and southern Canada were below average whereas parts of eastern Russia and China were above average.
Sea Ice
April 2024 average Arctic (left) and Antarctic (right) sea ice extent. Image Courtesy of NSIDC/NOAA NCEI
Global sea ice extent was the tenth smallest in the 46-year record at 7.84 million square miles, which was 370,000 square miles below the 1991–2020 average. Arctic sea ice extent was below average (by 80,000 square miles), and Antarctic sea ice extent was also below average (by 290,000 square miles).
Tropical Cyclones
Two named storms occurred across the globe in April, which was below the 1991–2020 average of four. The only major storm was Severe Tropical Cyclone Olga, which brought high surf conditions to northwestern Australia. The only other storm during the month was Tropical Cyclone Paul, which remained off the coast of northeastern Australia.
For a more complete summary of climate conditions and events, see our April 2024 Global Climate Report or explore our Climate at a Glance Global Time Series.


Useful Resources Include:
U.S. Climate at a Glance can be accessed HERE
U.S. Climate at a Glance Time Series can be accessed HERE
NCEI Monthly U.S Climate Report which can be accessed HERE
Global Climate at a Glance Time Series can be accessed HERE
Global Climate at a Glance can be accessed HERE
Global Climate Monthly Report can be accessed HERE.
–
| I hope you found this article interesting and useful. |
–