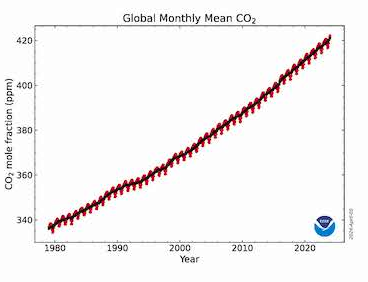
Not a surprise but worth keeping track of and it is an interesting summary. I have published Theo Stein’s post in full and added some of my comments in boxes below some of the graphs and I added a paragraph explaining the Keeling Curve.

Some may need to click on “Read More” to read the rest of this interesting article
| This curve is very interesting as the level stopped rising then started rising again and then the rate of increase became larger. |
| There may be ways to reduce the need for nitrogen-based fertilizers. |
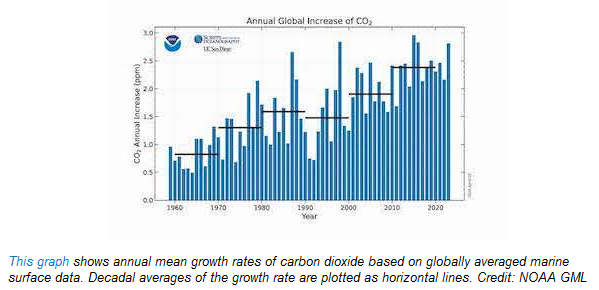
| Unlike the Keeling Curve, this shows the rates of increase. The point of measurement is different also. Perhaps the author should have led with this graphic as it clearly shows that the rate of increase may not be increasing but is not slowing down either. It is also not clearly increasing but we will need a few more years of data to conclude that this is the case. |
| The above could be a prelude to a long discussion about how this process plays out. The impacts of Global Warming have in general been underestimated. There will be winners and losers. |
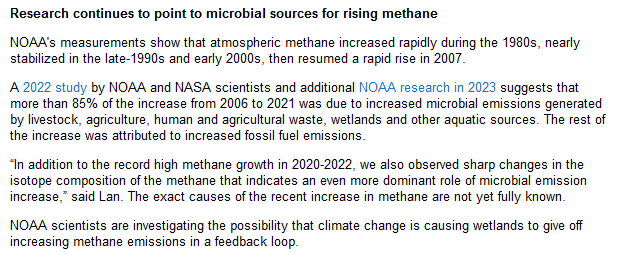
| The above is very concerning. The last paragraph suggests that the increase is not due to oil and gas but the result of the increase in temperature and of course the increase in population. |
Useful references include
Global Monitoring Laboratory LINK,
NOAA.Gov LINK,
The Source of this article. I received it by email but wanted to provide the source and here is the LINK.
–
| I hope you found this article interesting and useful. |
–




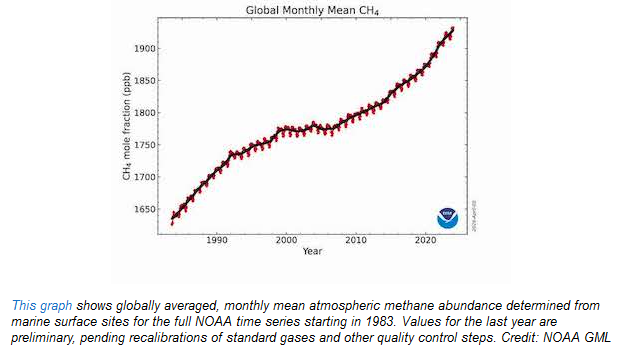




Is there an explanation for the leveling of methane from 2000 to 2008? Also, the County is or will be recruiting for the water advisory committee. I think you would be an ideal candidate. Email me at lgraeser@cybermesa.com and I’ll send you the information that I have. Deadline for application is April 19.