At the end of every month, NOAA updates its Outlook for the following month which in this case is April of 2024. We are reporting on that tonight.
There have been some significant changes in the Outlook for April and these are addressed in the NOAA Discussion so it is well worth reading. We provided the prior Mid-Month Outlook for April for comparison. It is easy to see the changes by comparing the Mid-Month and Updated Maps.
The article includes the Drought Outlook for April. NOAA also adjusted the previously issued Seasonal (AMJ) Drought Outlook to reflect the changes in the April Drought Outlook. We have included a map showing the amount of water in the snowpack waiting to be released in the Spring. We also provide the Week 2/3 Tropical Outlook for the World. We also include a very interesting CLIMAS Discussion.
The best way to understand the updated outlook for April is to view the maps and read the NOAA discussion. I have highlighted the key statements in the NOAA Discussion.
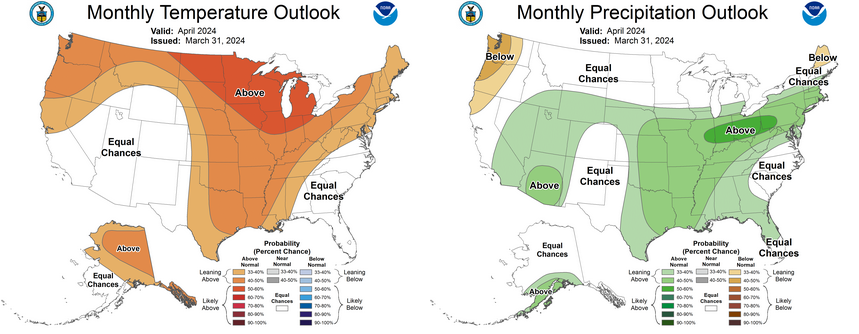
Here is the updated Outlook for April 2024.
For Comparison Purposes, Here is the earlier Mid-Month Outlook for April
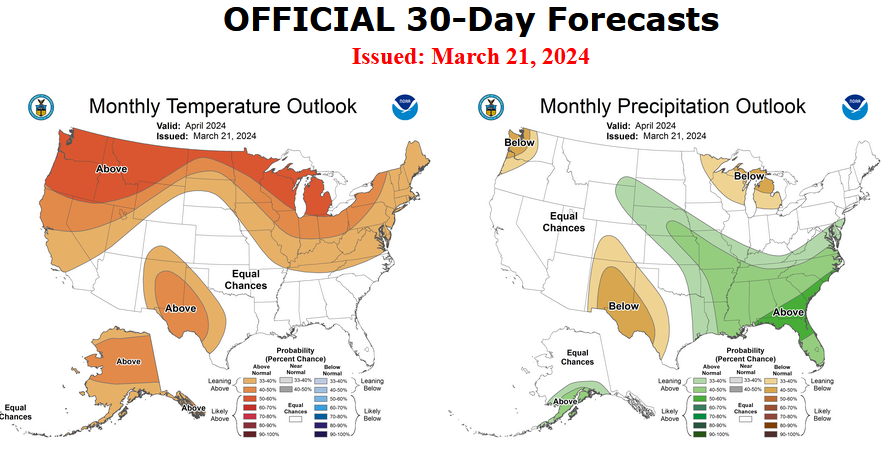
| There have been some significant changes. Remember, it is the top set of maps that are the current outlook for April. |
Combination of the Updated Outlook for April and the Three-Month Outlook
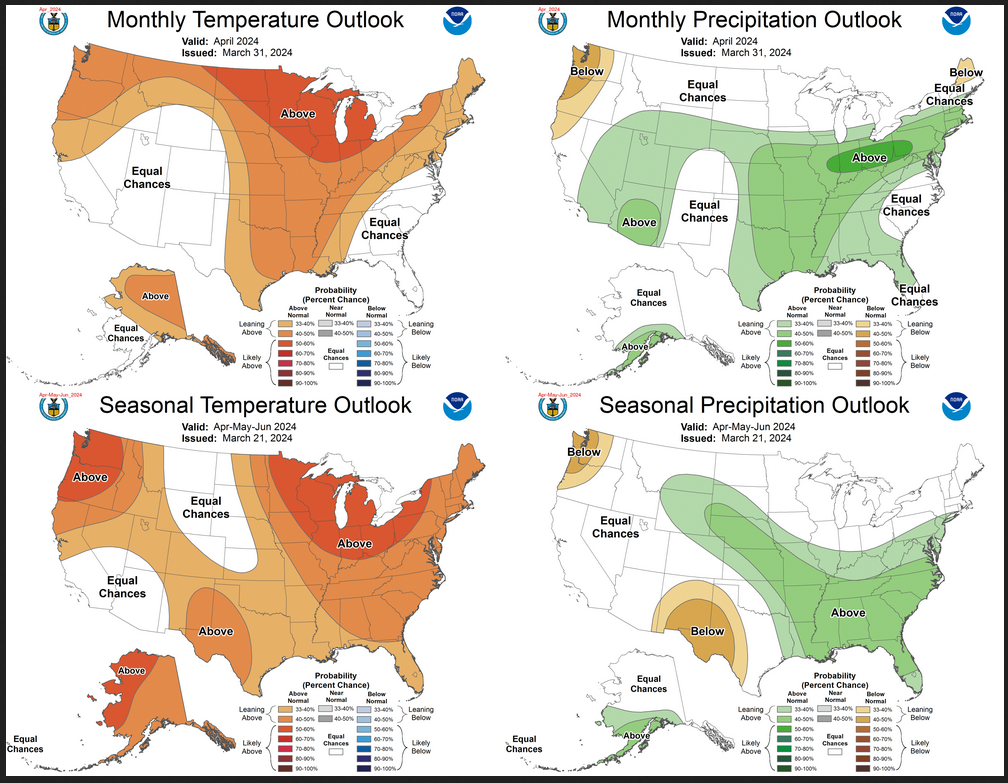
| The top row is the Updated Outlook for the new month. There is a temperature map and a precipitation map. The second row is a three-month outlook that includes the new month. I think the outlook maps are self-explanatory. What is important to remember is that they show deviations from the current definition of normal which is the period 1991 through 2020. So this is not a forecast of the absolute value of temperature or precipitation but the change from what is defined as normal or to use the technical term climatology. |
| The three-month map was issued on March 21, 2024. One expects some changes 10 days later. But the changes to both maps are fairly dramatic. This then gives us some reason to question the three-month AMJ temperature and precipitation Outlooks. |
Some readers may need to click “Read More” to read the rest of the article. Some will feel that they have enough information. But there is a lot more information in the rest of this article.
| Our regular Daily Weather article can be found HERE. In addition to the short-term forecast it also provides the 6 – 10 day, 8 – 14 day, and Week 3 – 4 Outlooks. That is not a full month but close to it. So it is helpful if one wants to understand how the full-month forecast is expected to vary through the month. And the maps in the Daily Article update throughout the month. |
Here are larger versions of the Temperature and Precipitation Outlook maps.
NOAA (Really the National Weather Service Climate Prediction Division CPC) Discussion. I have shown certain important points in bold type. My comments if any are in brackets [ ].
30-DAY OUTLOOK DISCUSSION FOR APRIL 2024
The update to the 0.5-month lead April 2024 temperature and precipitation outlooks are based primarily on official precipitation outlooks for Week-1 (from WPC) and for Week-2 and Week- 3/4 (from CPC), the latest dynamical model output that extends two weeks into the future, current boundary conditions (snow cover/depth and soil moisture), lagged temperature composites from the Madden-Julian Oscillation (MJO), and historical temperature and precipitation trends. Lagged El Nino impacts from the rapidly weakening El Nino are expected to extend well into April.
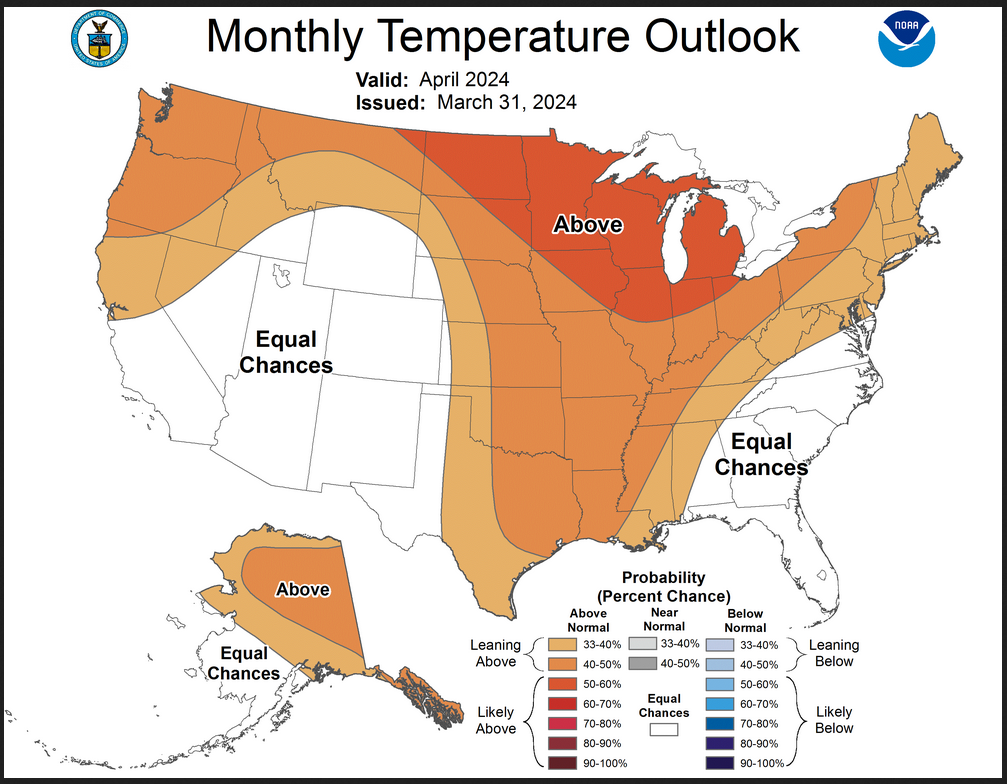
Temperature
The updated temperature outlook for April favors above-normal monthly mean temperatures from the Pacific Northwest and Northern California generally eastward across the Northern Rockies, Northern Plains, central and eastern portions of the Central and Southern Plains, the Mississippi-, Tennessee-, and Ohio Valleys, Great Lakes region, Central and Northern Appalachians, Northeast, and most of the Mid-Atlantic region. Warmer-than-normal temperatures are also favored over most of Alaska, excluding southwest portions of the Mainland, the Alaska Peninsula, and the Aleutians, where Equal Chances (EC) of below-, near-, and above-normal monthly mean temperatures are favored. This widespread area of favored above-normal temperatures represents a subjective compromise between the various constituent WPC and CPC temperature outlooks, which together comprise the April monthly mean, and on dynamical model guidance from the GEFS and ECMWF ensemble means which extend through the first half of April. The modest tilt in the odds towards above-normal temperatures near the Northeast and Upper Mid-Atlantic coast is due to anticipated tempering effects of soil moisture, where current ranked percentiles exceed the 95th historical percentile. Large negative anomalies of snow cover and depth across the interior Northeast, Great Lakes region, and Upper Midwest contribute towards heightened probabilities for above-normal temperatures in those areas. The large region of EC indicated across the Southwest is due to an expected relatively cool first half of April, followed by EC for the second half. A mid-level ridge is forecast to build across this region later in the month, which works in tandem with positive temperature trends . When the month as a whole is considered, EC is thought to be the most likely scenario for the Southwest.
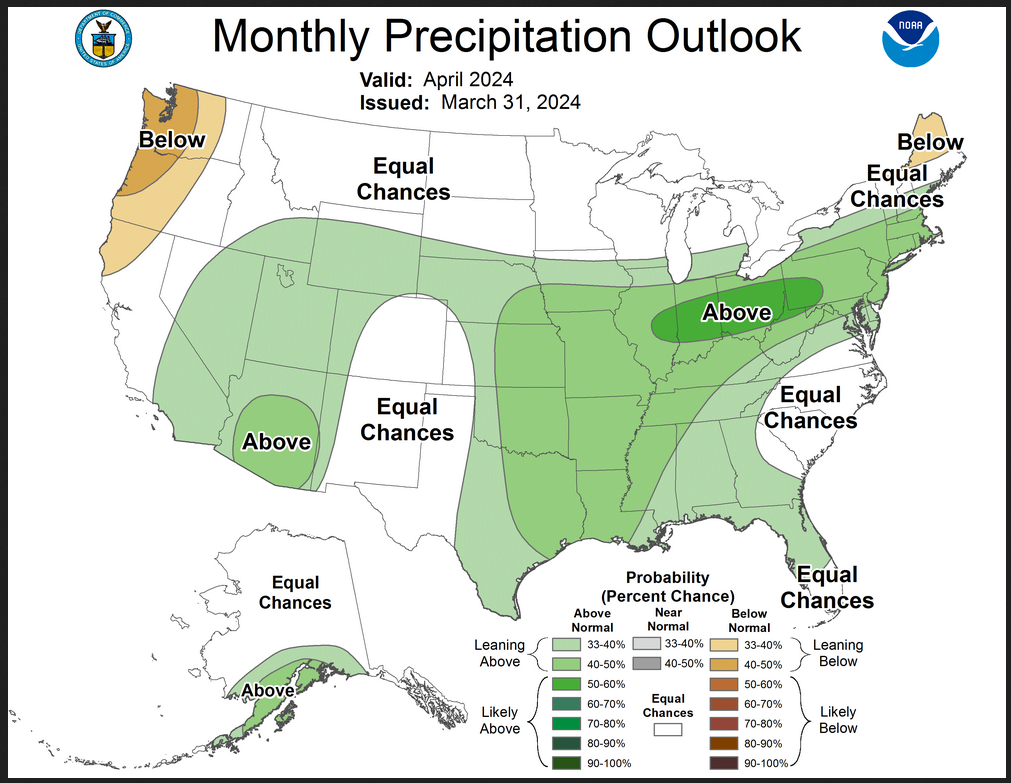
Precipitation
The updated precipitation outlook for April favors above-normal precipitation amounts from the southwestern Contiguous U.S (CONUS) across Wyoming, eastern portions of the Central and Southern Plains, and continuing eastward to the Atlantic Coast from southern Maine in the north to southern Florida in the south. The exceptions include southern Virginia, the Carolinas, and northeast Georgia where EC is favored. Maximum probabilities for above-normal precipitation (greater than 50%) extend from south-central Illinois eastward across Indiana, Ohio, and western Pennsylvania. This is primarily based on WPC’s Week-1 precipitation forecast, with 2-4 inches (locally heavier) of rain expected within the first few days of April, related to a quasi-stationary front accompanied by several waves of surface low pressure. During the second week of the month, above-normal precipitation is expected to shift to the middle portion of the CONUS (Central and Southern Plains, and Middle to Lower Mississippi Valley) with an eastward extension across much of the Southeast. This is consistent with CPC’s Week-2 precipitation outlook, and on total precipitation amounts for that 7-day period from the GEFS and ECMWF ensembles. For southern Texas, the precipitation amounts received during the first two weeks is expected to register as above-normal, despite an anticipated drier finish to April. It is unclear as to whether or not these rainfall amounts will be enough to justify some improvement in the regional drought conditions there. Across the Southwest CONUS, there are increased chances for above-normal precipitation based on WPC’s Week-1 precipitation forecast, and CPC’s Week-2 and Week-3,4 precipitation outlooks. Wetter-than-normal conditions are typically observed across the Southwest during the final stages of a strong El Nino, as atmospheric impacts tend to lag a bit even as the positive sea-surface temperature anomalies weaken rapidly over the equatorial Pacific. Below-normal precipitation amounts are favored over much of the northern and central Pacific Coast states, and over Northern Maine. This is generally based on WPC and CPC precipitation guidance throughout the month of April. The small area of favored relative dryness depicted over Northern Maine is fairly uncertain, being not that far displaced from the heavy precipitation axis forecast to the south during Week-1 as noted above. Wetter-than-normal conditions are favored over southern Mainland Alaska and the Alaska Peninsula, based on a general consensus of model guidance, and on a significant mid-level trough expected to approach the state early in the period. Elsewhere in Alaska and the Lower 48 states, EC is favored.
Drought Outlook
Here is the newly issued Drought Outlook for the month.
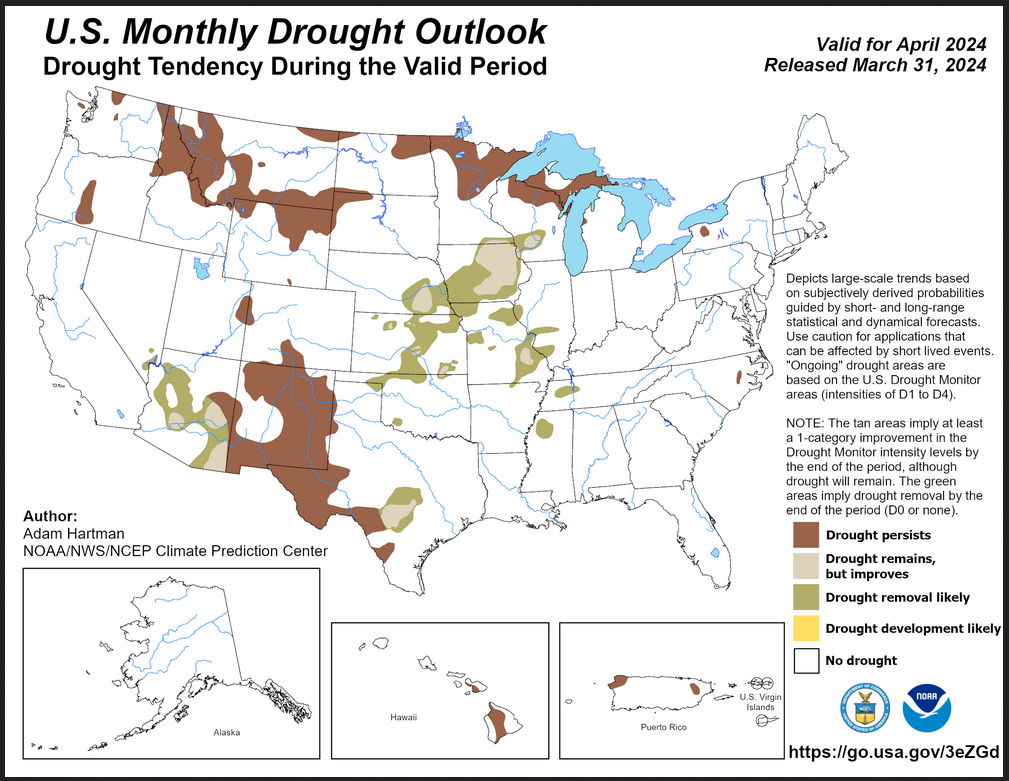
| You can see where drought development or reduction is likely. The updated outlook now calls for no new areas of drought developing but a large area where drought will remain and a significant area where drought is removed or remains but improves. The summary and detailed discussions that accompany this graphic can be accessed HERE, but the short version is shown below. |
Here is the short version of the drought summary
Latest Monthly Assessment – Since the March Monthly Drought Outlook (MDO) released on February 29, 2024, drought has continued to slowly improve across most of the Intermountain West due to a persistent storm track, especially over areas that saw several atmospheric river events since the beginning of the year. Improvement has also been observed across the Lower Mississippi Valley and Southeast, due in large part to a strong El Niño signal in the equatorial Pacific creating favorable conditions for an active storm track across the southern tier of the contiguous U.S. (CONUS). In recent weeks, strong storm systems have also traversed the central CONUS leading to broad improvements across parts of the Great Plains and Midwest. However, where adequate precipitation did not fall there were some localized regions where drought conditions spread or deteriorated.
Looking ahead to April 2024, drought conditions are favored to largely persist across the northern tier of the CONUS and parts of the Intermountain West. The exception is the Desert Southwest, where recent above normal precipitation, aided by an active storm track during much of the winter season, has resulted in improving drought conditions since mid-March. This region is primed for additional improvement over the next couple weeks due to wetter than normal precipitation outlooks. Drought improvement and removal are also forecast over much of the Central and Southern Plains and extending into the Mississippi Valley for similar reasoning.
Alaska is forecast to remain drought-free through the end of April, given wet antecedent conditions and the time of year. Drought persistence is favored in Hawaii and Puerto Rico. There are some conflicting signals among some of the forecast tools in Puerto Rico, but recent improvements and a tilt toward above normal precipitation should largely stave off any drought development through the end of April. The U.S. Virgin Islands are forecast to remain drought free.
We also have an updated Seasonal Drought Outlook (link).
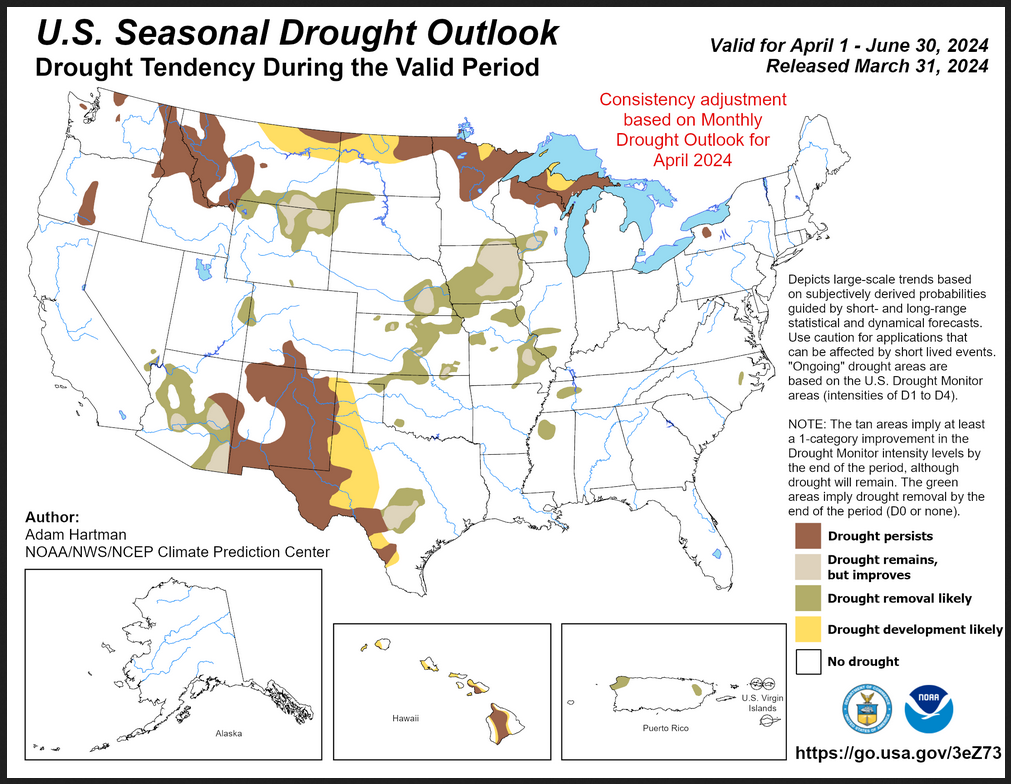
| This three-month outlook is only a bit different than the single-month outlook and it covers a longer period of time. Unlike the one month outlook it shows both areas of drought reduction and development. |
| To update this forecast (which updates on Tuesdays) click HERE |
Month-to-date Temperature as the current month evolves can be found at https://hprcc.unl.edu/products/maps/acis/MonthTDeptUS.png
Month-to-date Precipitation as the current month evolves can be found at https://hprcc.unl.edu/products/maps/acis/MonthPNormUS.png
CLIMAS Southwest Climate Report.
This month is a special treat for those who live in the Southwest but it actually covers all of the U.S. To access this report, click HERE. It even includes a podcast and some very useful links.
Current SWE which is a good predictor of Spring Runoff which is already in progress so this shows the SWE (water in the snow) remaining. I will be reporting on the projected water supply soon. For those who want continual updates, Here is the LINK
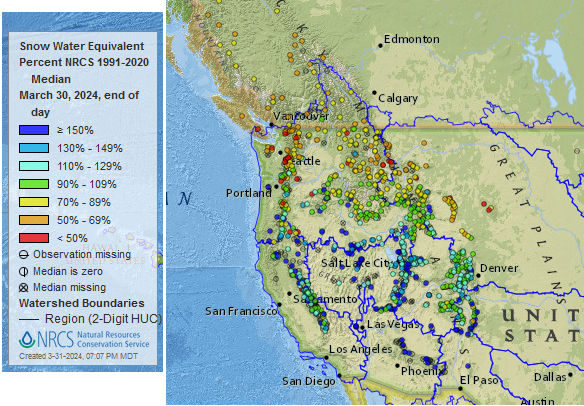
| This provides a very clear picture of the weather pattern since October 1, 2023. The pattern of where there is more snow than normal and where there is less than normal is pretty interesting. It is fairly similar to what one might expect with an El Nino but the area with the most snowpack is further north than what I was expecting. I think this El Nino was overrated with respect to the West but it still provided overall a wet water year in most place. I do not have similar data for the East since their water management approach is not to have snow levels accumulate in the mountains and melt during the spring. Some of that does happen in the East but it is not the dominant approach so looking at the water content of snow-pack is not widely done in the East except in certain places. In the West, it is the primary way that the water supply is tracked. |
Fire Outlook (The Site has Moved and I have not figured out how to print images from the new site yet. The link is HERE.
| I hope you found this article interesting and useful |