The mission of the National Weather Service Colorado Basin River Forecast Center (CBRFC) is to produce river, flood, and water supply forecasts for the Colorado Basin and the Great Basin in support of saving lives and property and to enhance the region’s environment and economy. The Colorado Basin River Forecast Center (CBRFC) geographic forecast area includes the Upper Colorado River Basin (UCRB), Lower Colorado River Basin (LCRB), and Eastern Great Basin (GB). You can access their website HERE.
In this article, I am providing a summary of their Water Supply Forecast Discussion released on March 19, 2024. The situation has improved but there is a lot of variability. It is not the usual north (dry) to south (wet) pattern that one expects with El Nino but more of a north (dry) center (wet) south (dry) pattern related to the storm track where it is wetter than north or south of the storm track. It shows up in terms of the Upper versus Lower Colorado Basin. Due to a wet winter last year, the reservoirs are mostly in good shape.
I have also included information on the current BOR reservoir storage levels including some that are outside of the Colorado River Basin. I also provide information on New Mexico which is partly in the Colorado Basin and mostly outside of the Colorado Basin.
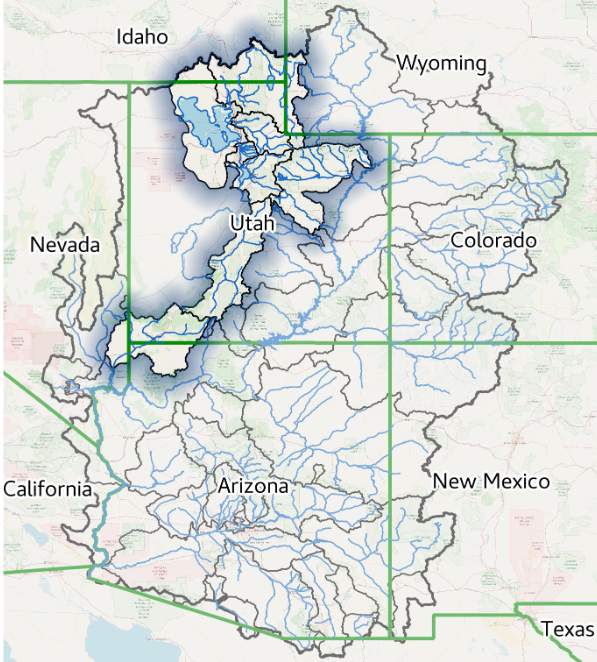
The image below shows part of the area covered in the CBRFC Report. The map shown here is only the Colorado Basin. The Eastern Great Basin is to the west of this map. The maps shown in the article cover both basins but are not as scenic as this map.
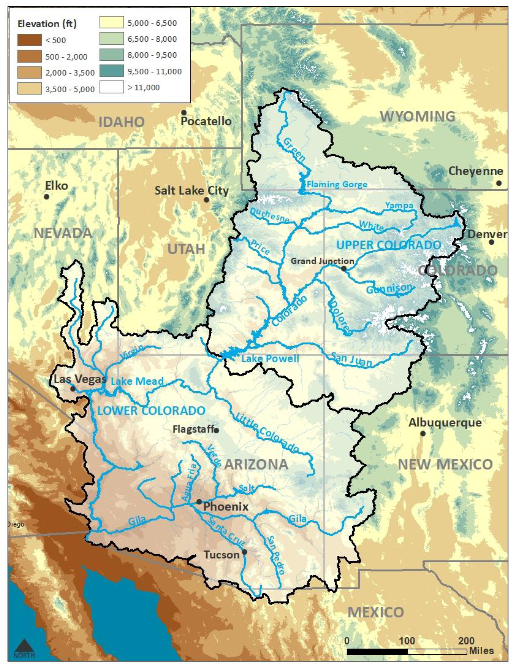
Map showing both the Colorado Basin and Eastern Great Basin.
Please click on “Read More” to read the rest of this article.
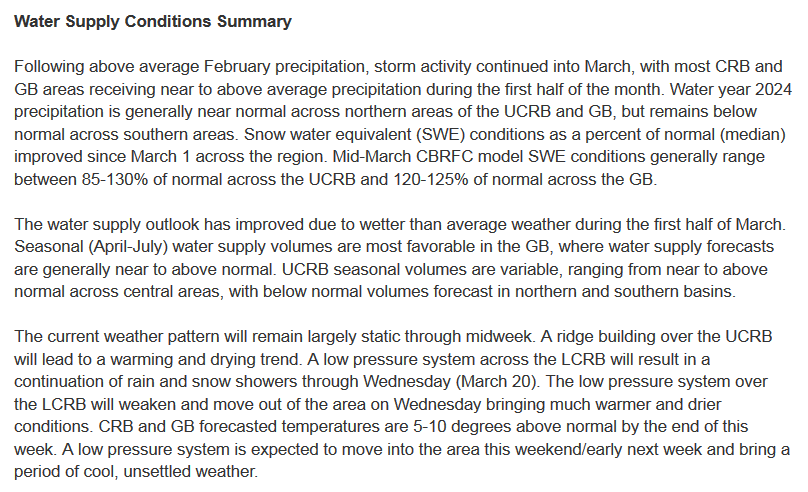

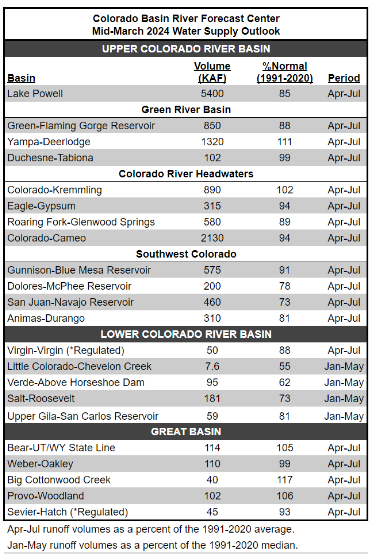
| Almost all areas are forecasting water supply [the flows not the reservoir levels which are discussed elsewhere] to be less than 100% of Climatology defined as the 1991 – 2020 Average. I am a little surprised by this given the recent storms. For specific water supply forecasts with confidence intervals click HERE |
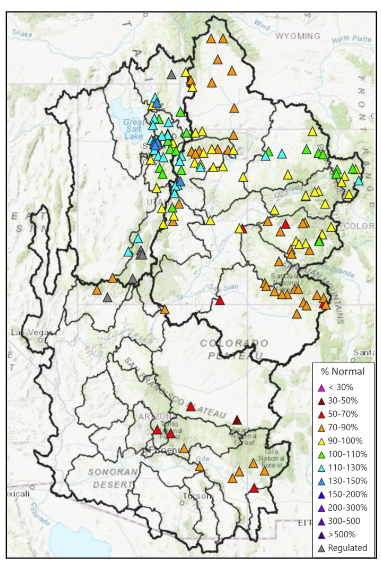

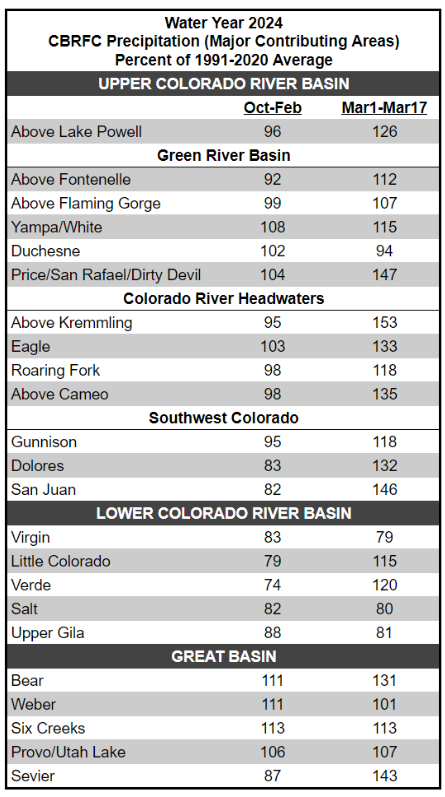
| Almost all areas are recording precipitation October through February which has been less than 100% of Climatology defined as the 1991 – 2020 Average . The first half of March has been much better. The precipitation maps for prior months can be viewed HERE |
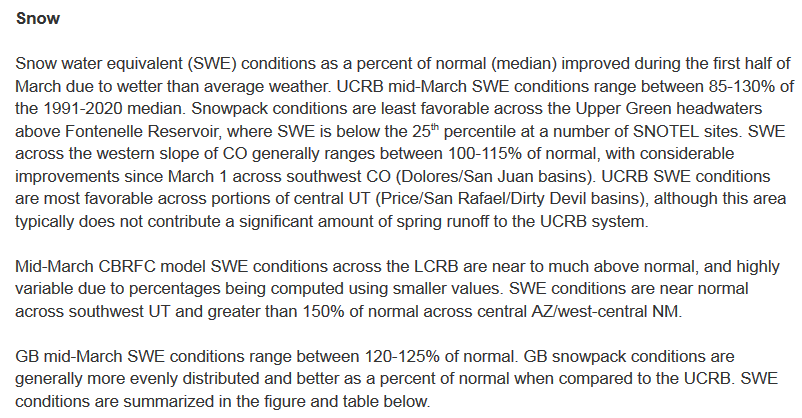
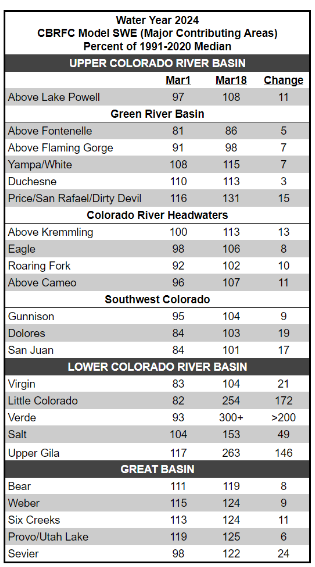
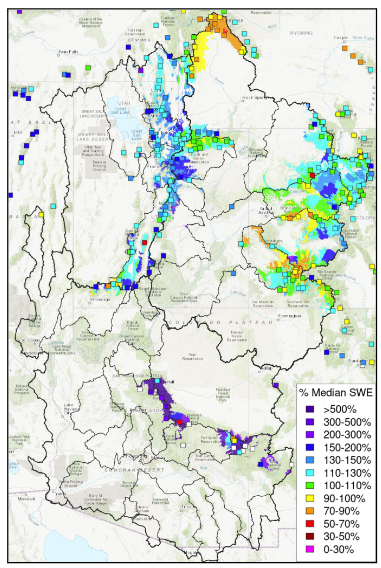
| With respect to SWE, almost all areas are now forecasting more than 100% of Climatology defined as the 1991 – 2020 Average. We are at the time of the year when some areas have begun the spring meltoff and late storms can show a large percentage increase in their current SWE. But there is no guarantee that SWE will translate into snowmelt as premature temperature rise and wind can reduce the amount |
For updated SNOTEL information click HERE
For CBRFC hydrologic model snow click HERE
For CBRFC’s beginning-of-the-month online publication that contains basin conditions, summary graphics,
and end-of-month reservoir content tables refer to the following links.
Basin Conditions and Summary Graphics
Green River Basin
Upper Colorado River Basin
San Juan River Basin
Great Salt Lake Basin
Sevier River Basin
Virgin River Basin
End Of Month Reservoir Content Tables
Green River Basin
Upper Colorado River Basin
San Juan River Basin
Great Salt Lake Basin
Sevier Basin
Explanation of Abbreviations
That completes what we are reporting for CBRFC. From a Different Source (USBR.gov) and Covering a Larger Area and with some more recent data:

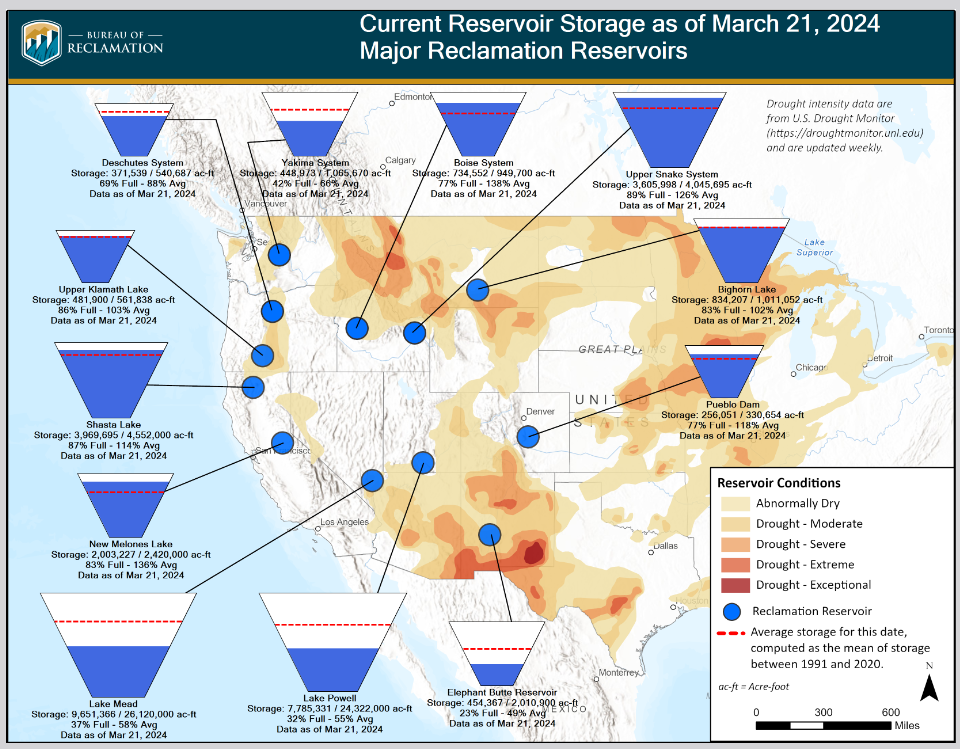
| Many reservoirs are back to their average or slightly above. Others are still below average but much above the desperate levels of last year. It will take a run of wet years to get Lakes Powell and Mead back to normal. Those two reservoirs do not empty each year so they represent true storage. Elephant Butte may have once been a storage dam but with Climate Change and the Negative Phase of the PDO Cycle, it generally releases what it receives during the irrigation season down to a safe storage level and other considerations. Click HERE to update this image. You will actually have to change the date in the URL to get the updated map. Additional information on individual reservoirs can be found HERE. |
New Mexico Rio Grande Compact Compliance.
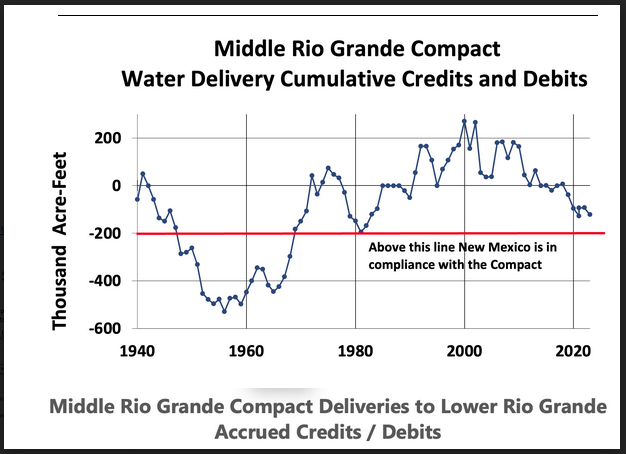
Graphic prepared from NMISC data by Norm Gaume, P.E. (ret.) President, NMWaterAdvocates.Org
| This shows the yearly accumulated net credit or debit situation relative to the Rio Grande Compact. The red line is the level of debits which if exceeded puts New Mexico out of compliance. There appears to be a variable but steady trend towards the non-compliance level. Many factors contribute to this but Global Warming appears to be a major factor. |
The New Mexico Water Supply Report for March 1, 2024 can be accessed HERE. Prior and future reports can be obtained HERE.
–
| I hope you found this article interesting and useful. |
–

Very timely, with the county thinking that there is no problem with water. With your permission, I’d like to distribute this article to the San Marcos Association board.
I put my articles in the public domain so that they can be widely distributed. So please send the URL for my article to anyone who you think will find it to be useful.
All my articles are posted on Econcurrents.com which also sends out a newsletter every day with all the current posts plus additional information that one of the Editors provides. Periodically I send out my major articles to my private list. So anyone who wants to be on that list let me know and I will add them.
I write a daily weather article and the best way to access that is to go to the EconCurrents.com website. The URL changes every day.