It is difficult to find a more comprehensive Weather Outlook anywhere else with the ability to get a local 10-day Forecast also.
This article focuses on what we are paying attention to in the next 48 to 72 hours. The article also includes weather maps for longer-term U.S. outlooks and a six-day World weather outlook which can be very useful for travelers.
First the NWS Short Range Forecast. The afternoon NWS text update can be found here but it is unlikely to have changed very much. The images in this article automatically update.
Short Range Forecast Discussion
NWS Weather Prediction Center College Park MD
Fri Mar 15 2024
Valid 12Z Fri Mar 15 2024 – 12Z Sun Mar 17 2024…Heavy mountain snow continues throughout the Four Corners region into
this weekend……Severe thunderstorm and excessive rainfall chances shift south into the
Southeast and Gulf Coast States……Mild weather continues across the Pacific Northwest and East Coast…
A meandering closed upper low spinning over the Desert Southwest will
continue to funnel moisture northward into the Four Corners region and
create additional chances for heavy mountain snow through the weekend.
Snow chances will diminish today across the central/southern High Plains
as upslope flow weakens, but mountainous terrain of the central and
southern Rockies can expect an additional 1 to 2 feet of snow through
Sunday. The higher elevations of southern Utah and Arizona can also expect
snowfall accumulations over a foot, which will create hazardous driving
conditions. Winter Storm Warnings and Winter Weather Advisories remain in
effect for these regions.Farther east, waves of low pressure and an associated cold front are
forecast to slide south and east today while stretching from the
Mid-Atlantic to the Southern Plains. Heavy rain and scattered
thunderstorms will accompany this system, with the greatest chances for
severe weather and/or flash flooding located across parts of the Mid-South
and south-central Texas. For these areas, thunderstorms could be strong
enough to contain damaging wind gusts and isolated tornadoes. Meanwhile,
the primary risk across south-central Texas is expected to be associated
with large hail and scattered flash flooding. By this weekend, the
aforementioned frontal boundary is forecast to stall along the Gulf Coast
and southern Texas, resulting in additional chances for heavy rain that
could lead to scattered flooding concerns from south-central Texas to
southern Mississippi.The other notable weather system to impact the Lower 48 will be a potent
low pressure system passing to the north of the Great Lakes on Saturday
and nearing Maine on Sunday. The greatest impacts are anticipated to be
associated with gusty winds across the Great Lakes and decreasing
temperatures throughout the Upper Midwest by Sunday. Additionally, periods
of lake effect snow could be locally heavy across the U.P. of Michigan
downwind of Lake Superior. Otherwise, strong southerly flow on the eastern
side of this system will keep much of the East Coast mild with high
temperatures mainly in the 60s and 70s. The other warm spots over the next
few days include the Pacific Northwest and Southeast, where a few daily
record highs are possible. Parts of western Washington and Oregon may see
highs into the mid-70s, while mid-to-upper 80s are found throughout the
Sunshine State.
To get your local forecast plus active alerts and warnings click HERE and enter your city, state or zip code.
Above is a 72 hour animation of the forecast. Learn about wave patterns HERE.
Then, looking at the world and of course, the U.S. shows here also. Today we are looking at precipitation.
Please click on “Read More” below to access the full Daily Report issued today.
| Notices: What would you like to learn about? Please provide that to me via the comment section at the end of the article. |
Now more detail on the 48-Hour Forecast (It is a 48 to 72 Hour Forecast actually)
Daily weather maps. The Day 1 map updates twice a day and the Day 2 and 3 maps update only once a day. These maps update automatically. But if that does not happen, you can get updates by clicking HERE
TODAY (or late in the day the evening/overnight map will appear) (Key to surface fronts shown on maps and you will then also be able to insert a city name or zip code and get a local NWS forecast).
TOMORROW
NEXT DAY
This animation shows how things may play out over the next 60 hours. To update click here.
The NWS Climate Prediction Center’s: Watches, Warnings, and Advisories plus other information can be found HERE. We post at least one of those updates daily, sometimes both. The Highlights are shown in the lede paragraph of this article.
ATMOSPHERIC RIVERS
This tells us what is approaching the West Coast. Click HERE to update If I have not gotten around to doing the update. Here is some useful information about Atmospheric Rivers.
Below is the current five-day cumulative forecast of precipitation (Updates can be found HERE)
Ski SnowReports
New Feature – Ski Reports. It is difficult to find reports that auto-update on-screen (and they are very long) but these links will get you to them – If you have additional suggestions make them in the comments section after every Econcurrents Article and we may add those links. We will try to not have too much overlap as that can add to the confusion.
Snow Forecasts. And remember this shows natural snow. Ski resorts also make their own snow.
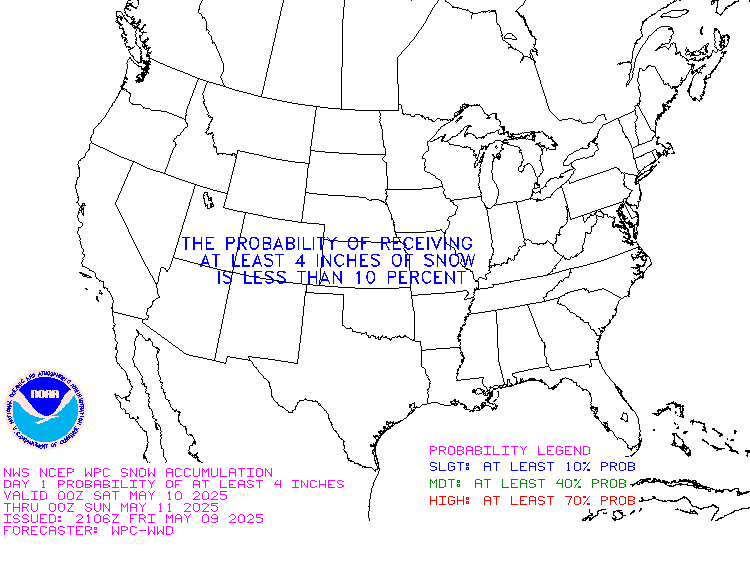
Day 1

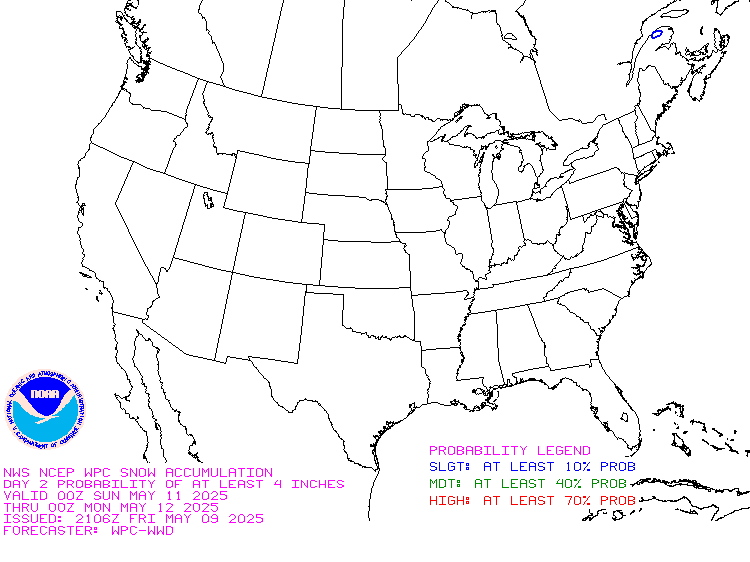
Day 2

Additional snow information can be found here, here, here, and here. The second link provides animations.
Now we look at Intermediate-Term “Outlook” maps for three time periods. Days 6 – 10, Days 8 – 14, and Weeks 3 and 4. An outlook differs from a forecast based on how NOAA uses these terms in that an “outlook” presents information as deviation from normal and the likelihood of these deviations.
Below are the links to obtain updates and additional information. They are particularly useful if you happen to be reading this article significantly later than when it was published. I always try to provide readers with the source of the information in my articles. These links may also be useful for those viewing this article on a cell phone or other small screen.
| Days 6 – 10 (shown in Row 1) | Days 8 – 14 (Shown in Row 2) | Weeks 3 and 4 (Shown in Row 3 but updates only on Fridays) |
| https://www.cpc.ncep.noaa. gov/products/predictions/610day/ | https://www.cpc.ncep .noaa.gov/products/predictions/814day/ | https://www.cpc.ncep.noaa.gov/products/predictions/WK34/ |
Showing the actual maps. They should now update automatically. The Week 3 – 4 Outlook only updates on Fridays. So below is what I call the Intermediate-term outlook. On Fridays, it extends out 28 Days. That declines day by day so on Thursday it only looks out 22 days until the next day when the Week 3 – 4 Outlook is updated and this extends the outlook by one additional week.
| 6–
10
|
|
|
| 8–
14 |
|
|
| 3–
4 |
|
|
HAZARDS OUTLOOKS
Click here for the latest complete Day 3 -7 Hazards forecast which updates only on weekdays. Once a week probably Monday or Tuesday I will update the images. I provided the link for readers to get daily updates on weekdays. Use your own judgment to decide if you need to update these images. I update almost all the images Friday Night for the weekend edition of this Weather Report. So normally readers do not need to update these images but if the weather is changing quickly you may want to.
Temperature month to date can be found at https://hprcc.unl.edu/products/maps/acis/MonthTDeptUS.png
Precipitation month to date can be found at https://hprcc.unl.edu/products/maps/acis /MonthPNormUS.png
World Forecast [that website is has been intermittent so be patient]
Below are the Day 1 -3 and 4-6 forecasts for temperature and precipitation. Updates and much additional information can be obtained HERE
World Temperature Anomalies
World Accumulated Precipitation
This information is provided by the University of Maine. They draw upon many different sources. There is a lot of information available at the link provided. I have just provided two useful forecasts. There are probably over a hundred different forecasts available from this source.
Worldwide Tropical Forecast (This is a NOAA Product)
This graphic updates on Tuesdays) If it has not been updated, you can get the update by clicking here Readers will only have to do that if they are reading this article much later than the date of it being published.
Information on Tropical Storms can be found HERE. Western Pacific information can be found HERE.
–
| I hope you found this article interesting and useful. |
–
