At the end of every month, NOAA updates its Outlook for the following month which in this case is February of 2024. We are reporting on that tonight.
There have been some significant changes in the Outlook for February and these are addressed in the NOAA Discussion so it is well worth reading. We provided the prior Mid-Month Outlook for February for comparison. It is easy to see the changes by comparing the Mid-Month and Updated Maps.
The article includes the Drought Outlook for February. NOAA also adjusted the previously issued Seasonal (FMA) Drought Outlook to reflect the changes in the February Drought Outlook. We have included a map showing the amount of water in the snowpack waiting to be released in the Spring. We also provide the Week 2/3 Tropical Outlook for the World. We also include a very interesting CLIMAS Podcast.
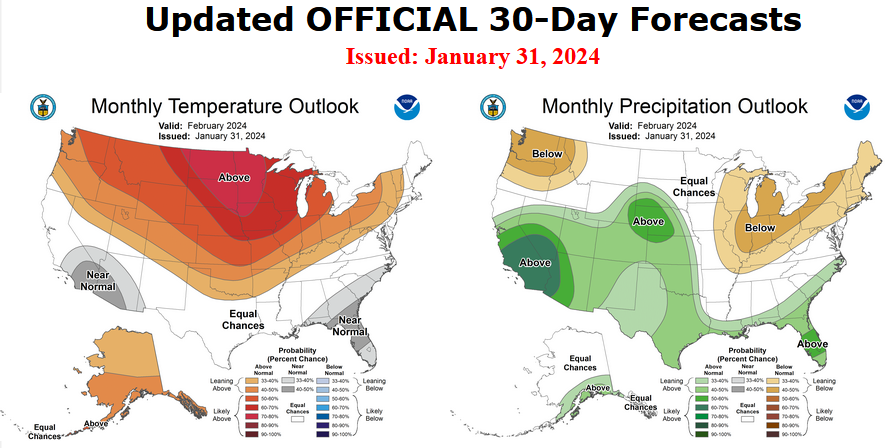
The best way to understand the updated outlook for February is to view the maps and read the NOAA discussion. I have highlighted the key statements in the NOAA Discussion.
Here is the updated Outlook for February 2024.
For Comparison Purposes, Here is the earlier Mid-Month Outlook for February.
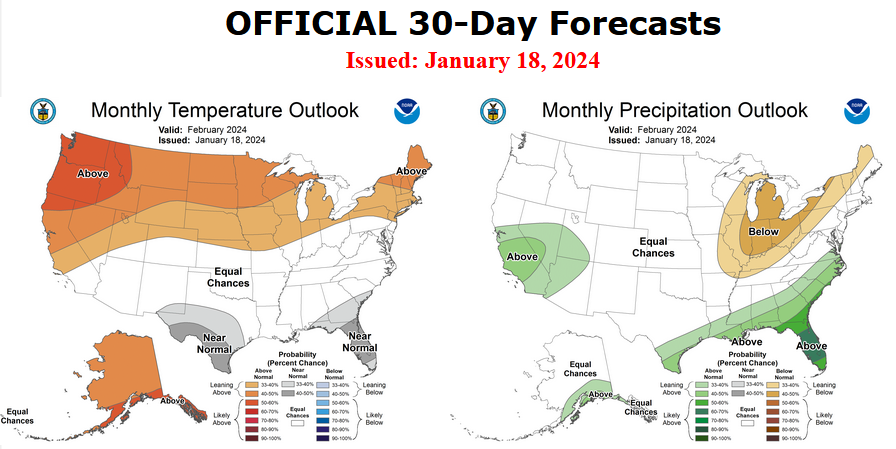
| There have been some significant changes especially related to precipitation. Remember, it is the top set of maps that are the current outlook for February. When the Mid-month Outlook was issued we were not sure that it and the FMA map agreed with the discussion. It is a huge change. You can track the actual weather and updates of the outlook in our Daily Weather Article. |
Combination of the Updated Outlook for February and the Three-Month Outlook
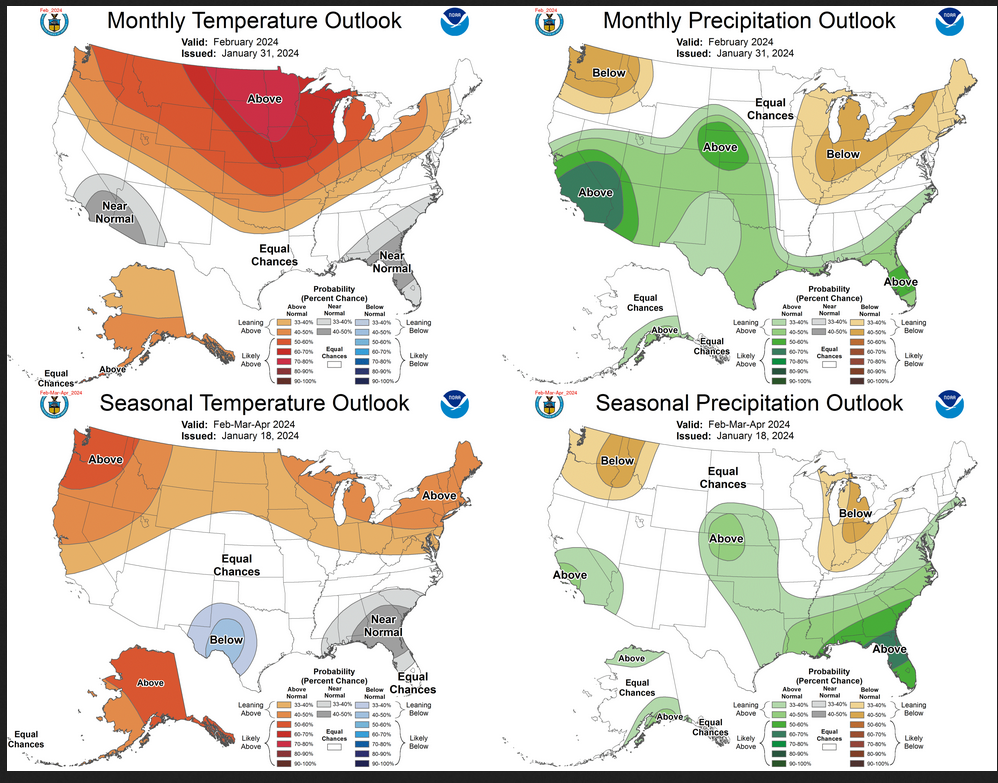
| The top row is the Updated Outlook for the new month. There is a temperature map and a precipitation map. The second row is a three-month outlook that includes the new month. I think the outlook maps are self-explanatory. What is important to remember is that they show deviations from the current definition of normal which is the period 1991 through 2020. So this is not a forecast of the absolute value of temperature or precipitation but the change from what is defined as normal or to use the technical term climatology. |
| The three-month map was issued on January 18, 2024. One expects some changes 13 days later. But the change to the precipitation map is very dramatic. Thus to some extent, I question the reliability of the FMA three-month map. As an example look at Arizona and New Mexico. Assuming February turns out as shown, imagine how dry March and April would have to be for the three-month map to be accurate. The same goes for the North Central Temperature Map. We have to take into consideration what wetter than normal means in different months. For Arizona and New Mexico February tends to be dry so wetter than normal may not be much in terms of inches of precipitation. |
| Our regular Daily Weather article can be found HERE. In addition to the short-term forecast it also provides the 6 – 10 day, 8 – 14 day, and Week 3 – 4 Outlooks. That is not a full month but close to it. So it is helpful if one wants to understand how the full-month forecast is expected to vary through the month. And the maps in the Daily Article update throughout the month. |
Here are larger versions of the Temperature and Precipitation Outlook maps.
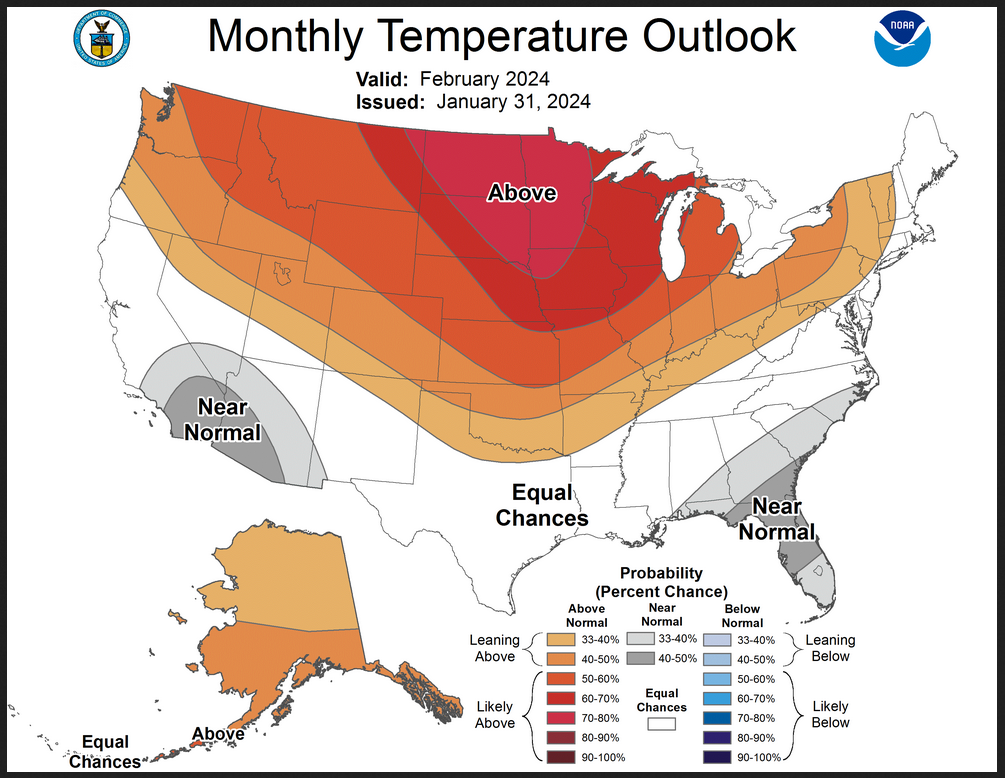
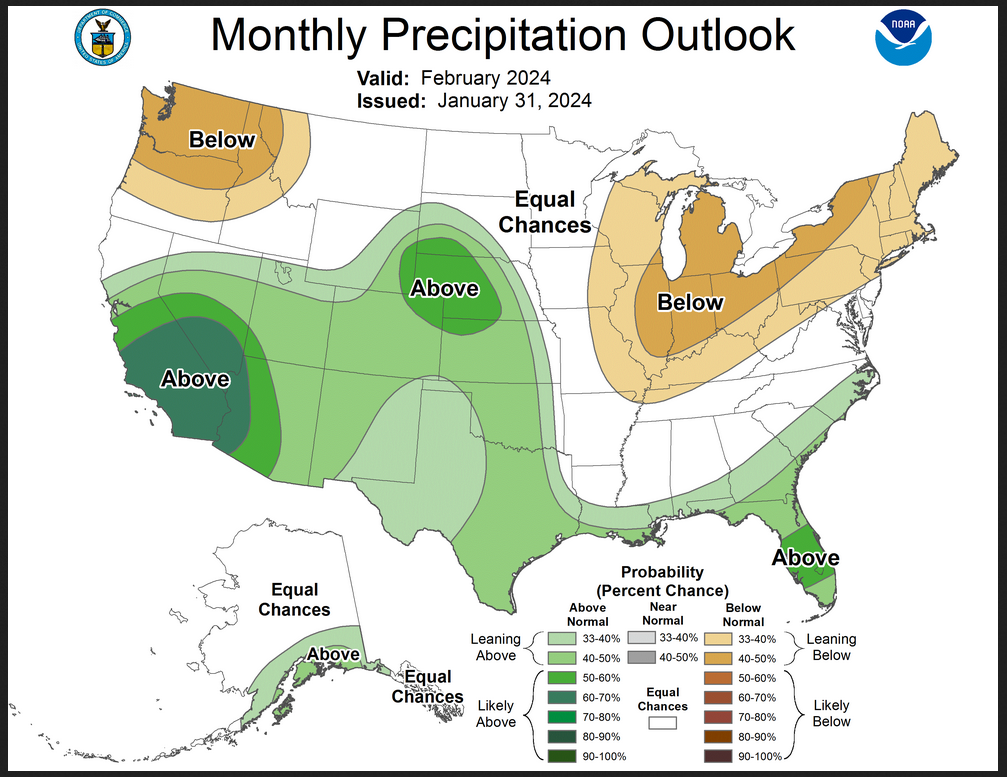
NOAA (Really the National Weather Service Climate Prediction Division CPC) Discussion. I have shown certain important points in bold type. My comments if any are in brackets [ ].
30-DAY OUTLOOK DISCUSSION FOR FEBRUARY 2024
The updated February 2024 monthly temperature and precipitation outlooks are based on the latest dynamical model guidance, including the CFSv2 and GEFSv12 forecasts for the month of February, as well as the Weather Prediction Center (WPC) temperature and precipitation forecasts for the first week of the month, the CPC 6-10 day and 8-14 day temperature and precipitation outlooks, and the latest CPC week 3-4 outlook (valid February 10-23). Although the ongoing El Niño is predicted to weaken over the next few months, it remains a major climate driver impacting the mid-latitude circulation and February temperature and precipitation. The Madden-Julian Oscillation (MJO) is currently active with enhanced convection over the Western Pacific. However, dynamical models , including the ECMWF and GEFS, indicate large uncertainties in the MJO forecast and somewhat stationary convection, as the subseasonal variability interacts with the El Niño circulation pattern. The MJO was only considered in the monthly outlook to the extent that impacts may be associated with variability in the dynamical model forecasts for the first two weeks of February.
A low pressure system is expected to impact the west coast of the contiguous US (CONUS) during the first week of the month. Dynamical model forecasts from the GEFS and ECMWF ensemble prediction systems predict the mid-level trough near the Pacific coast at the start of February to move eastward into the southwestern CONUS and weaken during the second week of the month. The most recent available ECMWF and GEFS ensemble forecasts predict a positive 500-hPa height anomaly extending from Mainland Alaska southward into the western CONUS in the third week of February, with a negative 500-hPa height anomaly centered over the Northeast. There is significant uncertainty in dynamical model forecasts for the end of February, with generally negative 500-hPa height anomalies extending across the southern tier of the CONUS in most model solutions, positive 500-hPa height anomalies over Alaska, and the CFS predicting positive 500-hPa height anomalies extending across the northern tier of the CONUS, consistent with the mid-latitude circulation pattern associated with El Niño.
Temperature
The February outlook slightly favors above normal temperatures across Alaska, excluding the western Aleutians, as dynamical model forecasts predict a rapid change from likely below normal temperatures in early to mid-February to positive 500-hPa height anomalies, southerly flow, and above normal temperatures in place during the second half of the month. Above normal temperatures are likely across most of the northern CONUS and southward over the central CONUS into Northern Texas, consistent with dynamical model probability forecasts for the full month from the GEFS and CFS. Probabilities for above normal temperatures exceed 70 percent for most of the Northern Plains. Near normal temperatures are favored for parts of the Southwest, where temperatures are likely to be near-to-below normal early in the month and near-to-above normal later in the month, as forecast by the GEFS. Near normal temperatures continue to be favored for coastal areas of the Southeast, including the Florida Peninsula, where decadal temperature trends are positive, while negative temperature anomalies are correlated with El Niño conditions.
Precipitation
The February outlook favors above normal precipitation for the southern coast of Mainland Alaska, supported by dynamical model forecasts for later in February and correlations with El Niño conditions. Below normal precipitation is favored for the Pacific Northwest and across much of the Midwest and Northeast, consistent with canonical impacts of El Niño and recent CFS dynamical model forecasts for February. A high probability of above normal precipitation, exceeding 60 percent in some areas, is forecast in the February outlook for much of Southern California, Nevada, and western Arizona, supported by model predictions of substantial precipitation for the first week of the month, that may exceed the climatological threshold for above normal precipitation amounts for February [Author’s Note: In Week one they expect more than what would be above nomal for the month] . Above normal precipitation is favored eastward across the Southwest, and northeastward into the Central Plains, as far north as Wyoming and South Dakota, with enhanced probabilities of precipitation during the first half of February. Probabilities for above normal precipitation exceed 50 percent for parts of the Central Plains, where climatological precipitation amounts are relatively low and may be exceeded early in the month. Above normal precipitation is slightly favored for the Southern Plains, where the outlook for the second half of February favors above normal precipitation. Above normal precipitation continues to be favored along the Gulf of Mexico and southern Atlantic coasts, consistent with recent dynamical model forecasts and the impacts of El Niño.
Drought Outlook
Here is the newly issued Drought Outlook for the month.
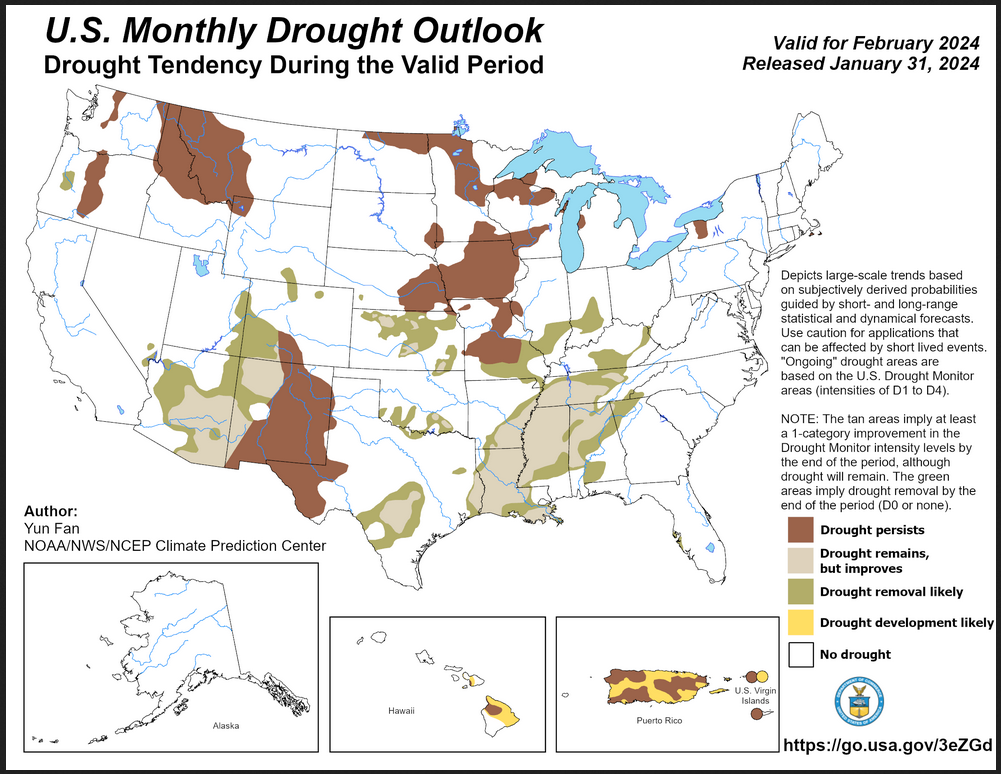
| You can see where drought development or reduction is likely. Overall the forecast is for a significant reduction of drought conditions. The summary and detailed discussions that accompany this graphic can be accessed HERE, but the short version is shown below. |
Here is the short version of the drought summary
Latest Monthly Assessment – During past 30 days, drought has slowly improved (1 to 3 class) across parts of the Pacific Northwest, Four Corners region, Central and Southern Great Plains, Middle and Lower Mississippi Valleys, Tennessee and Ohio Valleys, and parts of the Southeastern contiguous U.S. (CONUS) due to above normal precipitation. Conversely, drought development and intensification was observed across parts of the northern Intermountain West and NorthernHigh Plains, and parts of northwestern Arizona due to below normal precipitation.
Looking forward through the end of February, slow improvements are forecast to continue across parts of western Oregon, given the wet time of year and favorable precipitation and temperature outlooks through at least the first half of the month. However, much of the Pacific moisture flow is not likely to go far enough inland to make a meaningful impact on existing drought in the interior Pacific Northwest and northern Intermountain West, where drought is favored to persist. Ongoing drought conditions are expected to ease a bit in parts of the Southwest where precipitation chances are high through most of February. However, even though above normal prediction is favored in the updated CPC monthly outlook, persistence is likely for the remainder of New Mexico due to February being a rather dry time of year. The Central Great Plains will likely remain a battleground, with mixed persistence and improvement. Meanwhile, improvements are most likely in the southern Plains and persistence is favored in the northern Plains. A cold time of year and lack of wet signals in the monthly outlook make drought persistence the most likely outcome across much of the Midwest, except parts of the southern region where improvements are likely due to above normal heavy precipitation during the past week. Near to above normal precipitation is expected across the Southeast, favoring further improving drought conditions across the region. Persistence is forecast for the existing drought over the Northeast due to unfavorable precipitation outlooks through the end of February. Alaska is forecast to remain drought-free through the end of February, with wet antecedent conditions and favorable precipitation outlooks for much of the state throughout the month. Drought persistence is favored in Hawaii due to forecast below normal precipitation and above normal temperatures, with potential development over currently anomalous dry areas. Also antecedent dryness, El Niño, and unfavorable precipitation outlooks favor drought persistence and development in Puerto Rico and the U.S. Virgin Islands.
We also have an updated Seasonal Drought Outlook (link).
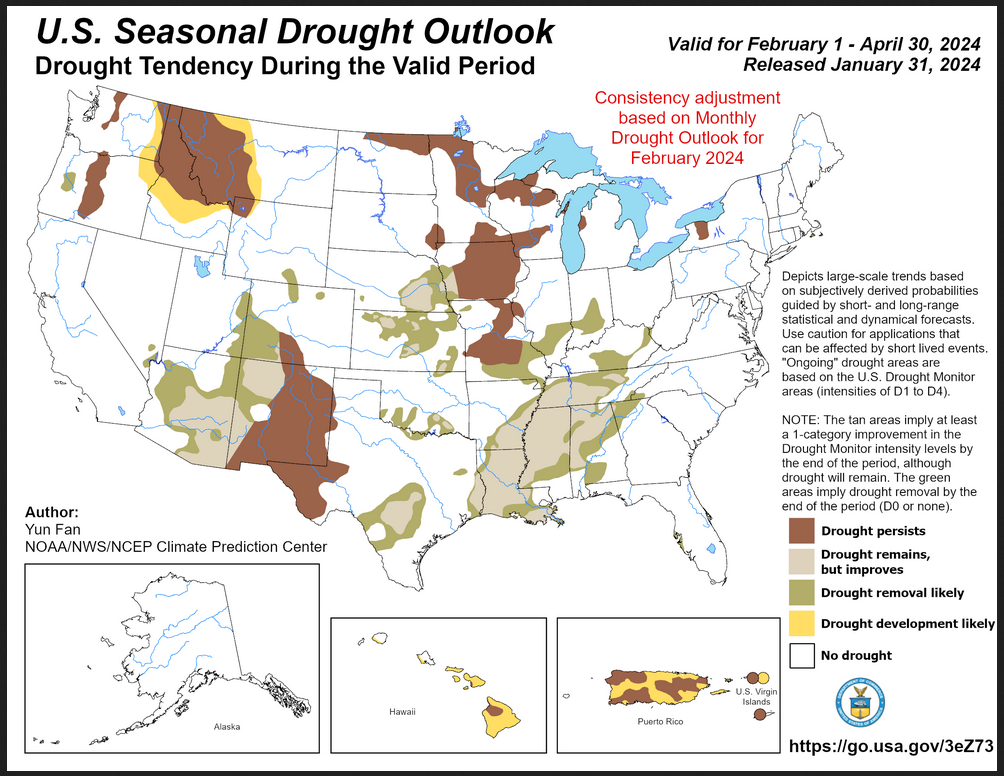
| This three-month outlook is only a bit different than the single-month outlook and it covers a longer period of time. I suspect that the actual situation by the end of April will be a bit better than shown here. |
| To update this forecast (which updates on Tuesdays) click HERE |
Month-to-date Temperature as the current month evolves can be found at https://hprcc.unl.edu/products/maps/acis/MonthTDeptUS.png
Month-to-date Precipitation as the current month evolves can be found at https://hprcc.unl.edu/products/maps/acis/MonthPNormUS.png
CLIMAS Southwest Climate Podcast – They answer some of the questions they have received.
To access the dashboard for this podcast click HERE. You will then have to click on the start arrow to listen to this podcast. It is focused on the Southwest but generally covers more than the Southwest since all regions of the U.S. are interconnected in most cases.
Zack Guido and Mike Crimmins sharpened their pencils, hit the library, and did their homework to bring you a very special MailBag episode of the Southwest Climate Podcast for this month. Thank you to all the listeners for sending in your questions and for trying to stump our hosts. This episode is not to be missed – so grab a cup of coffee and get ready to be schooled before heading off for the end-of-semester break. And have a Happy Holidays from the Southwest Climate Podcast crew!
Mentions:
Question 1: We are based in Northeast New Mexico in the I-25 corridor. What is the predominant drivers of summer weather and precipitation. Are we full-on monsoonal, more influenced by plains state weather patterns, or somewhere in between? Dan
Question 2: There seemed to be an abundance of DCAPE this season, which is perhaps related to all the strong winds and hail we had this monsoon. what is DCAPE? Sarah
Question 3: It seems that an albedo effect after a good snowpack tends to influence/add to a poor monsoon, to some degree, through delayed surface heating… Does that hold any water or stick to the wall? Mark
Question 4: I’m wondering whether there’s a clear “global warming” signal yet in the monsoon? Sarah
- Intensification of the North American Monsoon Rainfall as Observed From a Long-Term High-Density Gauge Network, Demaria et. al. 2019
- Weakening of the North American monsoon with global warming, Pascale et. al. 2017
- Increasing Future Precipitation in the Southwestern US in the Summer and Its Contrasting Mechanism With Decreasing Precipitation in the Spring, Liang et. al. 2022
- The North American Monsoon precipitation response to climate warming at convection-permitting scales, Wallace et. al. 2023
- Future Land Precipitation Changes Over the North American Monsoon Region Using CMIP5 and CMIP6 Simulations, Hernandez et. al. 2022
Question 5: We’re wondering if anyone is studying whether climate change could eliminate the North American Monsoon as we know it and leave Arizona high and dry during the annual monsoon. Bruce & Joanna
Question 6: Like many people in the Tucson area I’m engaged in a lot of outdoor activities, and during monsoon these activities get pushed further up the mountains for temperature reasons. One thing that is always a complicating factor is trying to read the weather pattern to determine whether we’re going to get dumped on or caught in a storm. Some clouds pass right over without a peep, others seem to become a problem quite suddenly. Are there a few tips you can share for how to read the different monsoon clouds? Neal in Tucson
Current snow-water equivalent in the snowpack. This is the water in the snow which hopefully will survive evaporation and sublimation and melt during the Spring. Here is the LINK
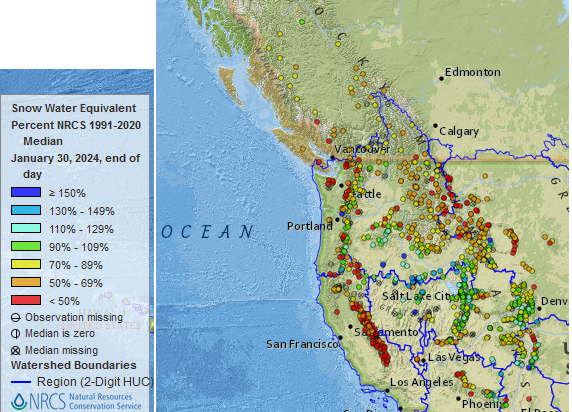
| This provides a very clear picture of the weather pattern since October 1, 2023. The pattern of where there is more snow than normal of snow and where there is less than normal is pretty interesting. |
Fire Outlook (The Site has Moved and I have not figured out how to print images from the new site yet. The link is HERE.
| I hope you found this article interesting and useful |
