Most of the information in this report comes from the monthly email I receive from John Bateman. He does public outreach for NOAA and in particular NCEI. I could find the same information and more on the NCEI website but John produces a good summary so I use it or most of it. I also sometimes add additional information from NCEI or other NOAA websites. The full NCEI report for November can be accessed HERE.

I added the below to what John Bateman provided.

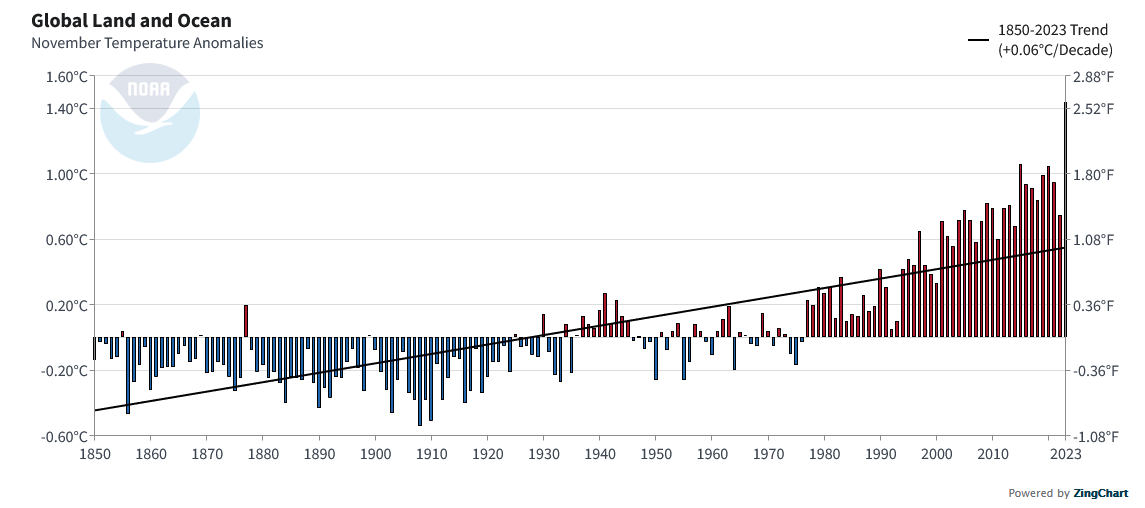
| This November saw a huge jump. Remember this is the data for both land and water. |

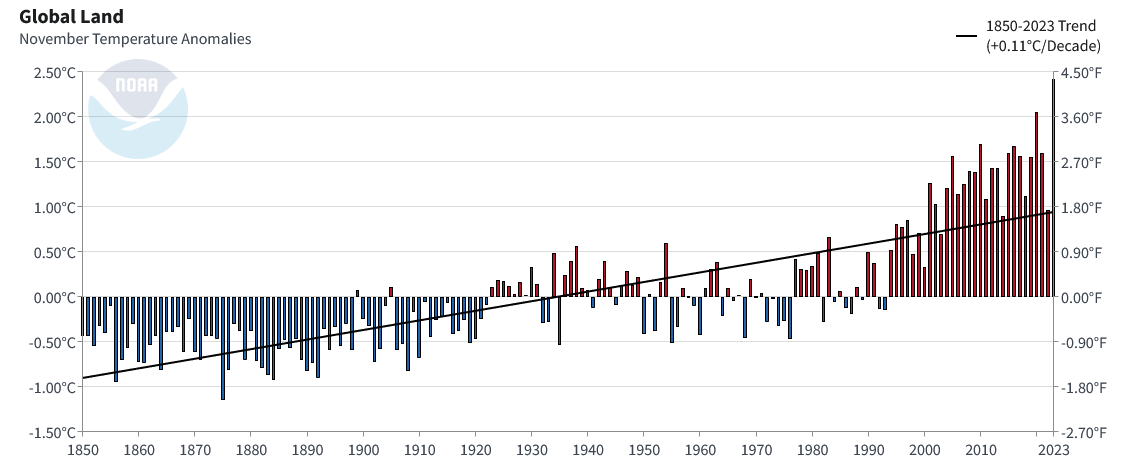
| This looks just at land but the trend is similar. In fact the regression line is even steeper. |

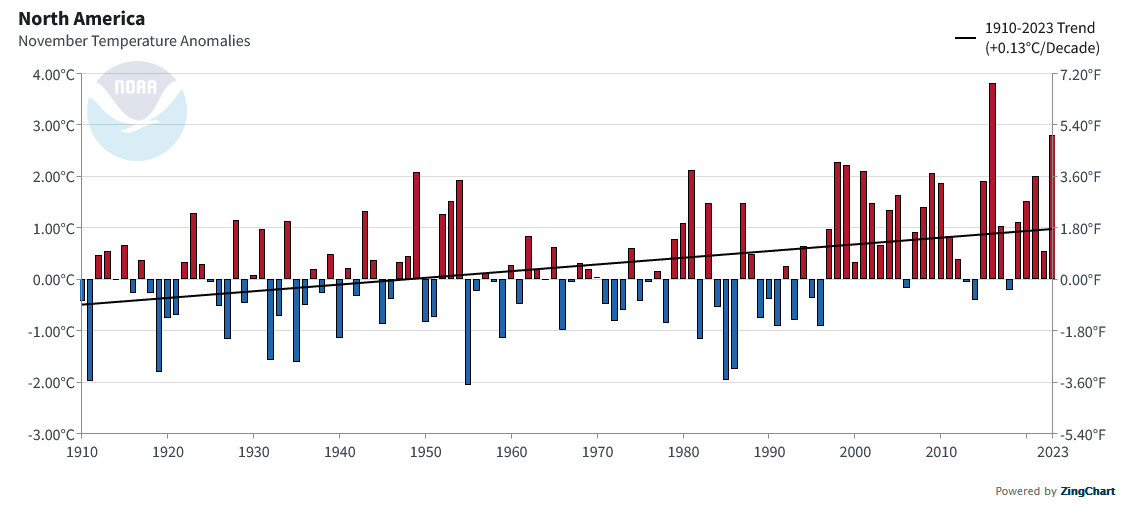
| This is just North America. It is more than just the U.S. and the slope of the regression line is even steeper. But for North America, unlike the world, November did not set a new record. |

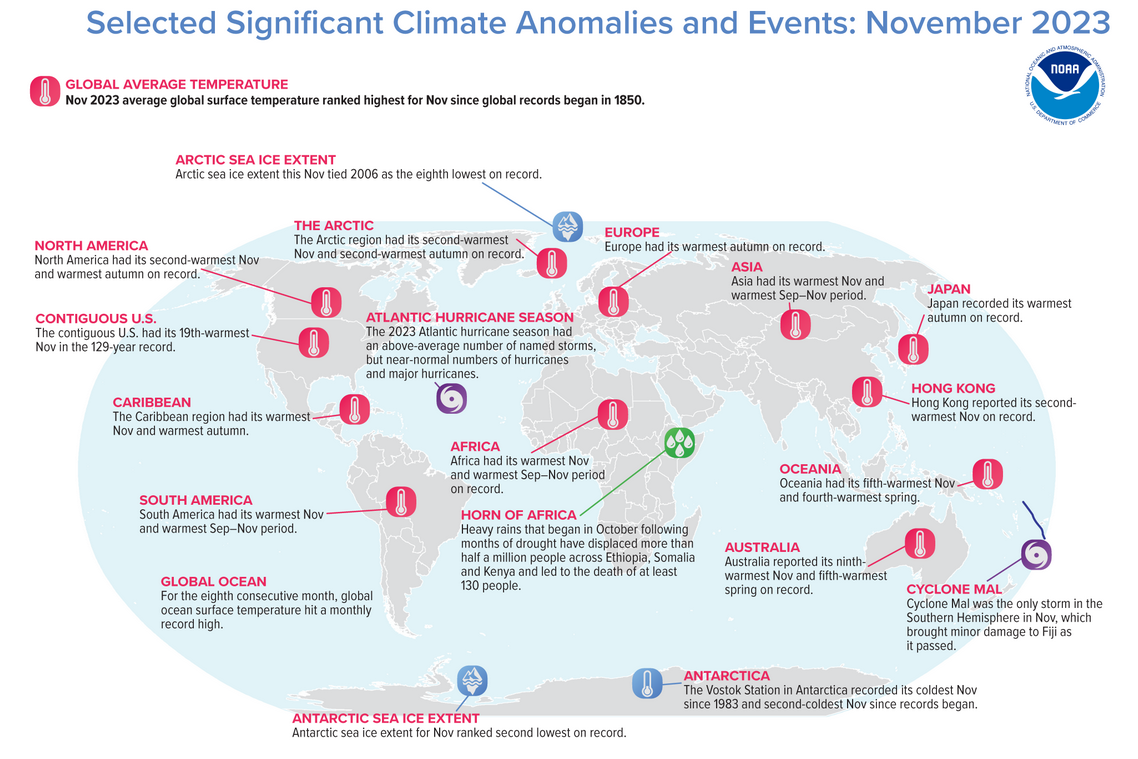
| This shows selected anomalies but it mostly covers temperature around the world. |
Earth had its warmest November
Warmest September-November period on recordContact
John Bateman, john.jones-bateman@noaa.gov, 202-424-0929December 14, 2023
September and Seasonal Highlights:
November marked the sixth record-warm month in a row.
The September–November 2023 global surface temperature ranked as the warmest such period on record, a substantial leap (+0.70°F or +0.39°C) above the previous record from 2015.
There is a greater than 99% chance that 2023 will be the warmest year in NOAA’s 174-year record.
For the eighth consecutive month, global ocean surface temperature set a record high.
With only four named tropical storms across the globe, November 2023 tied for the second-fewest storms on record for November.
Globally, November 2023 was the warmest November in the 174-year NOAA record. The year-to-date (January–November) global surface temperature ranked as the warmest such period on record. November 2023 marked the sixth consecutive month of record-warm global temperatures. According to NCEI’s Global Annual Temperature Outlook and data through November, there is a greater than 99% probability that 2023 will rank as the warmest year on record.
This monthly summary, developed by scientists at NOAA’s National Centers for Environmental Information, is part of the suite of climate services NOAA provides to government, business, academia and the public to support informed decision-making.
Monthly Global Temperature
The November global surface temperature was 2.59°F (1.44°C) above the 20th-century average of 55.2°F (12.9°C) and ranks as the warmest November in NOAA’s 174-year record. This was 0.68°F (0.38°C) above the previous record from November 2015. November 2023 marked the 47th consecutive November and the 537th consecutive month with temperatures above the 20th-century average.
South America, Africa and Asia had their warmest Novembers on record. North America had its second-warmest November while Oceania had its fifth-warmest November. November 2023 in Europe tied 2003 to rank as the 15th warmest on record. The Arctic had its second-warmest November, while November 2023 in the Antarctic region tied 1959 for sixth coldest on record. For the eighth consecutive month, global ocean surface temperature set a record high.
Temperatures were above average throughout most of South America, western and central North America, Africa, western Europe, western, central and southern Asia, Oceania and the Arctic. Parts of northern North America, northern and central South America, Africa and eastern and southern Asia experienced record-warm temperatures this month. Sea surface temperatures were above average across much of the northern and western Pacific as well as the central and southern Atlantic and the western Indian Oceans. Record-warm temperatures covered nearly 13% of the world’s surface this November, which was the highest percentage for November since the start of records in 1951.
Temperatures were near to cooler than average across much of Antarctica as well as across parts of eastern North America, northern Europe, southern South America and central-eastern Asia. Sea surface temperatures were near to below average over parts of the southeastern Pacific Ocean, the eastern Indian Ocean and the northern Atlantic Ocean. Less than 1% of the world’s surface had a record-cold November.
Snow Cover and Sea Ice Extent
November 2023 global sea ice extent ranked second lowest on record for the month at 9.24 million square miles, which was about 800,000 square miles below the 1991–2020 average. After six months of record-low sea ice extent in the Antarctic, this month’s sea ice extent also ranked second smallest on record for the region.
The Arctic sea ice extent for November 2023 tied 2006 as the eighth smallest in the satellite record at 3.73 million square miles. This was 190,000 square miles below the 1991–2020 average. Meanwhile, the Antarctic saw its second-smallest November sea ice extent on record at 5.51 million square miles, or 620,000 square miles below the 1991–2020 average.
According to data from NOAA and analysis by the Rutgers Global Snow Lab, the Northern Hemisphere snow cover extent during November was 210,000 square miles above the 1991–2020 average. This ranks as the 17th-largest Northern Hemisphere snow cover extent for November. Extent was near normal in North America and slightly above average across Eurasia.
Global Precipitation
Tropical rainfall patterns mainly followed typical El Niño patterns, with floods and landslides in east Africa and parts of South America, and continued drought across the Amazon in South America. The warmest November also brought the wettest November global precipitation estimate on record, with an intense band of rainfall across the planetary Intertropical Convergence Zone region. While Europe experienced another month with above-average precipitation, further relieving earlier drought conditions there, the southern U.S. remained mostly dry despite El Niño patterns typically associated with positive precipitation anomalies in that region.
Global Tropical Cyclones
Four named storms occurred across the globe in November, which tied for the second fewest in November since 1981. One of those reached tropical cyclone strength (≥74 mph), and none reached major tropical cyclone strength (≥111 mph). The global accumulated cyclone energy, an integrated metric of the strength, frequency, and duration of tropical storms, was less than 20% of the 1991–2020 average for November. No storms were active in the Atlantic, which happens about once every three Novembers. The 2023 Atlantic hurricane season, which officially ends on November 30, had an above-average number of named storms (20) but near-average numbers of hurricanes (seven) and major hurricanes (three).
Seasonal Global Temperature
The September–November 2023 global surface temperature was 2.54°F (1.41°C) above the 20th-century average of 57.1°F (14.0°C). This ranks as the warmest September–November period in the 174-year record, and 0.70°F (0.39°C) above the previous record from 2015. The past 10 September–November periods are the 10 warmest such periods on record. The September–November 2023 global surface temperature departure from average also marks the highest seasonal temperature anomaly on record.
The September–November period is defined as the Northern Hemisphere’s meteorological autumn and the Southern Hemisphere’s meteorological spring. The Northern Hemisphere autumn 2023 temperature was the highest on record at 3.44°F (1.91°C) above average. The Southern Hemisphere spring temperature also ranked highest on record at 1.66°F (0.92°C) above average.
North America, Europe, South America, Africa and Asia had their warmest September–November periods on record. Meanwhile, the spring season in Oceania ranked fourth warmest on record. The Arctic experienced its second-warmest autumn and the Antarctic region had its 12th-warmest spring on record.
For a more complete summary of climate conditions and events, see our November 2023 Global Climate Report or explore our Climate at a Glance Global Time Series.
Climate, weather, and water affect all life on our ocean planet. NOAA’s mission is to understand and predict our changing environment, from the deep sea to outer space, and to manage and conserve America’s coastal and marine resources. See how NOAA science, services, and stewardship benefit your community: Visit noaa.gov for our latest news and features, and join us on social media.
Resources
https://www.ncei.noaa.gov/access/monitoring/monthly-report/global/202311
https://www.ncei.noaa.gov/access/monitoring/monthly-report/national/202311
https://www.ncei.noaa.gov/access/monitoring/climate-at-a-glance/global/time-series/globe/land_ocean/1/11/1850-2023
https://www.ncei.noaa.gov/access/monitoring/climate-at-a-glance/national/time-series
–
| I hope you found this article interesting and useful. |
–


