On the second Thursday of every month, NOAA (really their Climate Prediction Center CPC) issues its analysis of the status of ENSO. This includes determining the Alert System Status. NOAA again describes their conclusion as “ENSO Alert System Status: El Nino Advisory”
There is not much doubt that we have an El Nino. How long it lasts and its strength remains to be seen. NOAA may be more conservative compared to some other Weather Advisory Organizations. Some of the other Weather Advisory Organizations are predicting a higher probability for a “Historically Strong” El Nino. I personally believe that this El Nino will be somewhat of an underachiever. We will be finding out over the next two months.
We have included a link to an interesting ENSO Blog article by Emily Becker.

CLIMATE PREDICTION CENTER ENSO DISCUSSION

| The second paragraph is what is important:
” The most recent IRI plume favors El Niño to continue through the Northern Hemisphere winter 2023-24. Based on the latest forecasts, there is now a 54% chance of a “historically strong” El Niño during the November-January season (³ 2.0°C in Niño-3.4). An event of this strength would potentially be in the top 5 of El Niño events since 1950. While stronger El Niño events increase the likelihood of El Niño-related climate anomalies, it does not imply expected impacts will emerge in all locations or be of strong intensity (see CPC seasonal outlooks for probabilities of temperature and precipitation). In summary, El Niño is expected to continue through the Northern Hemisphere winter, with a transition to ENSO-neutral favored during April-June 2024 (60% chance;).” Below is the middle paragraph from the discussion last month. We see that this month there is an increased chance of a “historically strong” event. “The most recent IRI plume favors El Niño to continue through the Northern Hemisphere spring 2024. Based on latest forecasts, there is a greater than 55% chance of at least a “strong” El Niño (³ 1.5°C in Niño-3.4 for a seasonal average) persisting through January-March 2024. There is a 35% chance of this event becoming “historically strong” (³ 2.0°C) for the November-January season. Stronger El Niño events increase the likelihood of El Niño-related climate anomalies, but do not necessarily equate to strong impacts (see CPC seasonal outlooks for probabilities of temperature and precipitation). In summary, El Niño is anticipated to continue through the Northern Hemisphere spring (with a 62% chance during April-June 2024.” |
We now provide additional detail but I am keeping this article shorter than usual because nothing much has changed since last month.
CPC Probability Distribution
Here are the new forecast probabilities. The probabilities are for three-month periods e.g. OND stands for October/November/December.
Here is the current release of the probabilities:
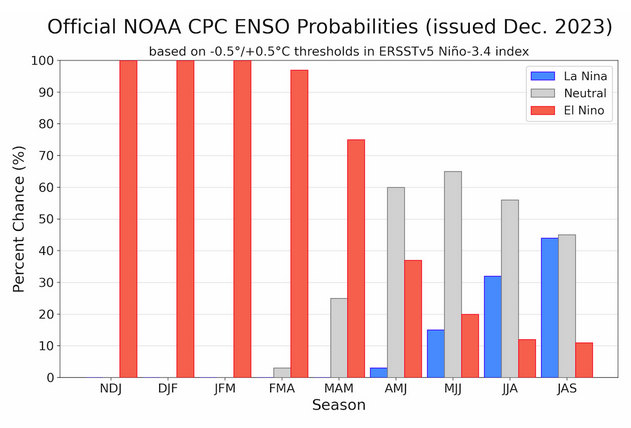
| You can clearly see the forecast does not extend beyond JAS 2024 and one does see a tail-off in the probabilities for El Nino conditions in the Eastern Pacific after the winter season. Is a return to La Nina in our future? |
Here is the forecast from late last month.

| The analysis this month and last month are pretty similar. |
What Does the NOAA Proprietary ENSO Model Forecast?
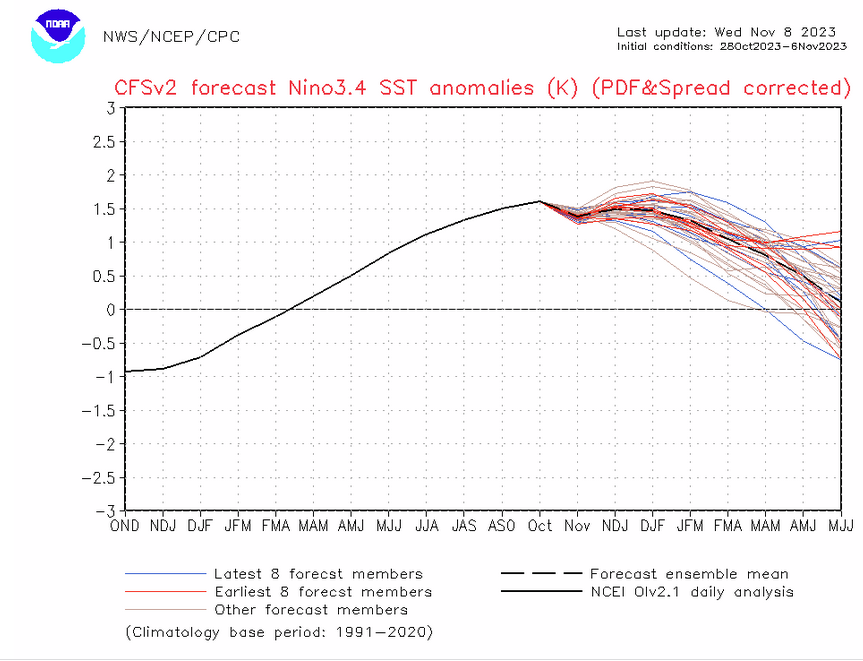
| This model shows the scatter in the forecasts and the El Nino peaking right now and not rising above 1.5C. The dark dashed line is the mean of the ensemble forecasts. If you want to see an updated version you can view an updated version by clicking HERE. So this is different from the official CPC forecast and seems quite odd actually. |
View of other Models.

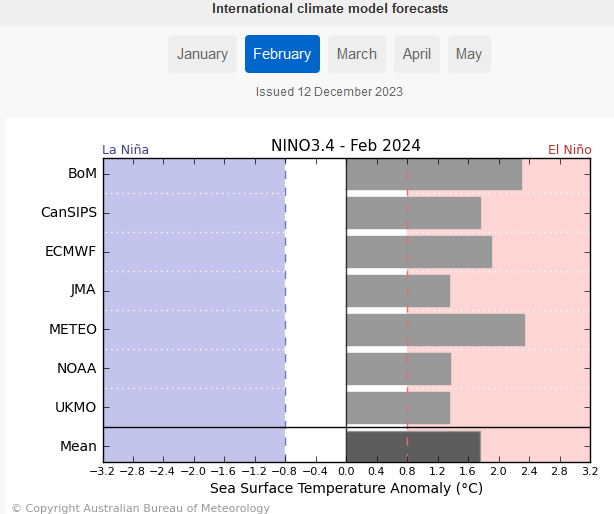
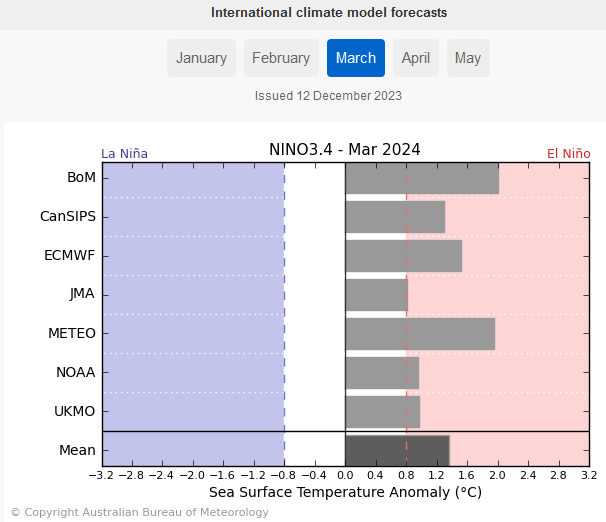
| The NOAA forecast for the strength of the NINO 3.4 Index in January of 2024 is now more in line with the others in this small collection of model results prepared by the Australian Bureau of Meteorology. Notice the forecasted rapid drop off of the Nino 3.4 Index through March of 2024. I do not think this El Nino will end up being in the top 5 El Ninos since 1950. I think it is somewhat overrated but we will see. |
Looking at Actual Current Conditions.
NOAA reports some derived data that describes the current situation and a forecast. But what if we want to form our own opinion? After all, meteorologists are looking at the actual current situation and making predictions.
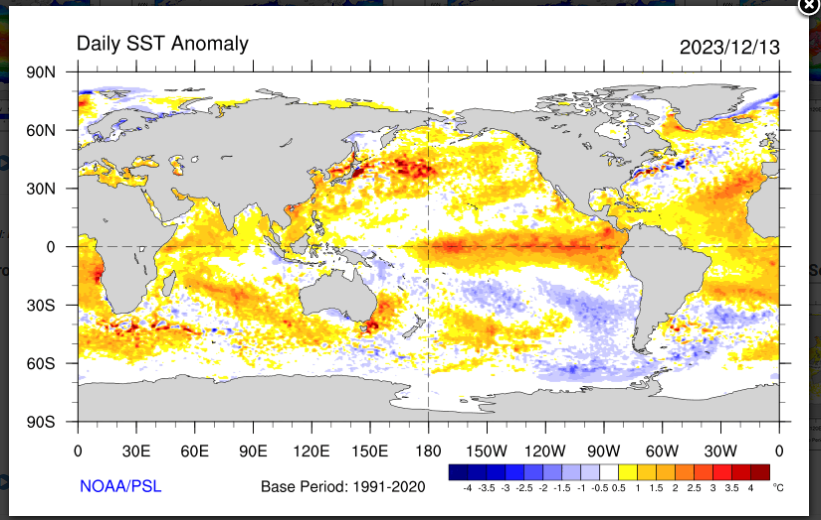
This shows the current actual situation for the surface of oceans. To update this graphic click HERE.
Here is what it looked like last month.
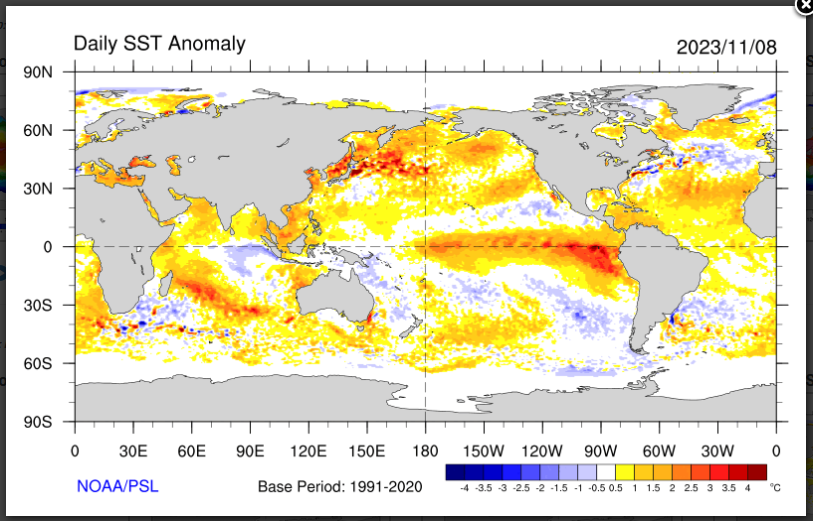
| You can see the warm tongue of water extending from Ecuador and Peru. The cold currents moving up the western side of South America are strong this month. We are discussing ENSO tonight but you can see a lot of interesting things here. It is only a one-day snapshot so keep that in mind. |
Putting the historical information in motion. Updates can be found HERE. but should not be needed.

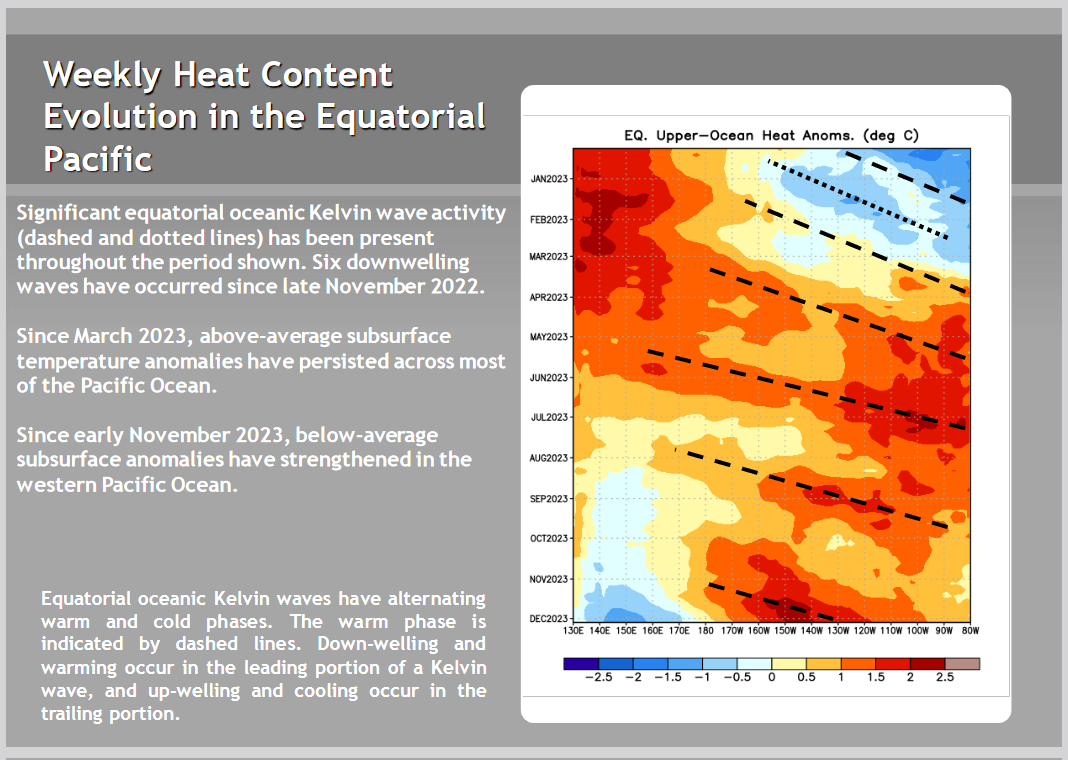
Now we look at the below surface temperature anomalies. Mapping the details. (Cross-Section along the Equator). The data is a five-day average centered on the date shown.
Here is the new map followed by the prior two graphics and this is not much change. There is actually less undercutting of the warm anomaly from the west further suggesting that El Nino will be around for a while. But the intrusion of cool water (the blue) is interesting.
![]()

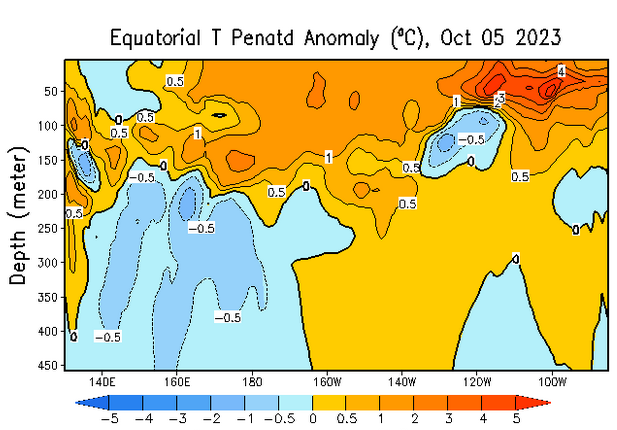
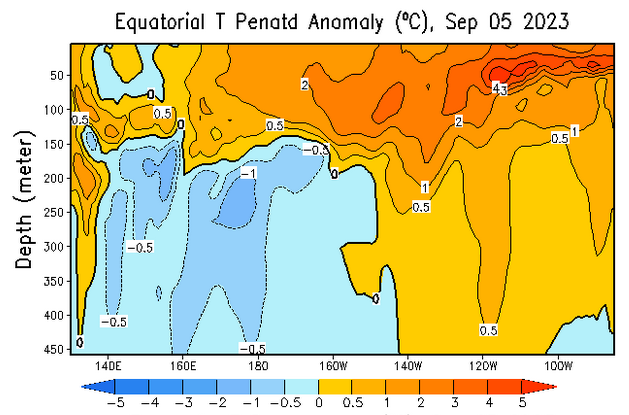
| There is a lot of warm water on the surface and below it. But the Indo-Pacific Warm Pool is pretty much spent. This raises some questions in my mind. |
Another Kelvin Wave will maintain or increase the Nino 3.4 Index at least in the short term
Is the response of the atmosphere sufficient to sustain an El Nino?

| The recent rise in the SOI may mean the atmosphere is not fully responding to the warmer sea surface temperatures. That is not talked about very much. The SOI is now in ENSO Neutral territory. |
We are including the Emily Becker Article this week.
December 2023 El Niño update: adventure!
Sail across the Pacific
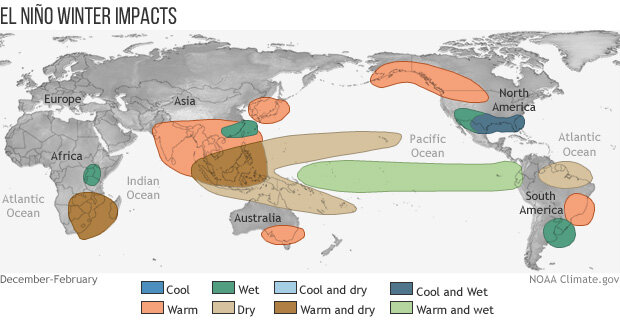
El Niño is associated with specific changes to weather and climate around the world, and the stronger an El Niño, the more likely we are to see those impacts. Of course, nothing is ever guaranteed when it comes to our complex Earth system, and the unpredictable effect of chaos may interrupt the expected impacts. For an excellent, in-depth explanation of why a strong El Niño provides the best information for making seasonal predictions, and yet weather can still upend those predictions, check out Nat’s recent post.
Our primary metric for the strength of an ENSO event (ENSO = El Niño/Southern Oscillation, the whole El Niño and La Niña system) is the three-month-average temperature of the central tropical Pacific Ocean, specifically in the Niño-3.4 region. The temperature anomaly—the difference from the long-term average, where long-term is currently 1991–2020—in this region is called the Oceanic Niño Index (ONI). We use a three-month average because ENSO is a seasonal phenomenon, meaning it persists for at least several months. We don’t have official strength definitions, but, unofficially, an ONI anomaly of 1.5 °C or warmer is considered a strong El Niño, with 2.0 °C the threshold for “very strong” or “historically strong.”
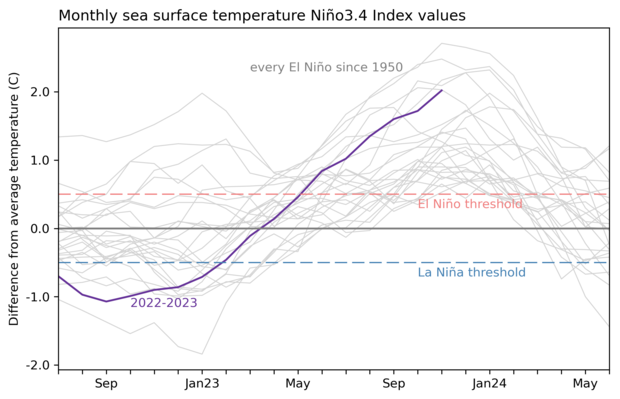
The most recent ONI anomaly, for September–November, was 1.8 °C. November, what I’m showing here in this graph, was 2.0 °C. Many of our computer models predict that it will hang out at or above 2.0 °C long enough to achieve “historically strong” status.
Sky dive
El Niño is more than sea surface temperature, though. The atmospheric component is just as important, as the atmospheric circulation above the tropical Pacific—the Walker circulation—responds to the changes in the ocean surface temperature and helps to reinforce them. This atmosphere-ocean coupling is critical to ENSO. In the case of El Niño, the warmer-than-average central and/or eastern tropical Pacific leads to more rising air and storms over that region, less over Indonesia, and weaker-than-average upper-level winds and near-surface winds (the trade winds). Overall, this means a weaker Walker circulation.
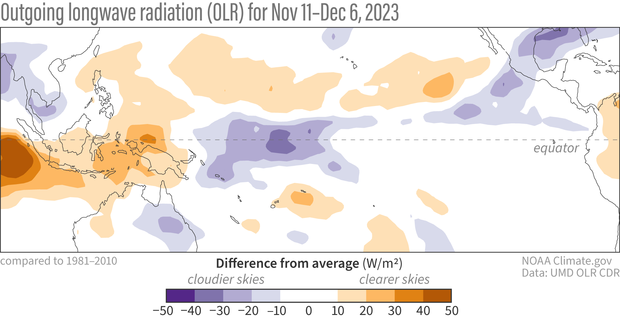
Outgoing long-wave radiation anomaly from November 11 – December 6, 2023. Regions with more clouds and rain than average are shown in blue; areas with fewer clouds and less rain are shown in orange. Climate.gov image from CPC data.
So how is the atmosphere looking, with our current strong, possibly on its way to very strong, El Niño? Looking at the map above, we see a pretty clear signal over the past 30 days of more clouds over the central Pacific (purple, showing that less surface radiation is escaping to space, because it’s being blocked by clouds) and less over Indonesia (orange, where more radiation is making it to the satellites, because there are fewer clouds).
| Wow. Emily Becker really wrote a great blog post. |
| I hope you found this article interesting and useful. |