Much of the information in this article comes from the monthly email I receive from John Bateman. He does public outreach for NOAA and in particular NCEI. I could find the same information and more on the NCEI website but John produces a good summary so I use it or most of it. I also sometimes add additional information from NCEI or other NOAA websites. John Bateman sends me two emails. One on the World situation and one for the U.S. One of the things I like to add to what John Bateman sends me is the state ranking maps. These maps show how temperature and precipitation for each state rank relative to the 129 years of what is considered to be the most reliable data we have.
This article is about November 2023 in the U.S.


This trend analysis comes from Climate at a Glance also from NCEI

| This is the U.S. November temperature trend. This past November was by no means a record but it was above the trend line. It was a relief in a way as some recent months have been much above trend and record breakers so the factors that were causing that may have been short-term but in any event did not show up this November. I will compare this to the world trend in a future article. |
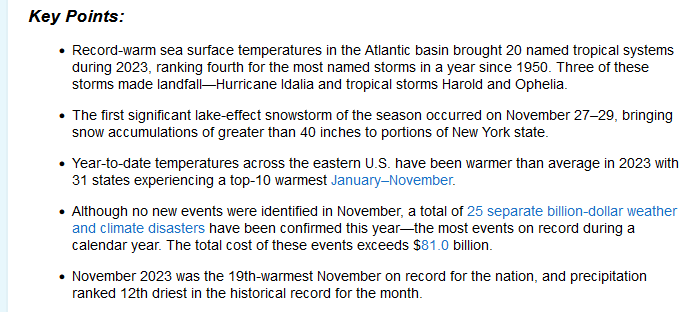
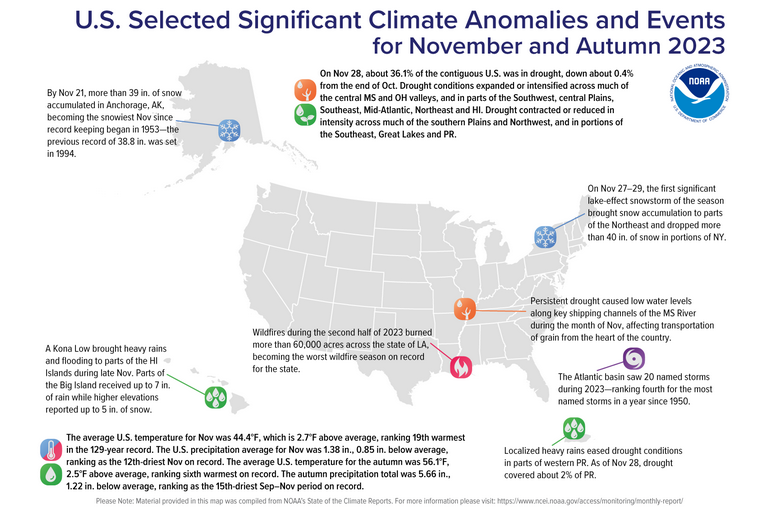
Now I will present the information provided by John Bateman with one additional graphic also from NCEI plus the state ranking maps.
 Now let us take a look at the state rankings which is where the data for each state fits within the 129 years of data in this series.
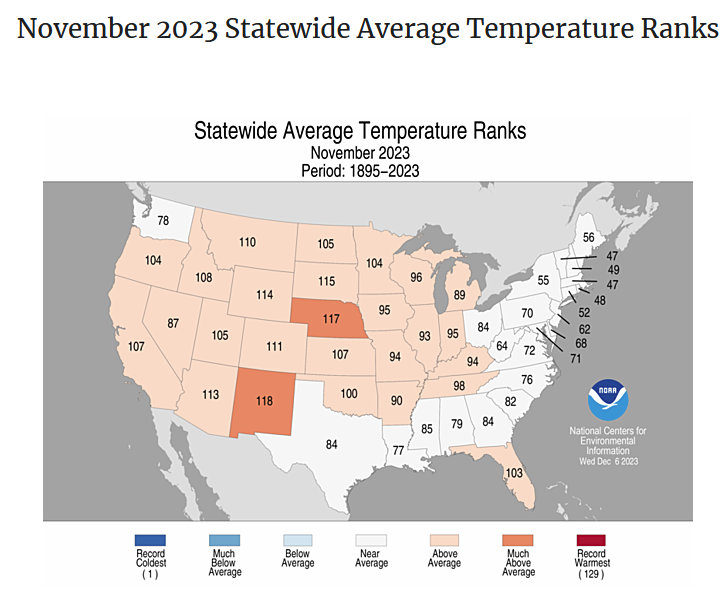
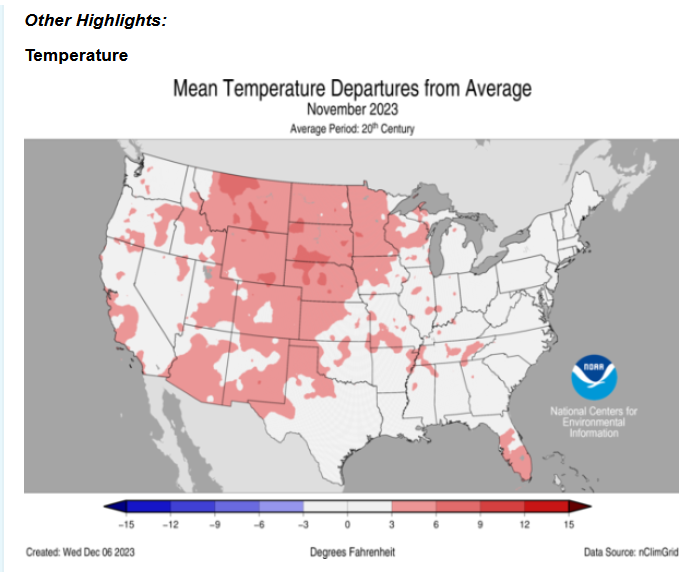
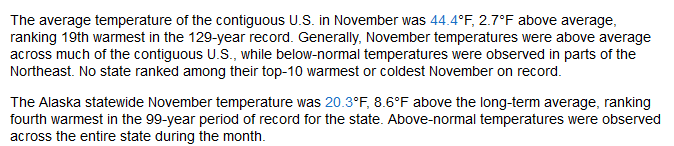
| No temperature records were broken in November. But many states had much above normal daily average temperatures. [It can be confusing as for this purpose one is looking at all the weather stations in each state. You look at the average daily temperature at each weather station and then average those for the state. At least that is what I think they are doing. They do not do a great job of explaining the methodology.] |
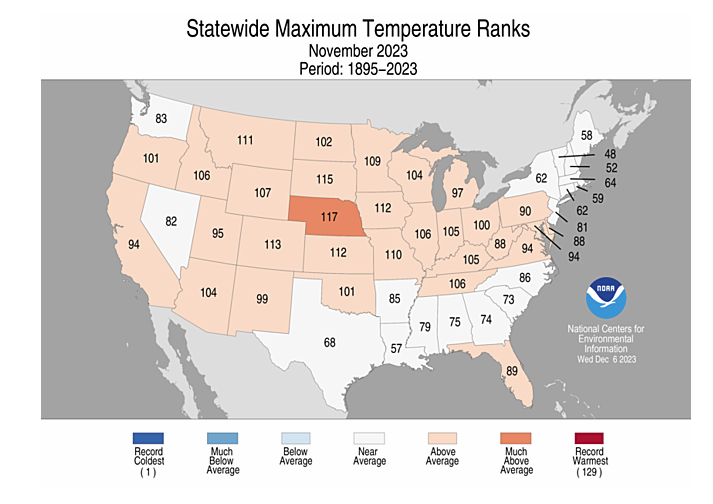
| When you look at the (mean) maximum temperatures the picture is slightly cooler at least in some states. |
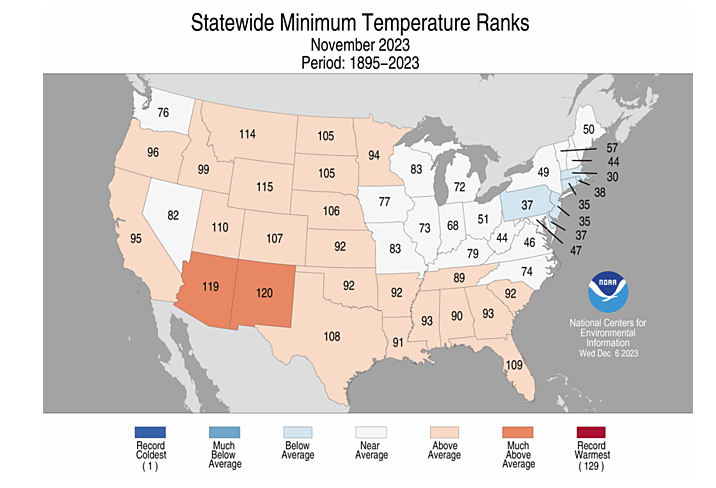
| Minimum temperatures provide a very different picture. The regional distribution of (mean) minimum temperatures is very different than for the average and maximum temperatures. Pennsylvania is a good example. The (mean within the state) maximum temperature was in the high range for the 129-year history for that state while the (mean within the state) low temperature was in the low end of the range. The average temperature was in the middle of the range for the 129-year history. |
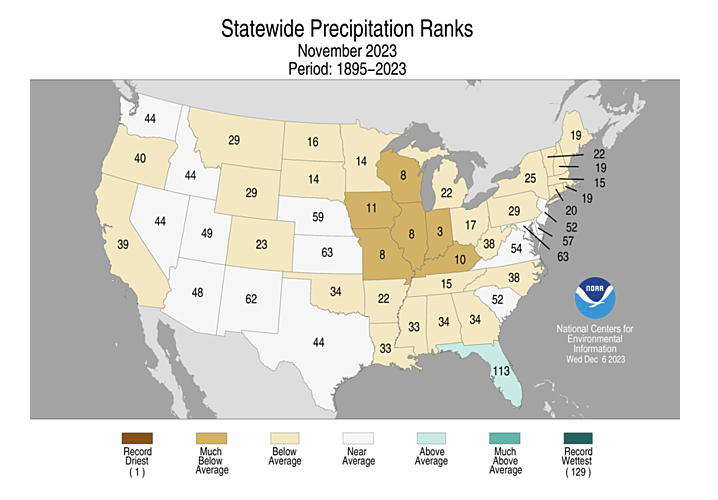
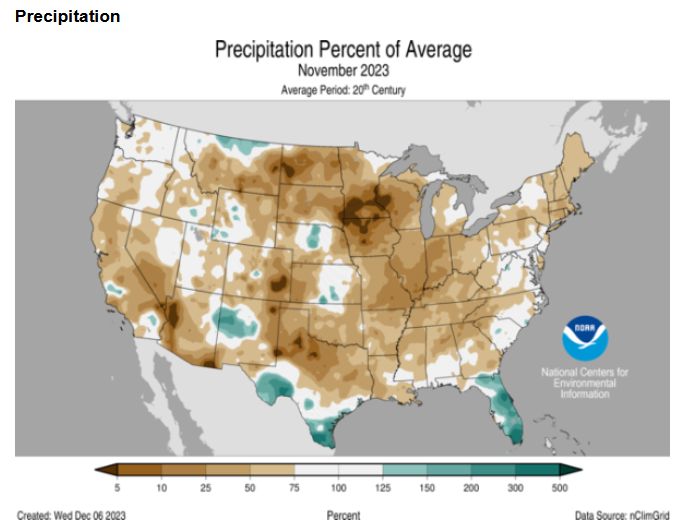
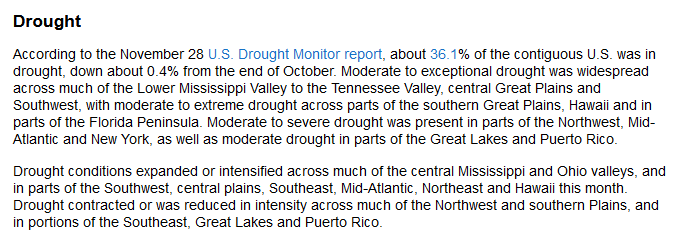
| Overall it was dry but Florida was above average. You can see where precipitation was much below average. |
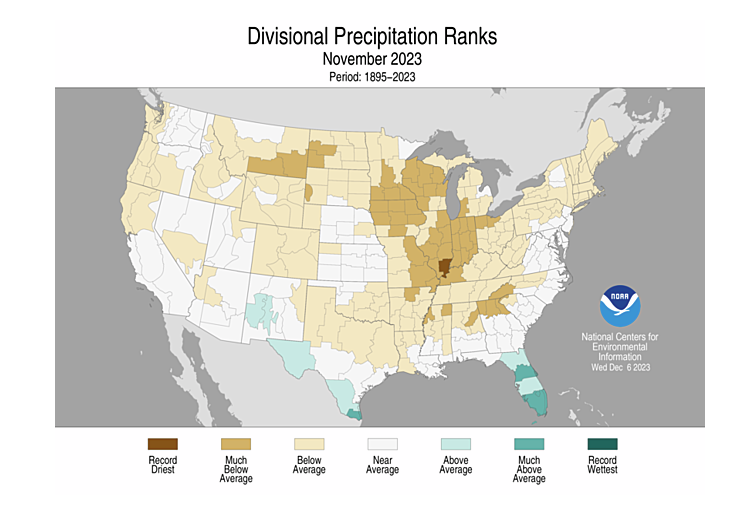
| Sometimes looking at the rankings by climate divisions sheds additional light on the subject. You can more precisely see the dry and wet areas this way. We see a climate division in Illinois that set a record for the driest in its 129-year modern history. And take a look at the variation throughout Florida. |
Resources
https://www.ncei.noaa.gov/access/monitoring/monthly-report/national/202311
https://www.ncei.noaa.gov/access/monitoring/climate-at-a-glance/national/time-series
This monthly summary from NOAA’s National Centers for Environmental Information is part of the suite of climate services NOAA provides to government, business, academia and the public to support informed decision-making. For more detailed climate information, check out our comprehensive November 2023 U.S. Climate Report scheduled for release on December 13, 2023. For additional information on the statistics provided here, visit the Climate at a Glance and National Maps webpages.
–
| I hope you found this article interesting and useful. |
–