I am just providing a report from NCA5. I am providing the full report but you can access it HERE and then there will be live links that you can click on for additional information. There is a lot more in that report than these 10 Maps but they feature these 10 Maps as sort of a summary of the key points in that report. I have added some comments to each map to perhaps help interpret these 10 Maps but I have not read the full report so I may not understand enough to fully interpret them. But I will do my best. It appears to me that this set of 10 maps is intended to entice people to read the chapter or chapters where the material is presented in more depth.
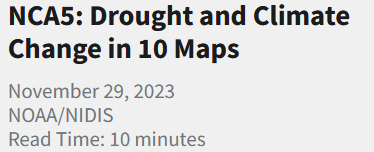


| Soil moisture is very important. These are results from computer models. I would pay the most attention to the large map. Basically, it is saying that it may be wetter but warmer temperatures will tend to produce less soil moisture which is not good. It is not clear to me how they derive the wet and dry scenarios shown on the right. Of great interest is the Mississippi River Valley where the range of projections is very wide but they average out to considerable drying of soil. |
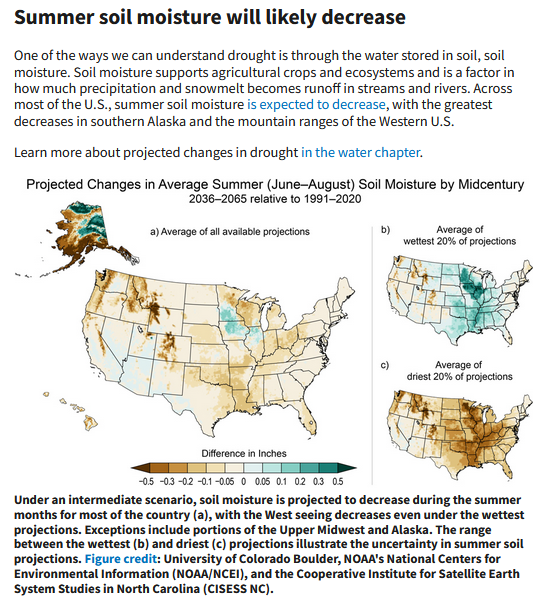
| Evapotranspiration is the combination of moisture that evaporates and moisture that plants transpire as they exchange water for the carbon they need to grow. If it is warmer and there is water to evaporate it will. So the area shown in green is not necessarily a good thing. If you have less water, there is less to evaporate and less for plants to transpire. I would tend to be skeptical of these results as climatologists are not always good biologists. I have not read the chapter so I can not say more but the ecosystem will attempt to adapt to the warmer temperatures. |
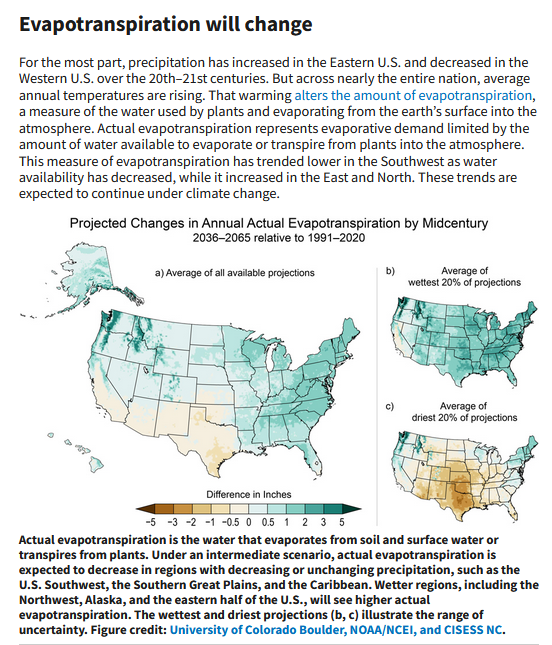
| I would pay the most attention to maps 1 and 3 reading from left to right. |
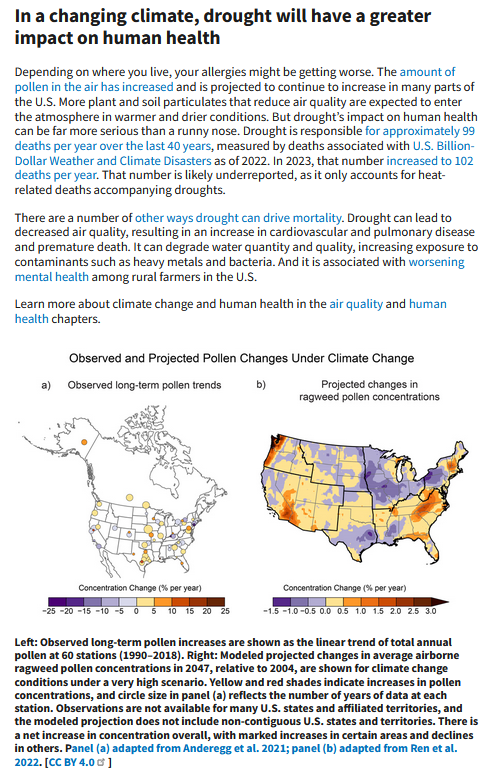
| This is pretty interesting. Some places may have higher risks for allergies while others may have less. |
| It is amazing what you can do with data. |
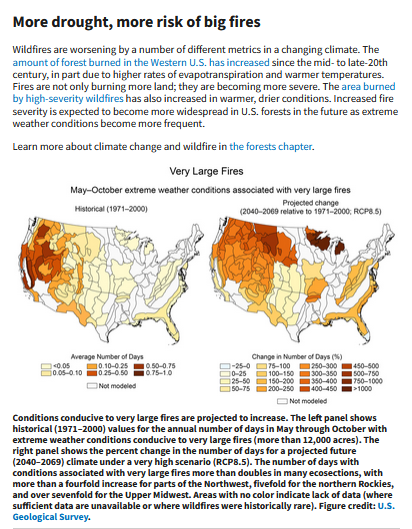
| We have observed an increase in wildfires. This is another complex topic where biology enters in. When it is dry you have wildfires. When it rains it creates fuel for wildfires. Insect damage enters in. I assume all of this is addressed in the full set of documents. It is clearly a problem. |
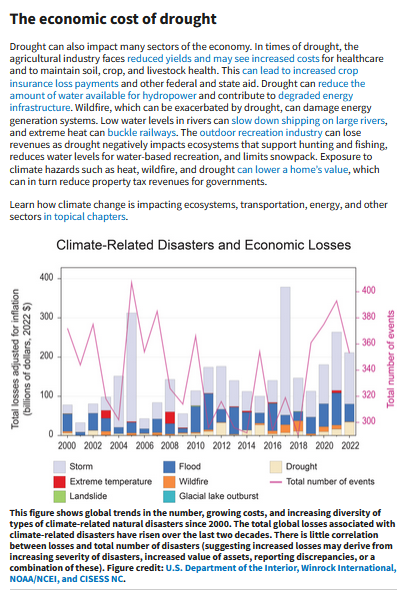
| I would not call this graphic a map but it has a lot of information. |
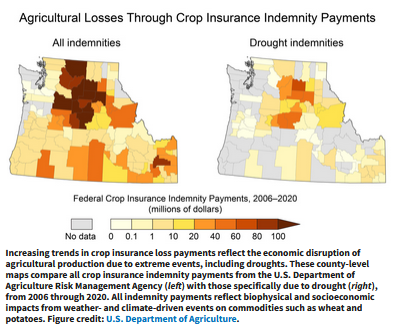
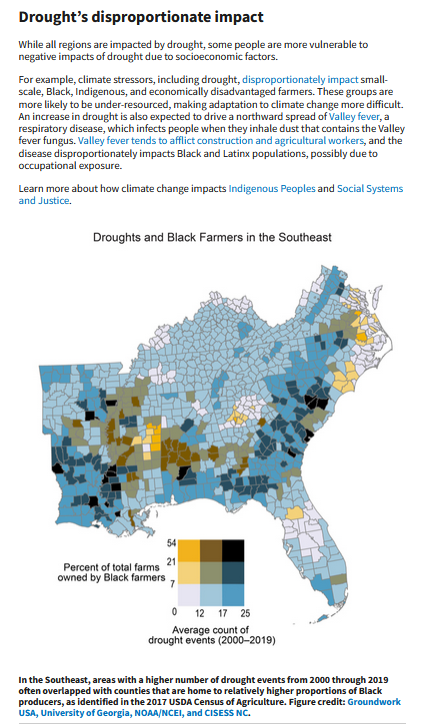
| We have seen the impact of drought on dry farming of wheat in particular and also how it has impacted ranchers who need supplemental feed. |
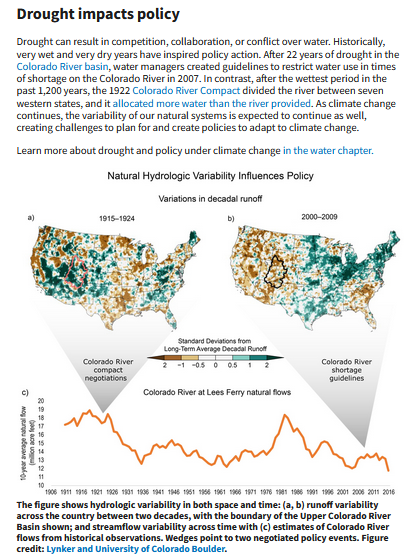
| Would I be out of line to mention that cloud seeding can be helpful for the Colorado River Basin and also the Rio Grande? |
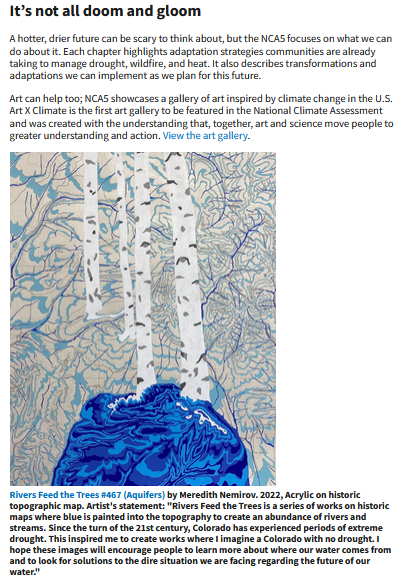
| I am not so sure that art can substitute for food but I am sure the art gallery is worth looking at. |
–
| I hope you found this article interesting and useful. |
–