We are at the point now where crop progress may not be what is of most interest. The monthly Agricultural Statistics Board Briefing (It used to be called an Executive Briefing) may be more useful. The full Briefing can be accessed HERE. It is simply too long for me to snip that many images and publish them. What I have done instead is select certain images that will be of most interest and present them instead of the usual crop Progress Report. But I have included a link to the statistical part of the Weekly Crop Progress Report so that is also available to readers.
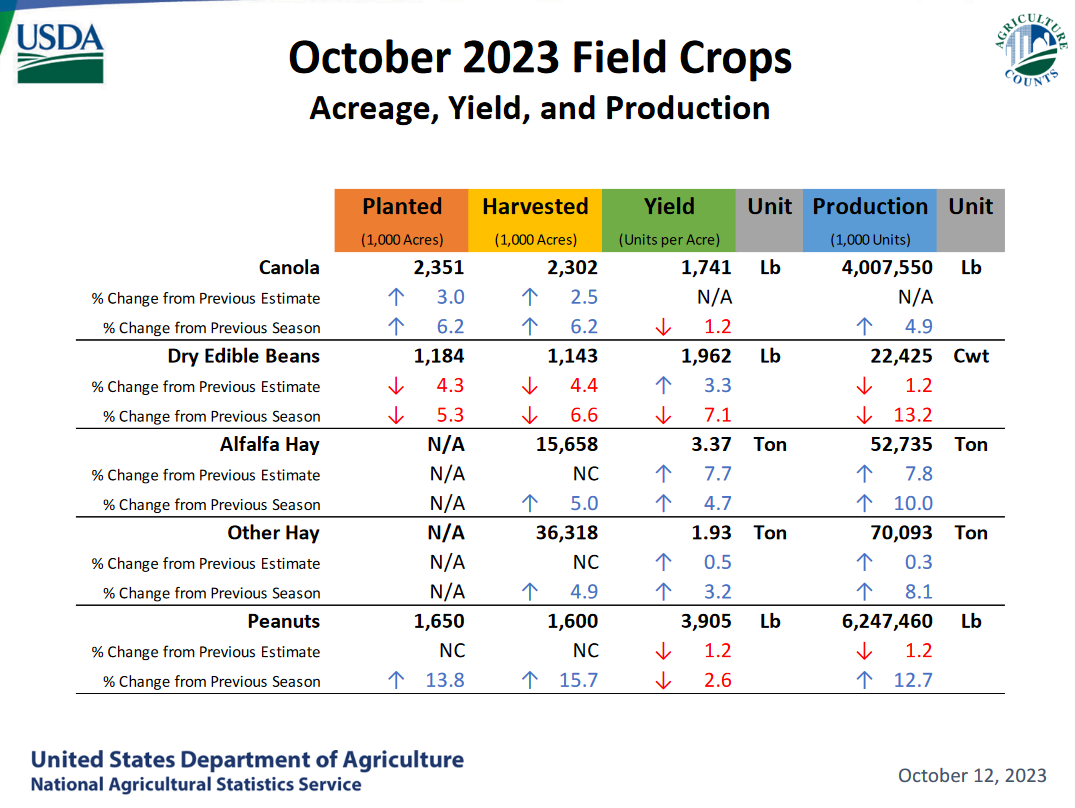
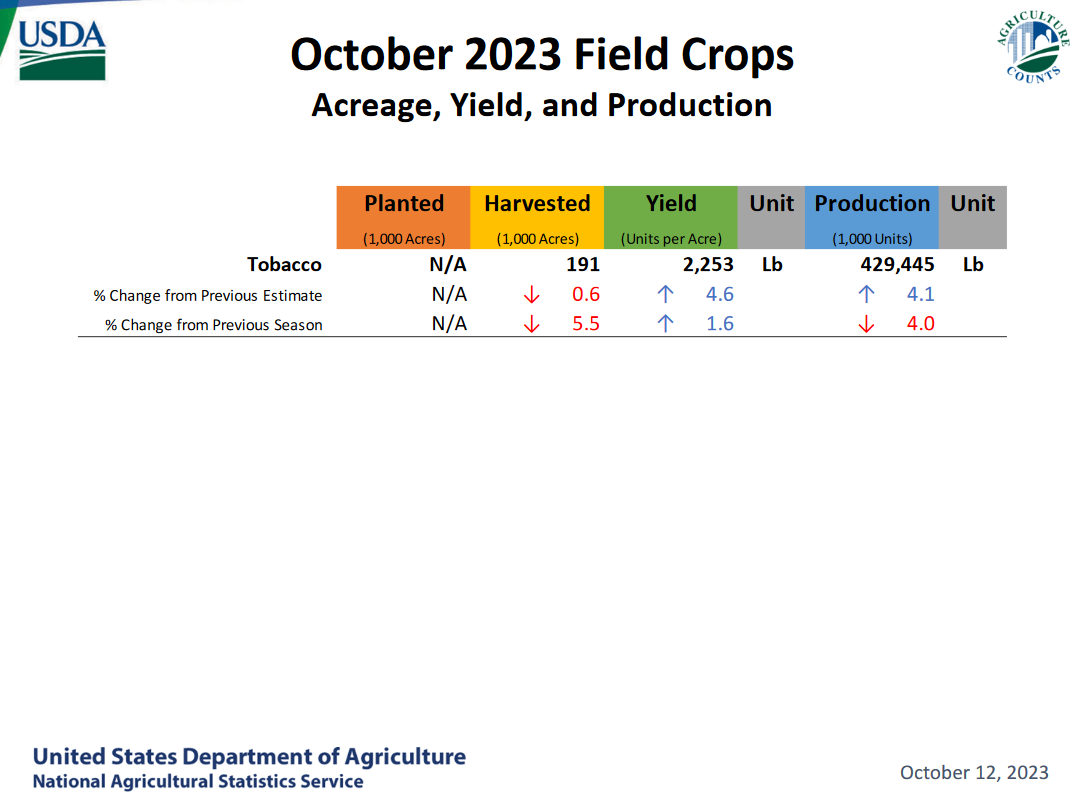
What is included in the Briefing is a combination of historical information and in most cases the current forecast for what the harvest will be like. In the full Briefing but not included in this article are slides that show how the forecasts have varied month by month and what the current forecast is and what other industry forecasts are. This Briefing is about crops not animals.
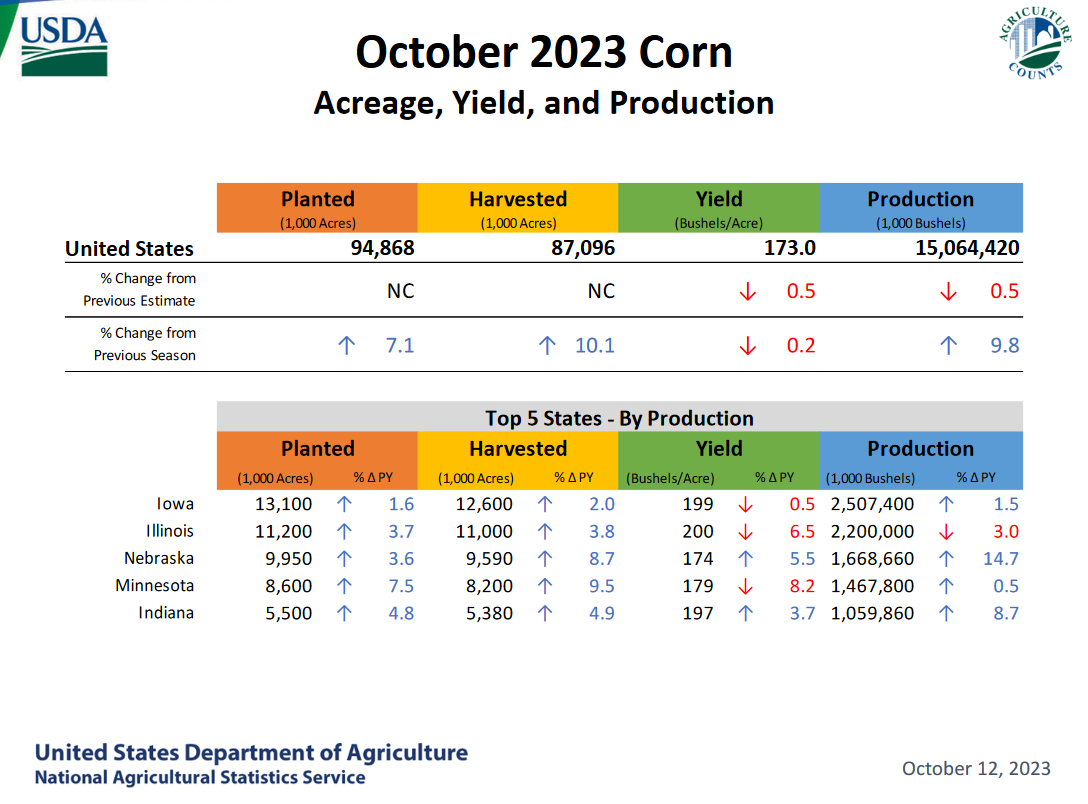
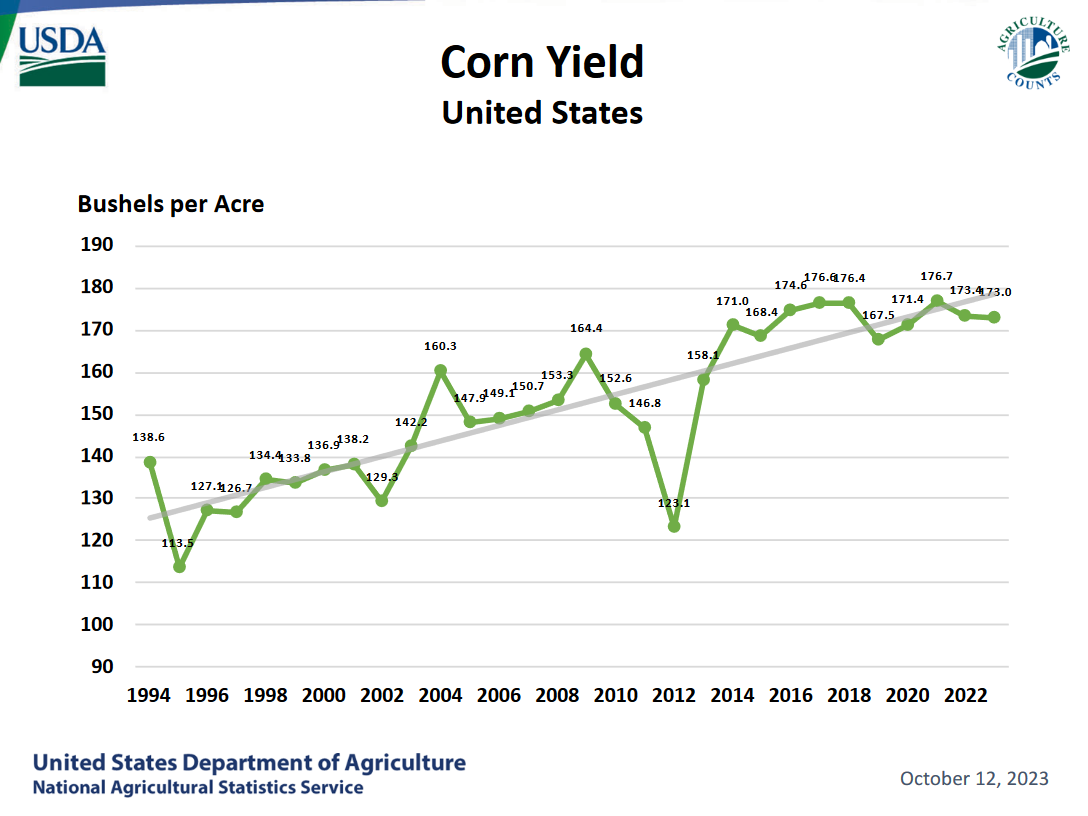
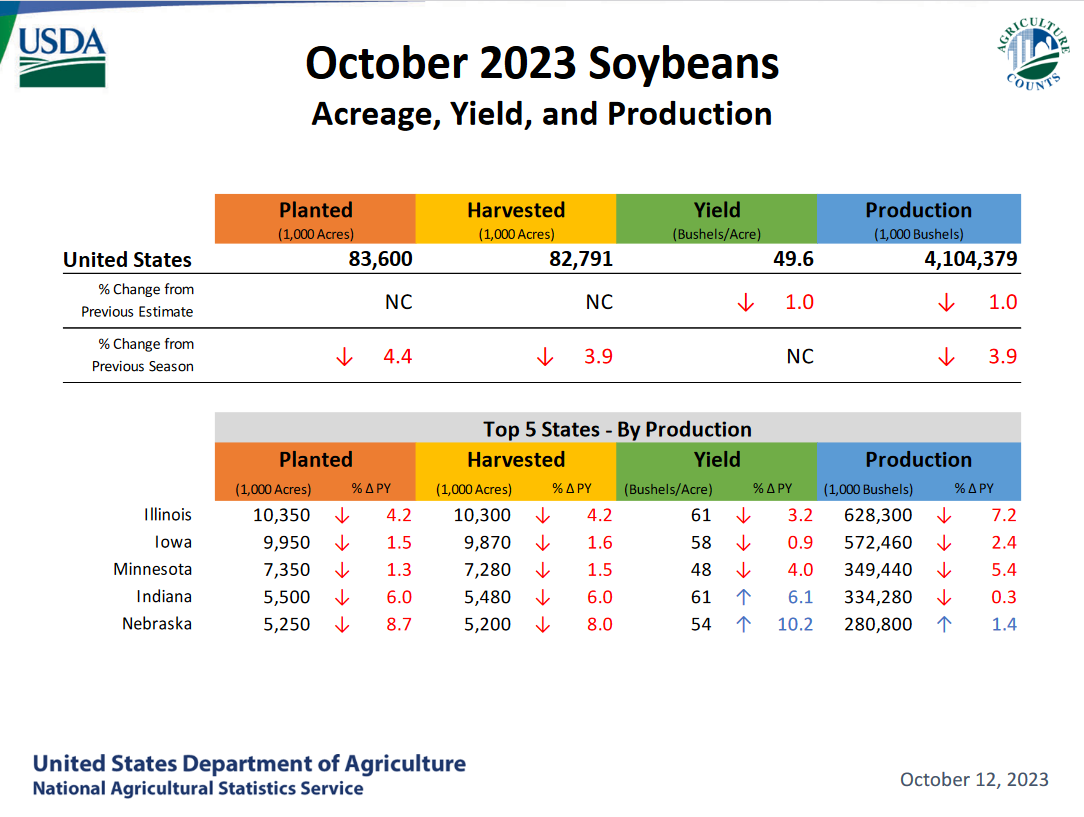
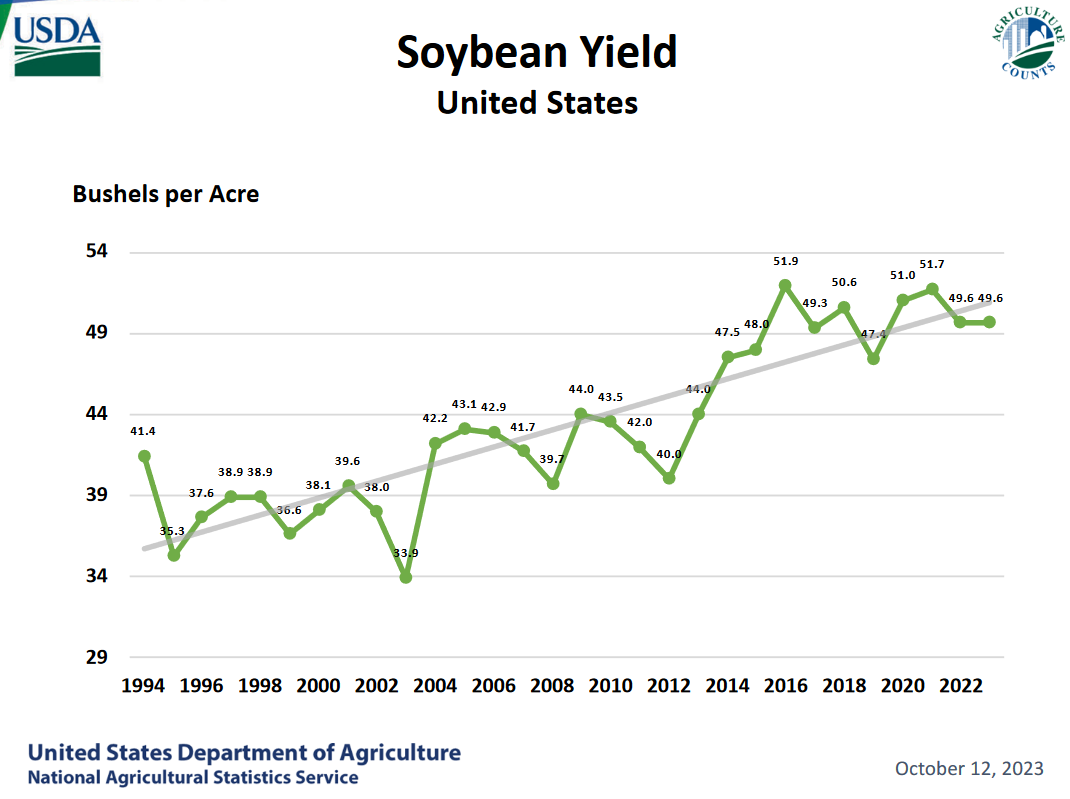
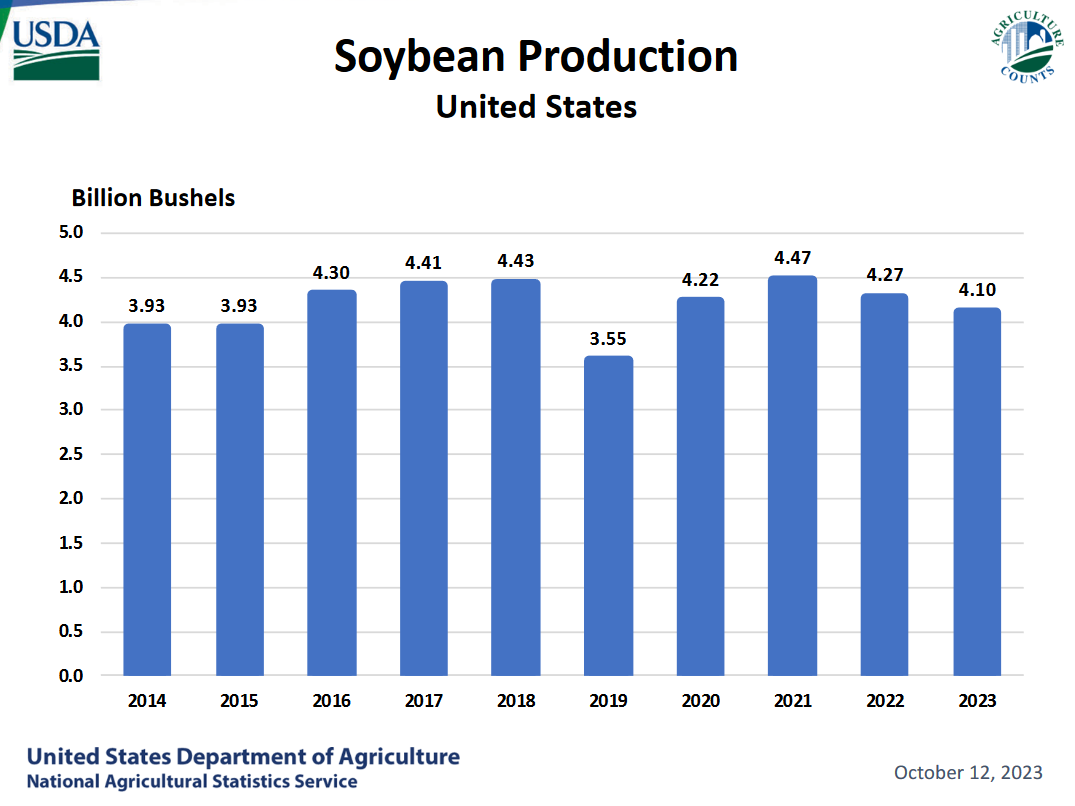
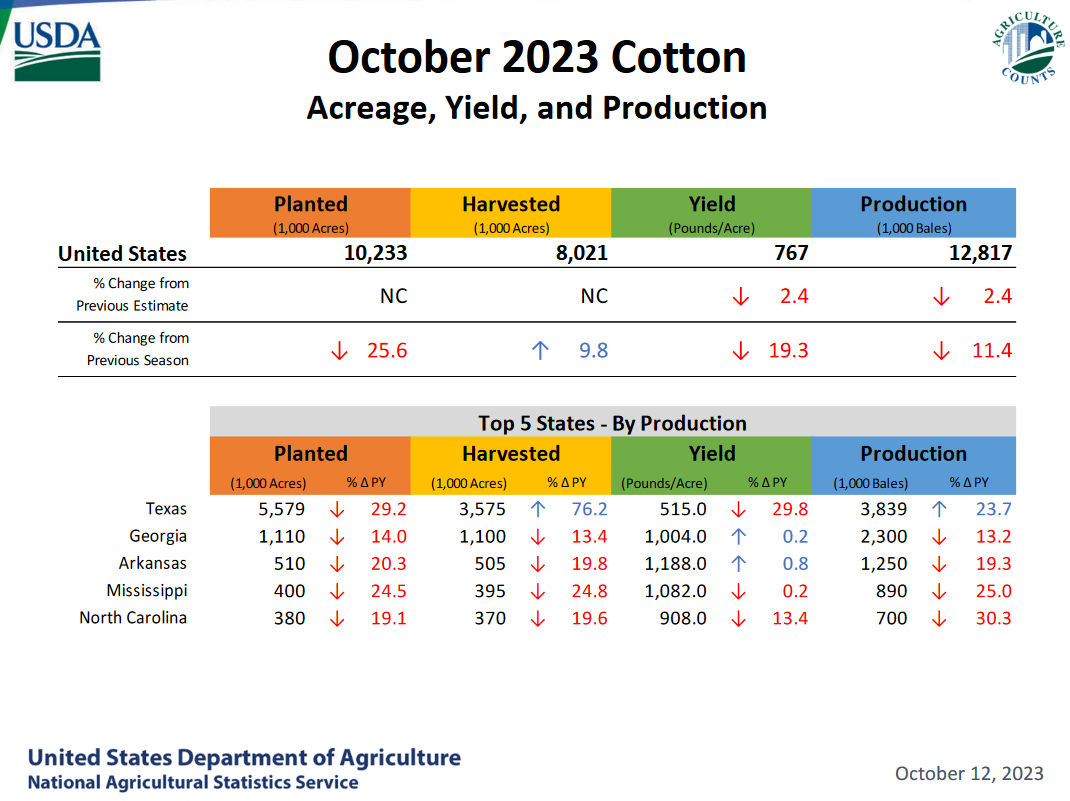
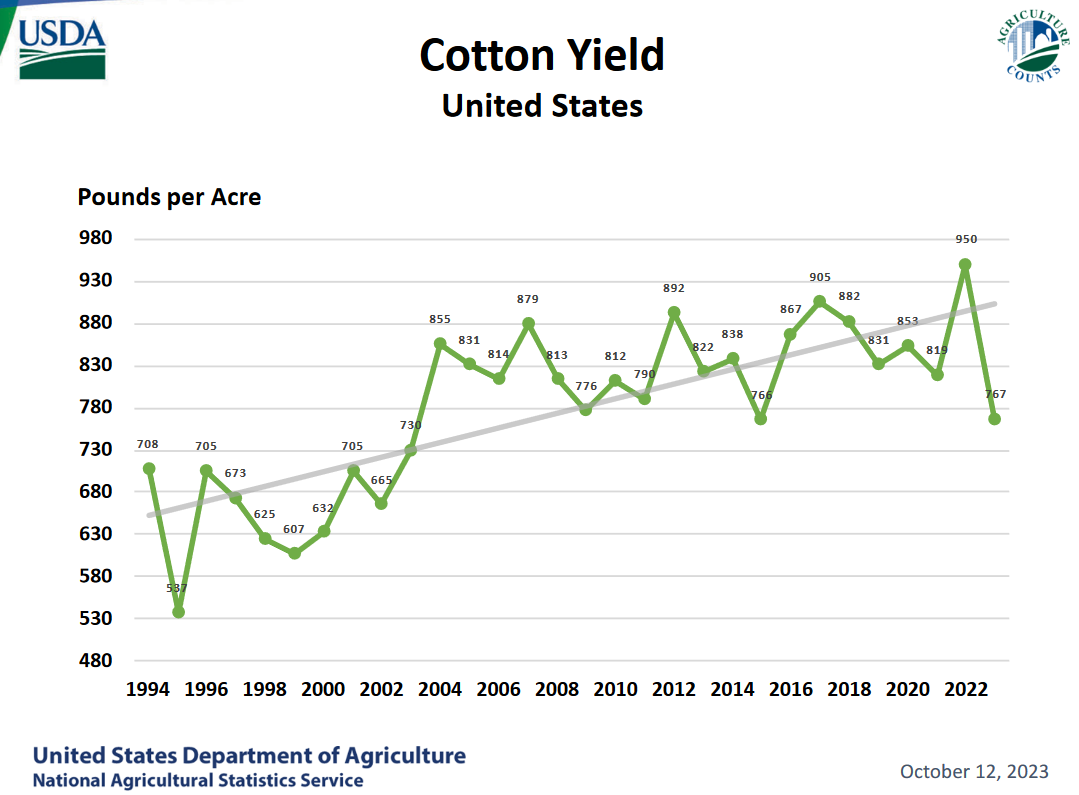
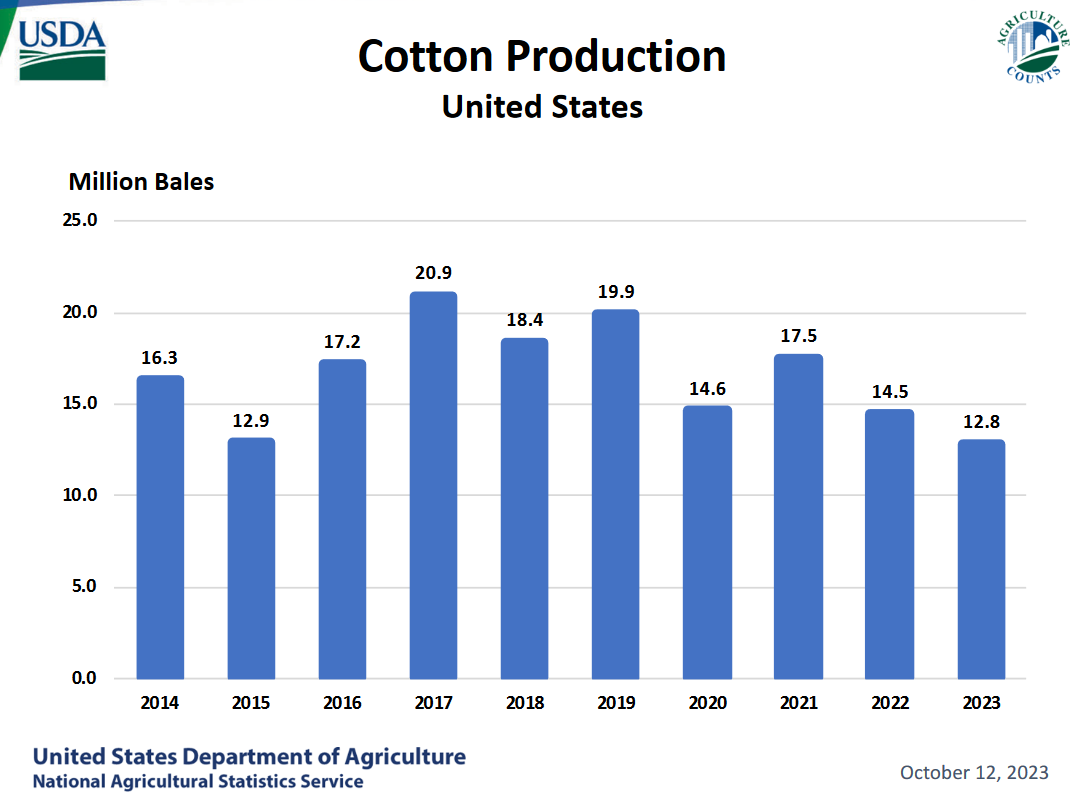
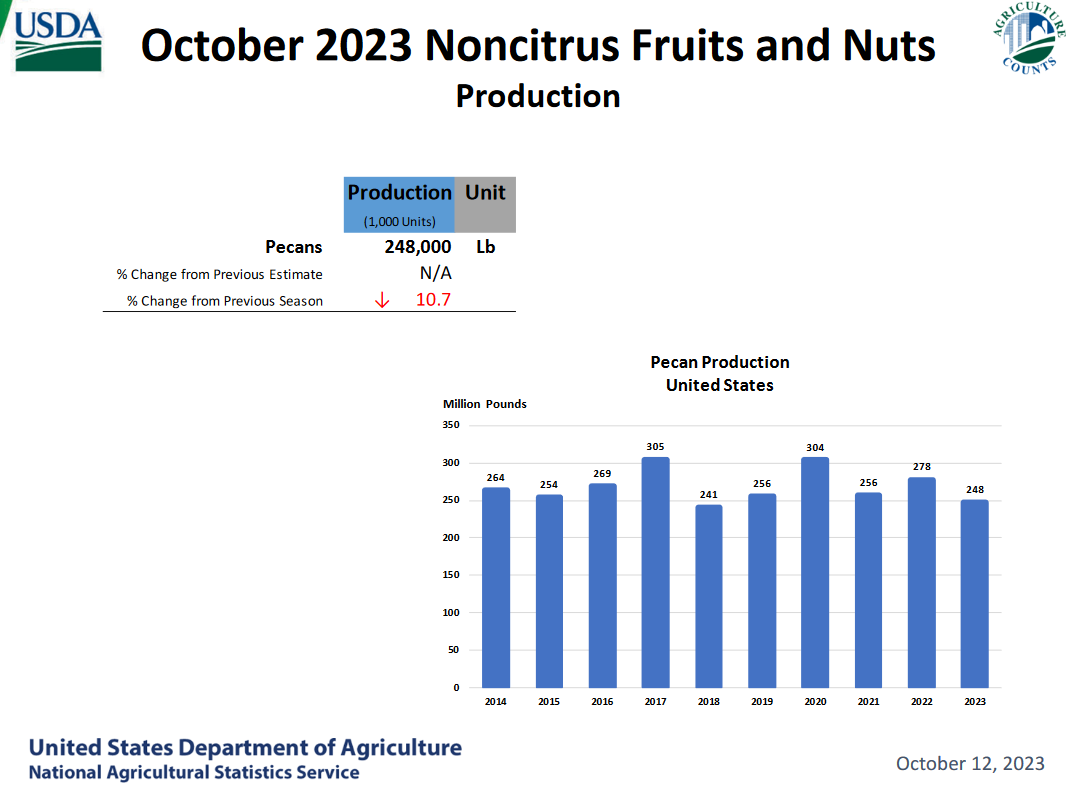
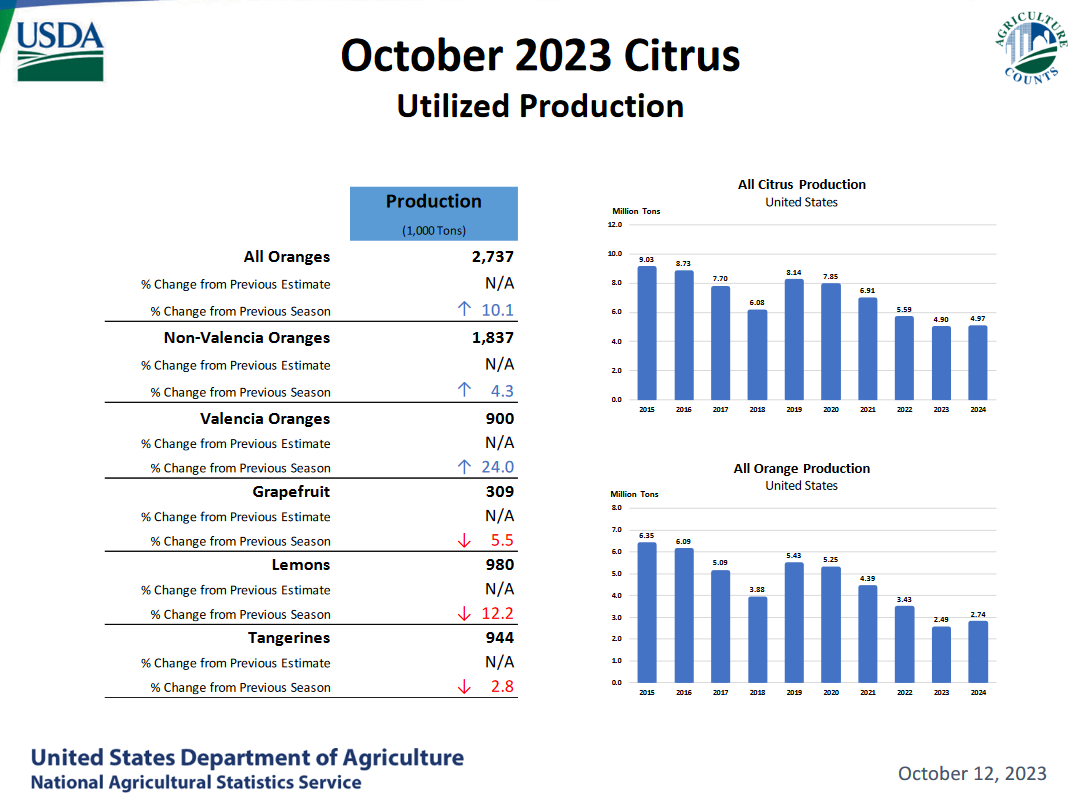
Of interest to me is the history of yields and also the history of actual production. In general, that data is concerning. I think most of the slides are self-explanatory so I have not included commentary on each slide.


Actually, the expanded version of what I would normally provide as the weekly progress report can be accessed HERE. So that information is in this article also. The progress reports are in terms of acres planted and the information presented above is in general a forecast of what the final production will be and it is impacted quite a bit by the number of acres that were planted. Last week I discussed the difference between these two reports and I only can present the “Briefing” once a month since it takes a major effort by USDA to produce the “Briefing”. I did not present the information on the amount of surveys involved but I think the weekly product is based on fewer producers being surveyed than the monthly report. Plus there are many graphics in the monthly report. |
We now take a look at how weather might impact agriculture by first taking a look at the frost/Freeze and other warnings.
| 6
– 10
|
|
|
| 8
– 14 |
|
|
| 3
– 4 |
|
|
HAZARDS OUTLOOKS
Here is the latest Day 3 -7 and Day 8 – 14 hazards forecasts which are updated only on weekdays. I think it supplements the standard weather forecast.
| You can track the situation daily by accessing our Daily Weather forecast which you can access HERE. But the weather outlook maps in this article also update. Of interest are the areas of reduced precipitation. |
Looking at the month-to-date precipitation

| You can see the wet and dry areas. The first 24 days of October were on an overall basis somewhat dryer than normal. |
Sources of Information
Weekly Updates can be found HERE
and perhaps more directly HERE
Additional Useful Sources of Information
WASDE: World Agricultural Supply and Demand Estimates HERE
NASS Report Schedule HERE
Executive Briefings HERE
Economics and Prices HERE
Office of the Chief Economist HERE.
Drought information by crop HERE
–
| I hope you found this article interesting and useful. |