This article is based primarily on the September 26, 2023, USDA Crop Bulletin which covers the week ending September 24, 2023. The full USDA Crop Bulletin can be accessed HERE
It again seems like an average crop which is good considering the late and poor start. Because we published a few days late we were able to include the Crop Prices report that has indices for prices received and prices paid by farmers for their purchases but the ratio of prices received to prices paid is essentially the same in August as it was in July. But like all indices one sometimes has to look into the details to know how to interpret the indices and in this case the ratio of the price and cost indices. We show the summary and provide a link to the full report. Obviously, the full report is quite long and readers interested in this subject can follow the link provided and draw their own conclusions.
The article includes a short international review of agricultural conditions which are generally favorable. I also included U.S. crop-related weather forecasts.
![]()
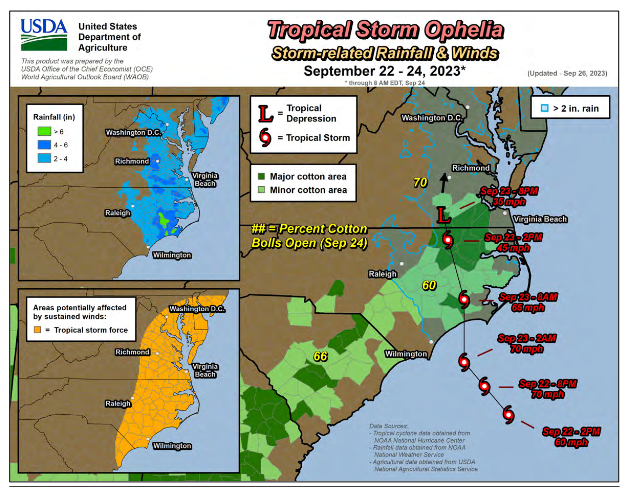
We begin by taking a look at the impact of Tropical Storm Ophelia. It is probably too soon to assess the crop impacts which will show up in the USDA Crop Bulletin that will be issued on October 3 if the U.S. Government is not shut down.
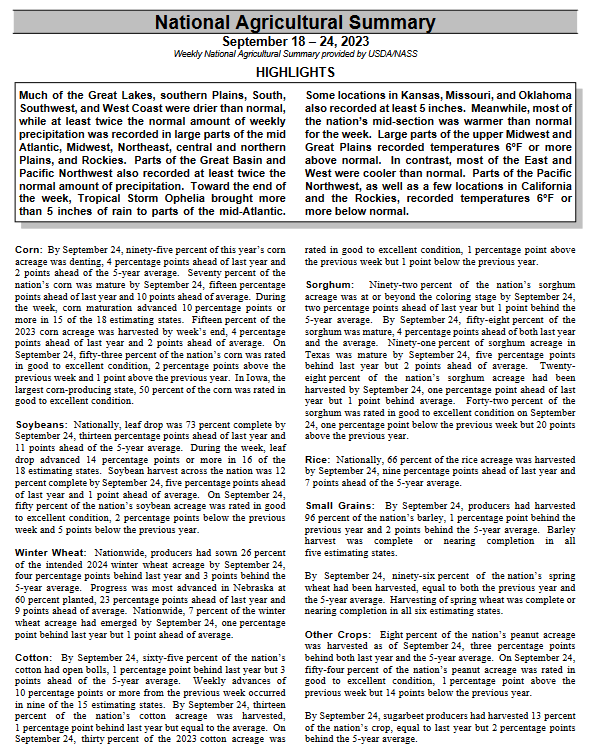
Now on to the National Agriculture Summary. The Tables below the summary have additional data. The boxes with my comments may be incomplete so for crops of interest check the data out yourself to be sure.
| Below is pretty much the same information in table format. However, there is a lot of additional information in these tables. |
–
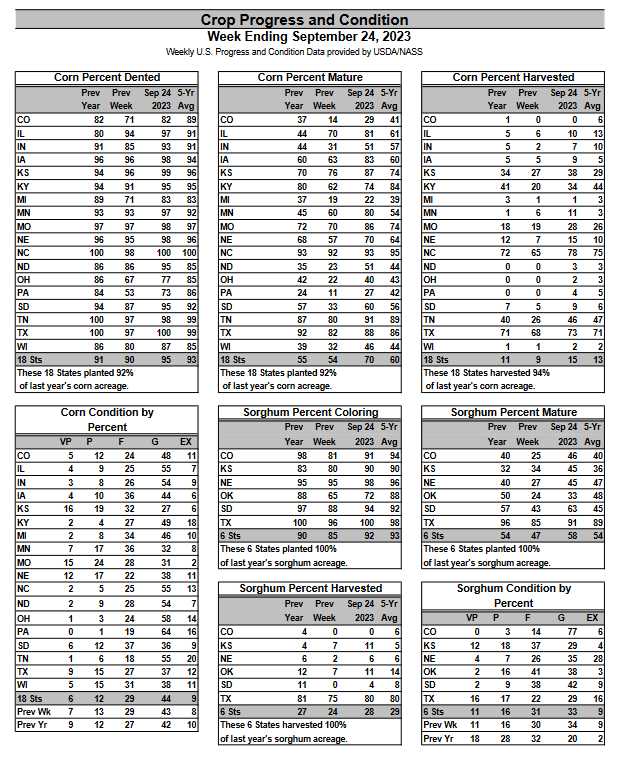
| The condition of corn seems to have recovered from earlier this year to now be even better than last year and the 5-Yr Average which is amazing. Sorghum is in line with its 5-Yr average with the crop condition much improved over last year so Sorghum may soon be equaling or exceeding the 5-Yr Average. |
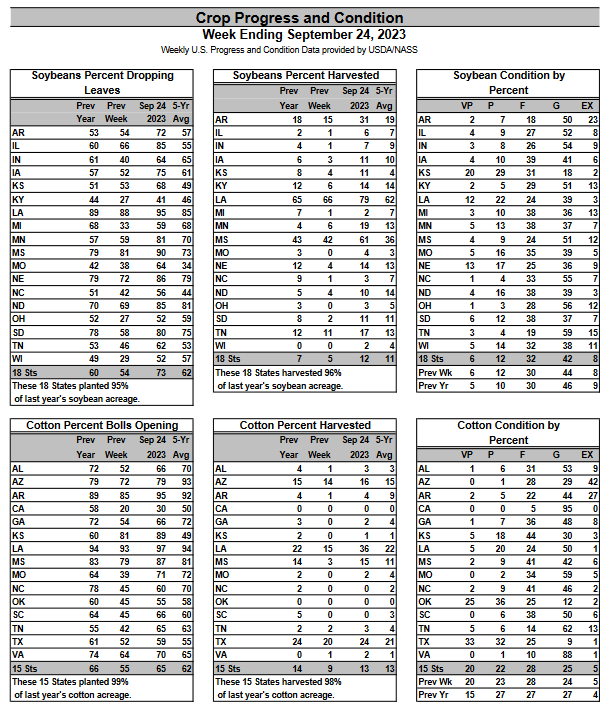
| Soybeans are performing at their five-year average. Elsewhere in this report, it seems to show that the number of acres planted and certainly the acres harvested is less than last year. Cotton is now in line with the five-year average. |
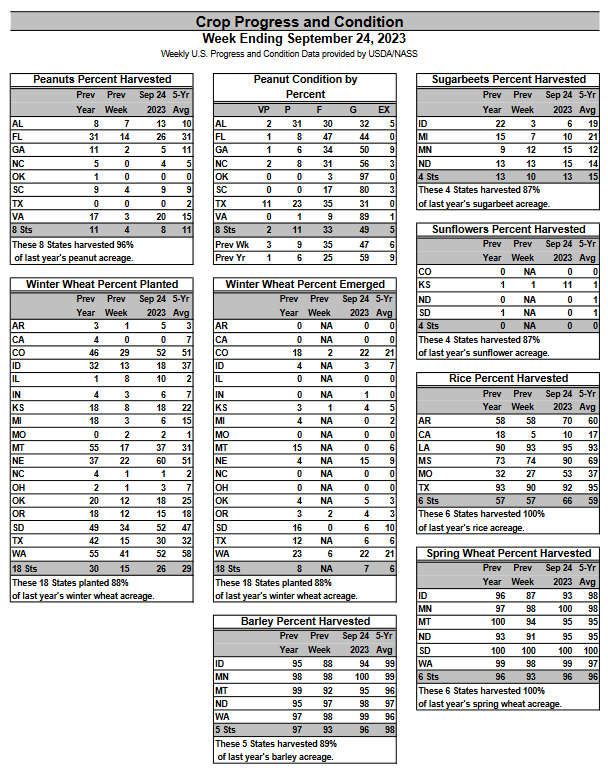
| Peanut conditions continued to lag last year. Spring wheat is in line with the five-year average. Barley has almost caught up with its five-year average. Rice is looking very good. The harvesting of sugarbeets has just started but it looks ok. The planting of winter wheat is a bit slower than last year and their 5-Yr average. |
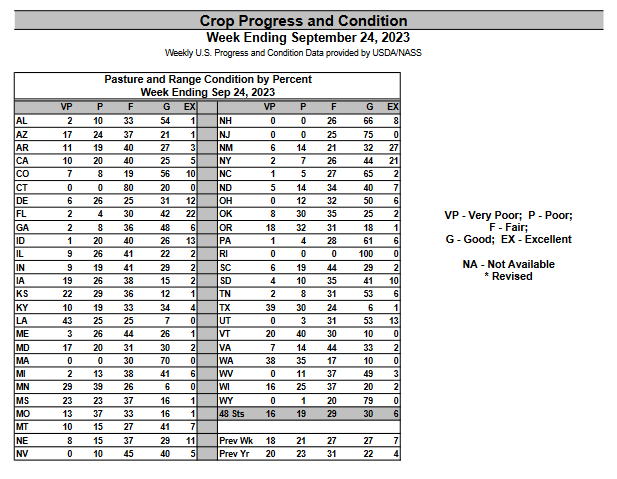
| The pasture conditions are better than last year but not dramatically. |
Some additional detail is provided HEREIt is mostly some additional weeks of data and it is all in larger print. |
Let us take a look at the weather forecasts.
| 6
– 10
|
|
|
| 8
– 14 |
|
|
| 3
– 4 |
|
|
HAZARDS OUTLOOKS
Here is the latest Day 3 -7 and Day 8 – 14 hazards forecasts which are updated only on weekdays. I think it supplements the standard weather forecast.
| You can track the situation daily by accessing our Daily Weather forecast which you can access HERE. But the weather outlook maps in this article also update. Of interest are the areas of reduced precipitation. |
Looking at the month-to-date precipitation

| You can see the wet and dry areas. The first 28 days of September were pretty dry in the major growing areas other than parts of California. |
The NASS Report of the Week. This week we provided the latest Crop Prices Report.
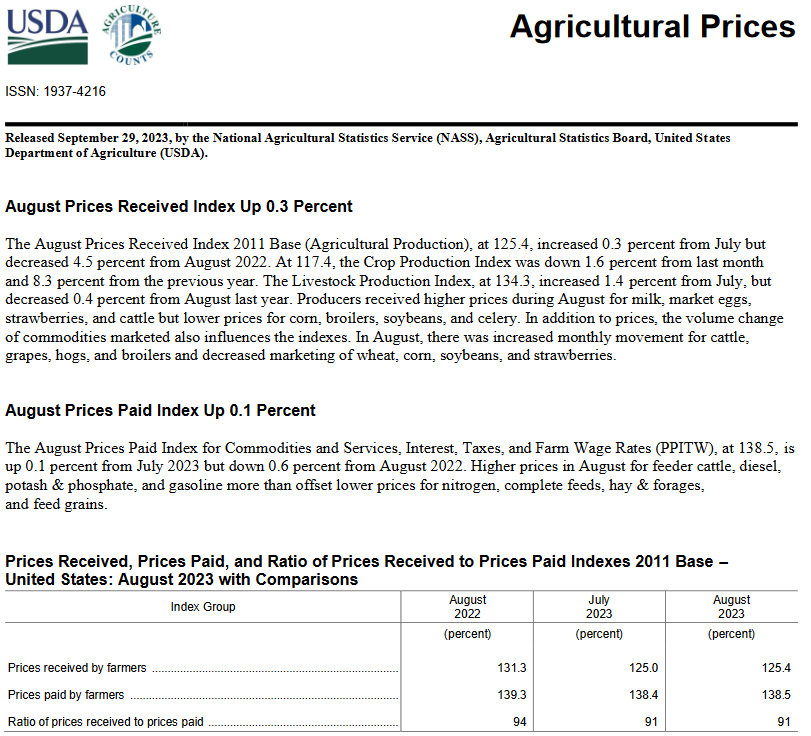
| August seems to be similar to July for farmers (which includes ranchers) than July. The full report can be found HERE. |
International
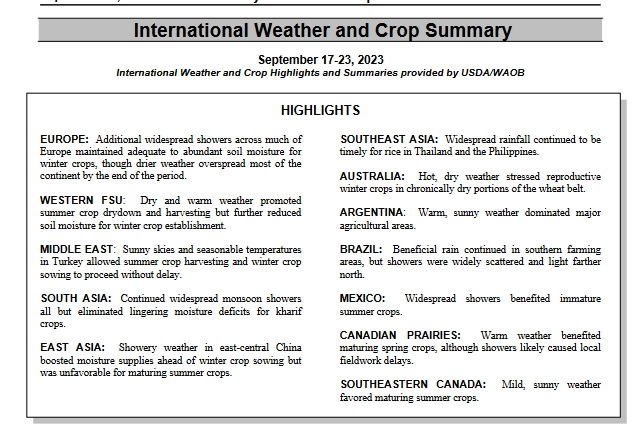
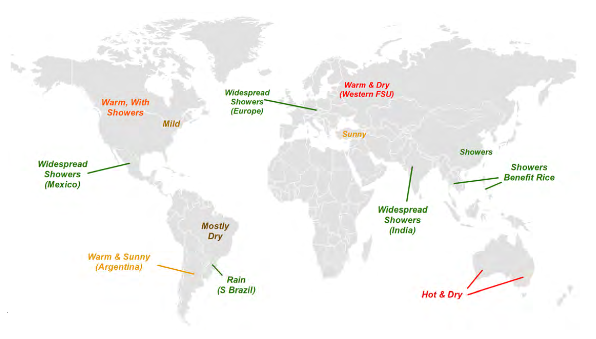
| The above is the map that was provided this week. |
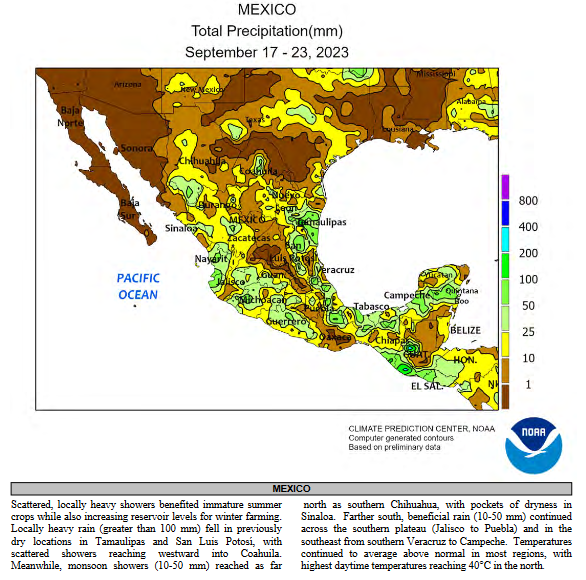
| I am showing Mexico because it informs us of the progress of the Sonoran Monsoon. It is no longer providing moisture to CONUS so I will probably not be showing Mexico until next June. |
Sources of Information
Weekly Updates can be found HERE
and perhaps more directly HERE
Additional Useful Sources of Information
WASDE: World Agricultural Supply and Demand Estimates HERE
NASS Report Schedule HERE
Executive Briefings HERE
Economics and Prices HERE
Office of the Chief Economist HERE.
Drought information by crop HERE
–
| I hope you found this article interesting and useful. |