On the second Thursday of every month, NOAA (really their Climate Prediction Center CPC) issues its analysis of the status of ENSO. This includes determining the Alert System Status. NOAA again describes their conclusion as “ENSO Alert System Status: El Nino Advisory”
There is not much doubt that we have an El Nino. How long it lasts and its strength remains to be seen. NOAA may be more conservative compared to some other Weather Advisory Organizations.

CLIMATE PREDICTION CENTER ENSO DISCUSSION
| The second paragraph is what is important:
“The most recent IRI plume indicates El Niño will persist through the Northern Hemisphere winter 2023-24. Despite nearly the same ensemble mean amplitude as last month, the shorter forecast horizon means that the odds of at least a “strong” El Niño (≥1.5C for the November-January seasonal average in Niño-3.4) have increased to 71%. However, a strong El Niño does not necessarily equate to strong impacts locally, with the odds of related climate anomalies often lower than the chances of El Niño itself (e.g., CPC’s seasonal outlooks). In summary, El Niño is anticipated to continue through the Northern Hemisphere winter (with greater than 95% chance through January – March 2024; ).” |
We now provide additional detail but I am keeping this article shorter than usual because nothing much has changed since last month.
CPC Probability Distribution
Here are the new forecast probabilities. This information in the past has been released twice a month and the first release is based on a survey of Meteorologists, the second is based on model results. The probabilities are for three-month periods e.g. ASO stands for August/September/October. The approach may have changed as IRI (The International Research Institute for Climate and Society, Columbia University Climate School) may no longer be involved. Their website has not been updated this month.
Here is the current release of the probabilities:
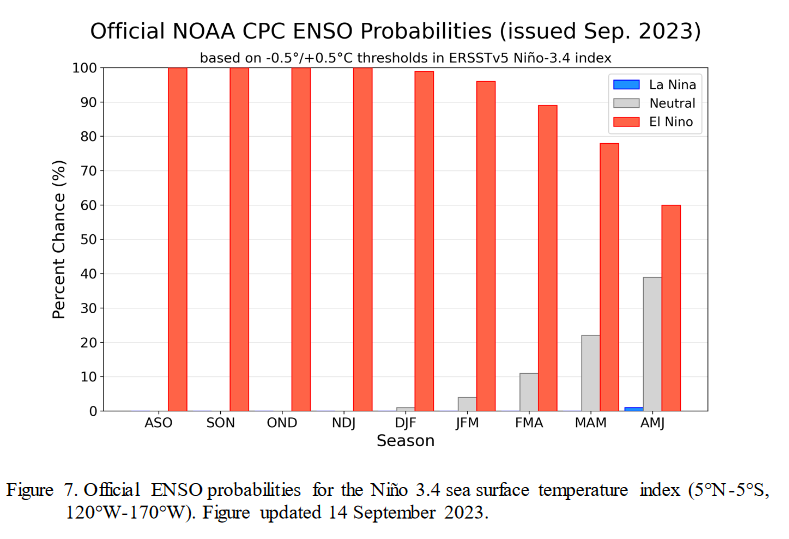
| You can clearly see the forecast does not extend beyond AMJ 2024 and one does see a tail-off in the probabilities for El Nino conditions in the Eastern Pacific after the winter season. Some Meteorological Agencies see El Nino lasting longer but JAMSTEC showed it ending sooner in the article I posted last night which you can access HERE. |
Here is the forecast from late last month.
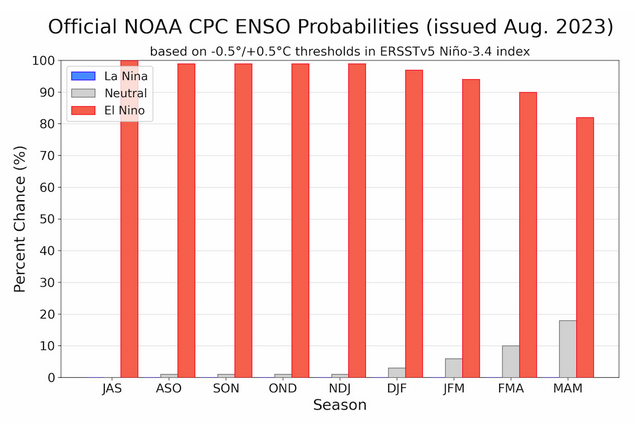
| This showed a slower demise of the El Nino. |
What Does the NOAA Proprietary ENSO Model Forecast?
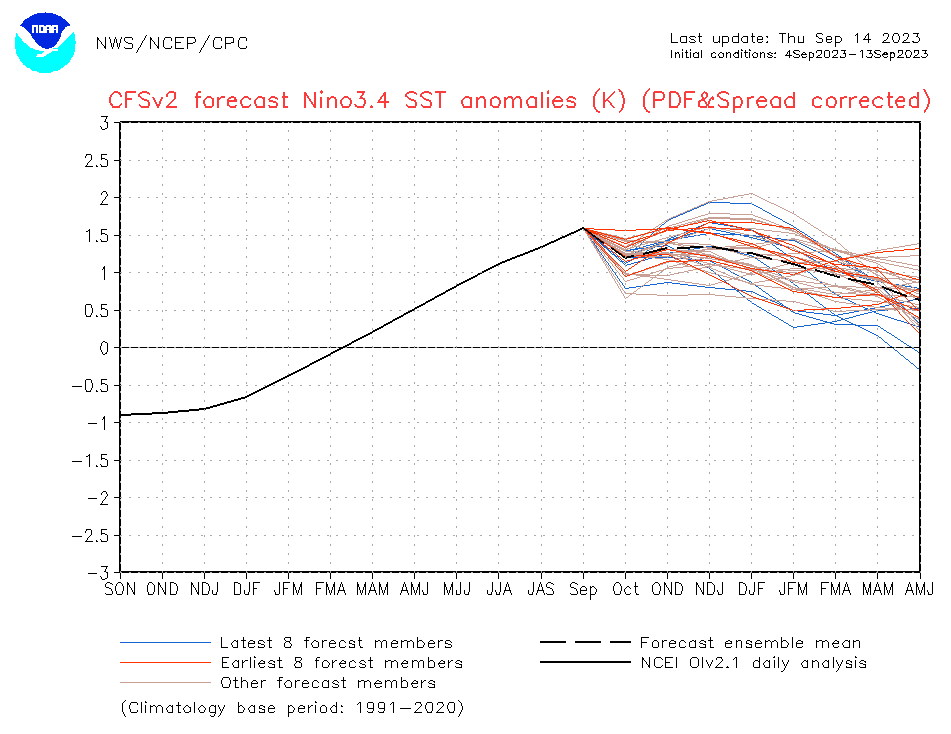
| This model shows the scatter in the forecasts and the El Nino peaking right now! The dark dashed line is the mean of the ensemble forecasts. If you want to see an updated version you can view an updated version by clicking HERE. So this is very different from the official CPC forecast and seems quite odd actually. |
View of other Models.
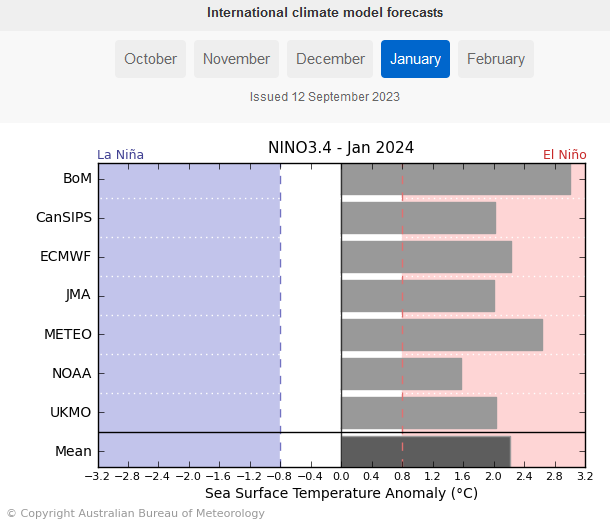
| The forecast for the strength of the NINO 3.4 Index in January of 2024 is the lowest for NOAA in this small collection of model results prepared by the Australian Bureau of Meteorology. |
Looking at Actual Current Conditions.
NOAA reports some derived data that describes the current situation and a forecast. But what if we want to form our own opinion? After all, meteorologists are looking at the actual current situation and making predictions.
This shows the current actual situation for the surface of oceans. To update this graphic click HERE.
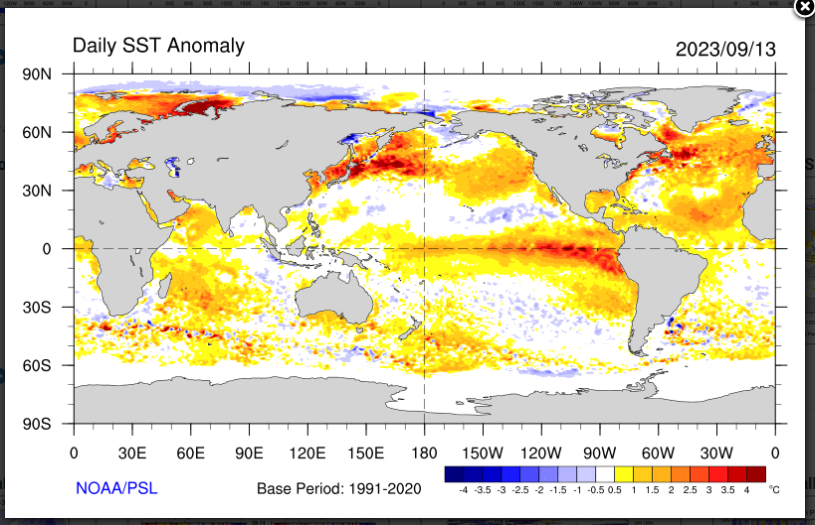
| You can see the warm tongue of water extending from Ecuador and Peru. The difference between the Northern Hemisphere and the Southern Hemisphere is interesting. With Hurricane Lee approaching, the warm water off the Northeast Coast and Canada is not good news. We are discussing ENSO tonight but you can see a lot of interesting things here. It is only a one-day snapshot so keep that in mind. |
Putting the historical information in motion. Updates can be found HERE. but should not be needed.

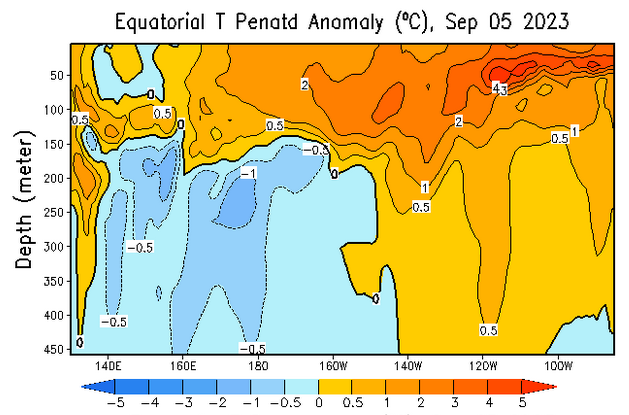
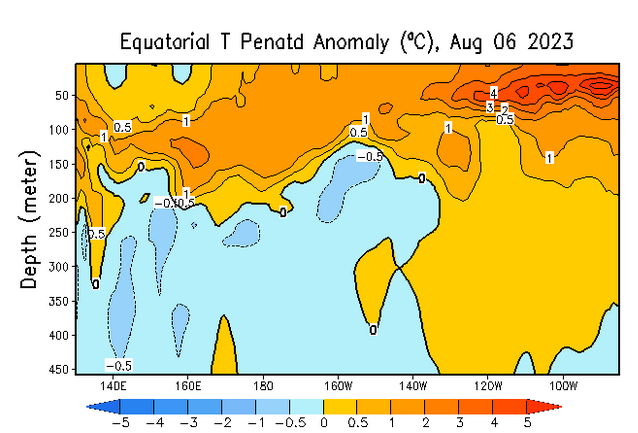
Now we look at the below surface temperature anomalies. Mapping the details. (Cross-Section along the Equator). The data is a five-day average centered on the date shown.
Here is the new map followed by the prior graphic and this is not much change. There is actually less undercutting of the warm anomaly further suggesting that El Nino will be around for a while.
| There is a lot of warm water on the surface and below it. But the Indo-Pacific Warm Pool is pretty much spent. This raises some questions in my mind. |
Is the response of the atmosphere sufficient to sustain an El Nino?

| The SOI had been falling which is confirming the El Nino but not very strongly. |
| I hope you found this article interesting and useful. |