This article is based primarily on the August 29, 2023, USDA Crop Bulletin which covers the week ending September 3, 2023. The USDA report usually becomes available on Tuesdays but was issued this week due to the National Holiday. The full USDA Crop Bulletin can be accessed HERE.
It again seems like an average crop. Hurricane Idalia seems to have had little if any impact but the reporting may need another week to be sure of that.
The article includes a short international review of agricultural conditions. I also included crop-related weather information. I have included the Agricultural Prices Report and it suggests problems for the agriculture sector.
![]()
First, we take a look at the impact of Hurricane Idalia
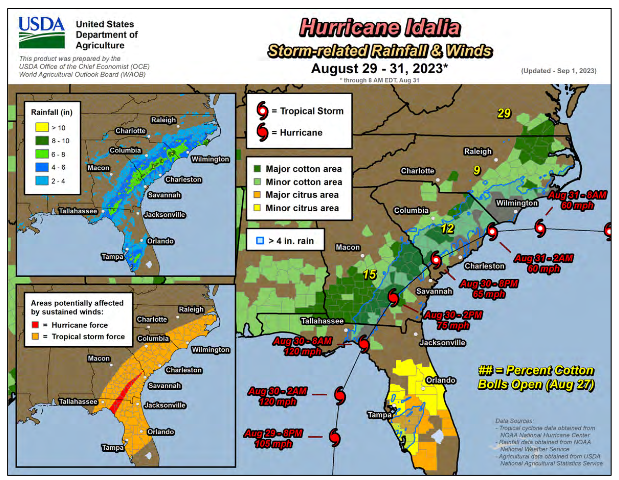
| It did not seem to impact the cotton growing area to the extent I had expected it to do but it certainly impacted the citrus growing area. We do not have a report on the impacts of the storm on citrus this week. This graphic shows the weather impacts but we do not know how it impacted the crop. |
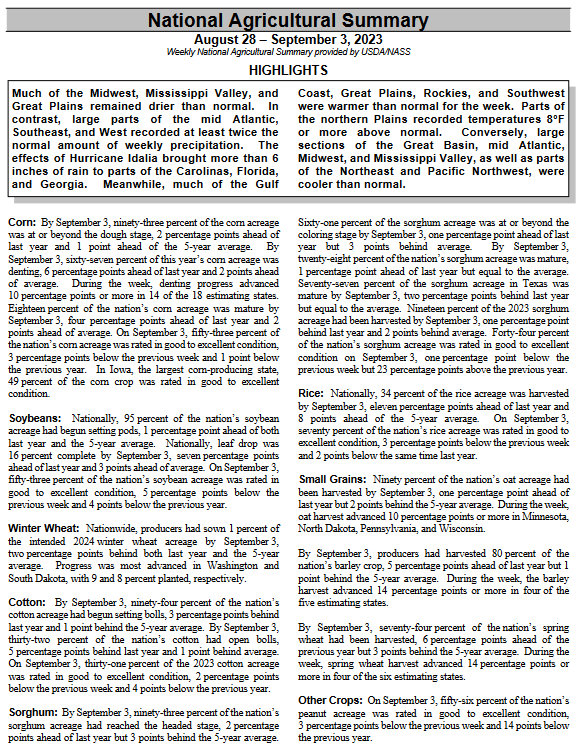
We begin with the National Agriculture Summary. The Tables below the summary have additional data. The boxes with my comments may be incomplete so for crops of interest check the data out yourself to be sure.
| Below is pretty much the same information in table format. However, there is additional information in these tables. |
–
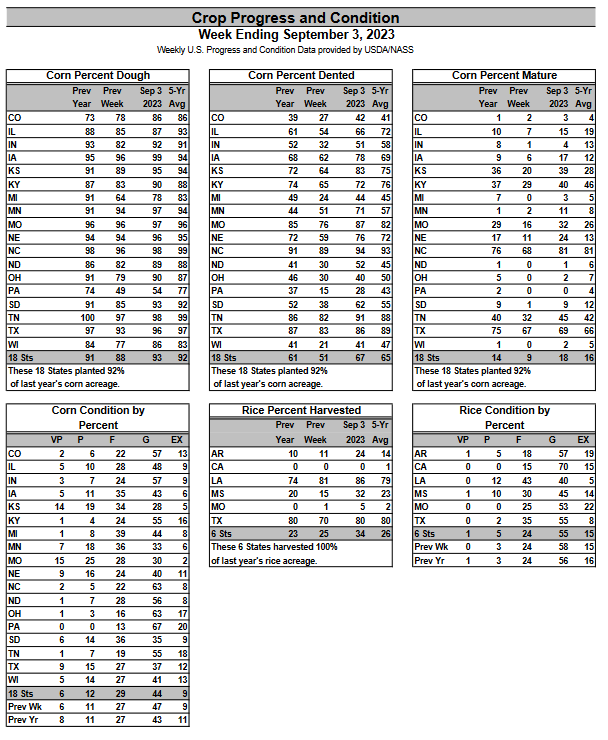
| The condition of corn seems to have recovered from earlier this year to now exceed the five-year average which is amazing. Rice is looking very good and appears not to have been negatively impacted by Hurricane Idalia. |
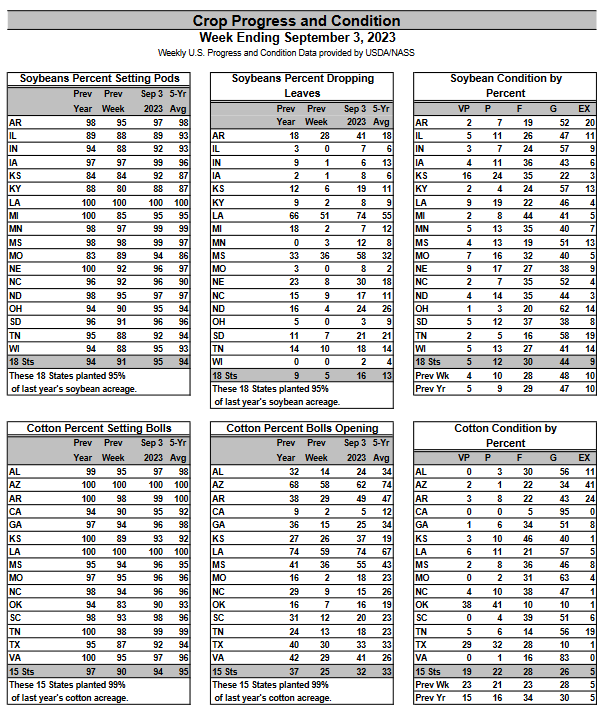
| Soybeans are performing at their five-year average but crop quality is not as good as last week. Cotton is now in line with the five-year average. |
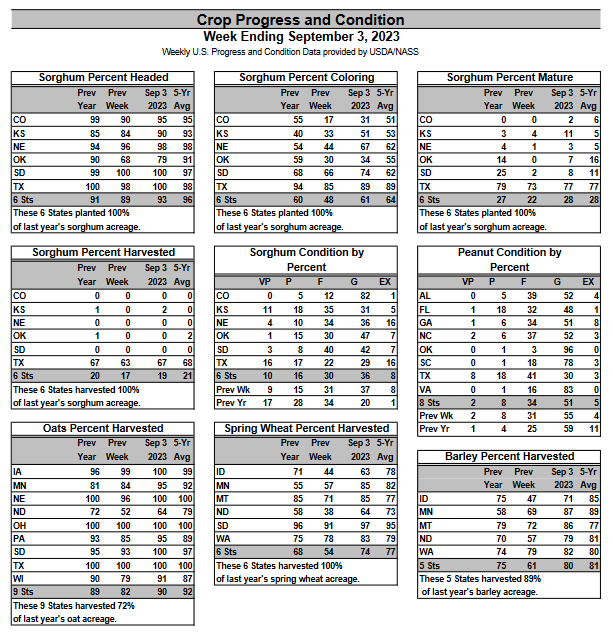
| Sorghum is in line with its five-year average with the crop quality being a big improvement over last year. Peanut conditions continue to slip a bit. Spring wheat is better than last year but not up to the five-year average. Oats are just a tad under their five-year average and Barley has caught up with its five-year average. |
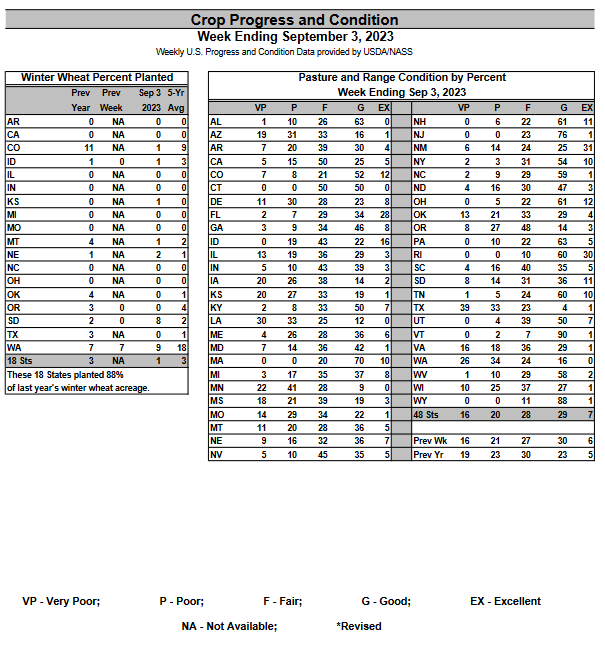
| The pasture conditions are a lot better than last year. The planting of winter wheat is just starting. |
Some additional detail is provided HEREIt is mostly some additional weeks of data and it is all in larger print. |
Let us take a look at the weather forecasts.
| 6
– 10
|
|
|
| 8
– 14 |
|
|
| 3
– 4 |
|
|
HAZARDS OUTLOOKS
Here is the latest Day 3 -7 and Day 8 – 14 hazards forecasts which update only on weekdays. I think it supplements the standard weather forecast.
| You can track the situation daily by accessing our Daily Weather forecast which you can access HERE. But the weather outlook maps in this article also update. Of interest are the areas of excessive heat. |
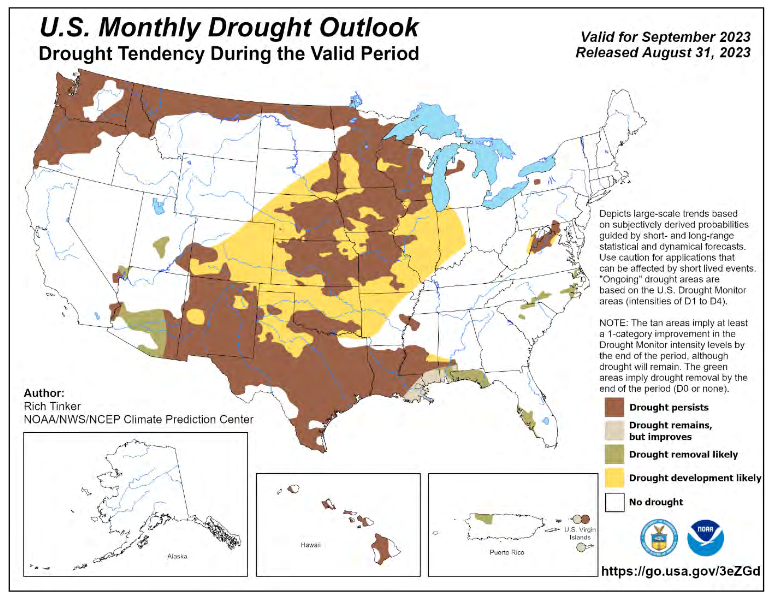
| This is the NOAA Drought Outlook for September but it does not seem to agree with the precipitation outlooks we show earlier. So it may turn out to be a bit pessimistic. |
Looking at the month-to-date precipitation

| You can see the wet and dry areas. This first week was pretty dry in the major growing areas other than parts of California. |
The NASS Report of the Week. I promised the prices report last week but when it came out I forgot to update the article from last week with this report so I am showing it now.
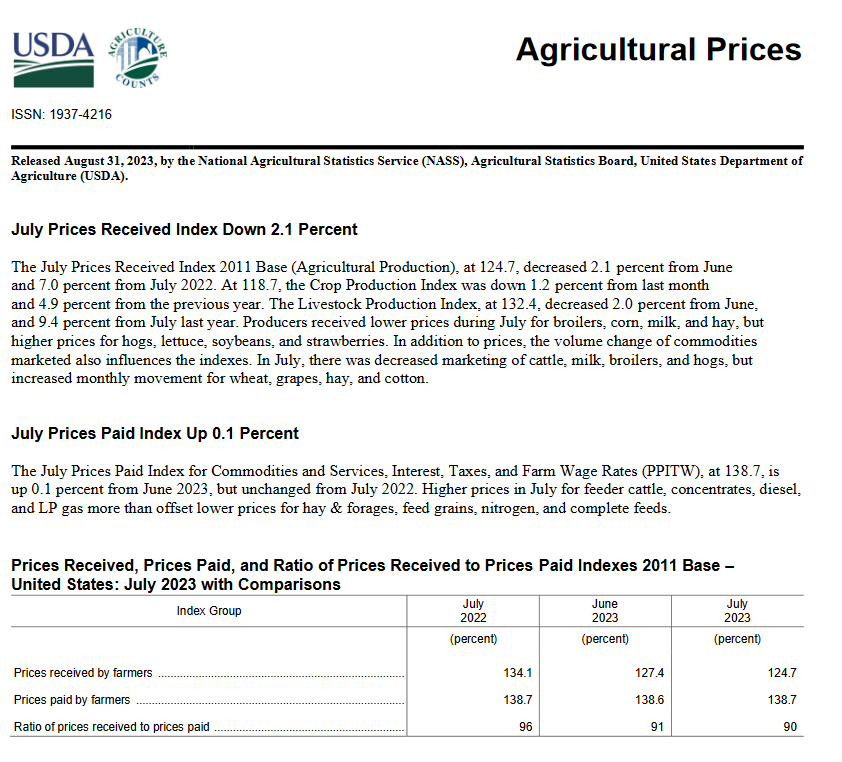
| The July prices received index has declined from 134.1 last July to 124.7 this July resulting in the ratio of prices received to prices paid declining from 96 last July to 90 this July. Certainly, it is hard to interpret this ratio but it can hardly be interpreted as good news. One needs to use quantities to weight a price index so some of the change is due to changes in the quantities sold. The full report can be accessed HERE. It contains a lot more detailed information. This report covers both crops and livestock. |
International
| No map was provided this week. |
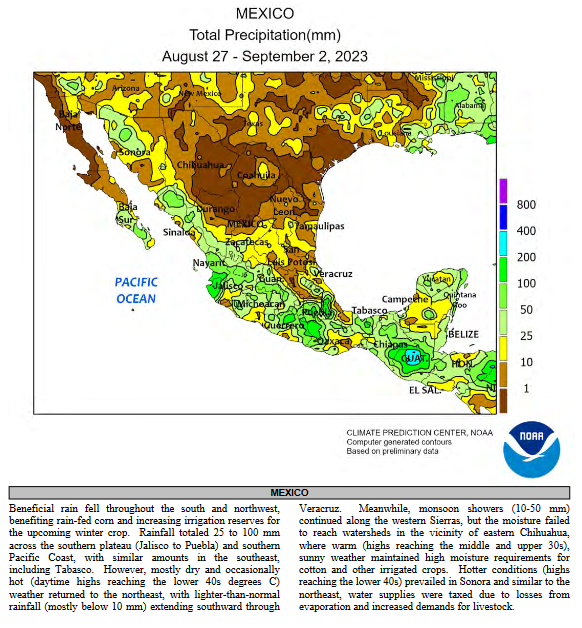
| I am showing Mexico because it informs us of the progress of the Sonoran Monsoon. It still is providing moisture to CONUS but seems to be coming to the end of its influence. |
Sources of Information
Weekly Updates can be found HERE
and perhaps more directly HERE
Additional Useful Sources of Information
WASDE: World Agricultural Supply and Demand Estimates HERE
NASS Report Schedule HERE
Executive Briefings HERE
Economics and Prices HERE
Office of the Chief Economist HERE.
Drought information by crop HERE
–
| I hope you found this article interesting and useful. |
–
| Notices: Recently we published the NOAA mid-month update for September and you can access that article HERE.
We also published an article on a court decision that relates to whether or not states can decline to store out-of-state nuclear waste and you can access that article HERE. It is part of a series of articles I am writing on nuclear waste storage which is a huge problem for the world and the U.S. and I urge readers to read this court decision. |