This article is based primarily on the August 22, 2023, USDA Crop Bulletin which covers the week ending August 20, 2023. The USDA report usually becomes available on Tuesdays. I have omitted a number of graphics that are available in the full USDA Crop Bulletin which can be accessed HERE.
It now seems like an average crop or better especially given the recovery of the corn and soybean crops as the drought in the important growing area for those two crops let up.
The article includes a short international review of agricultural conditions. It includes a report on U.S. rice stocks (inventory). I also included crop-related weather information.
![]()
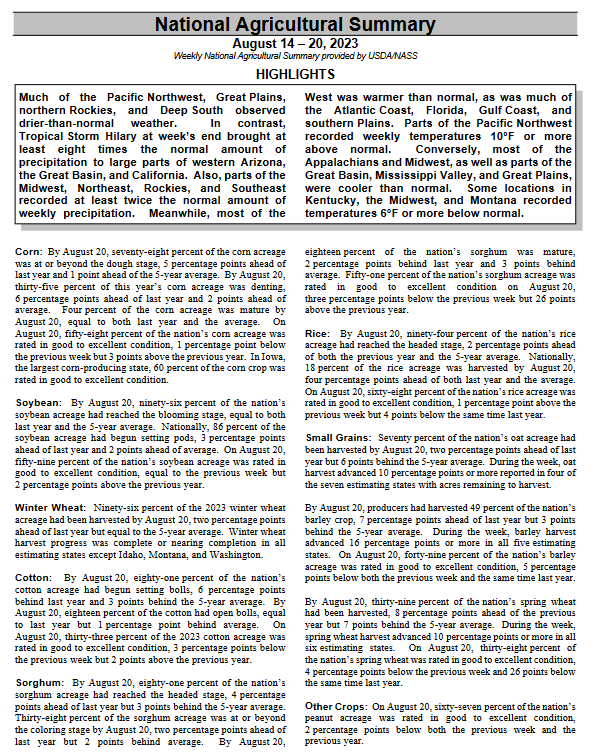
We begin with the National Agriculture Summary. The Tables below the summary have additional data. The boxes with my comments may be incomplete so for crops of interest check the data out yourself to be sure.
| Below is pretty much the same information in table format. However, there is additional information in these tables. |
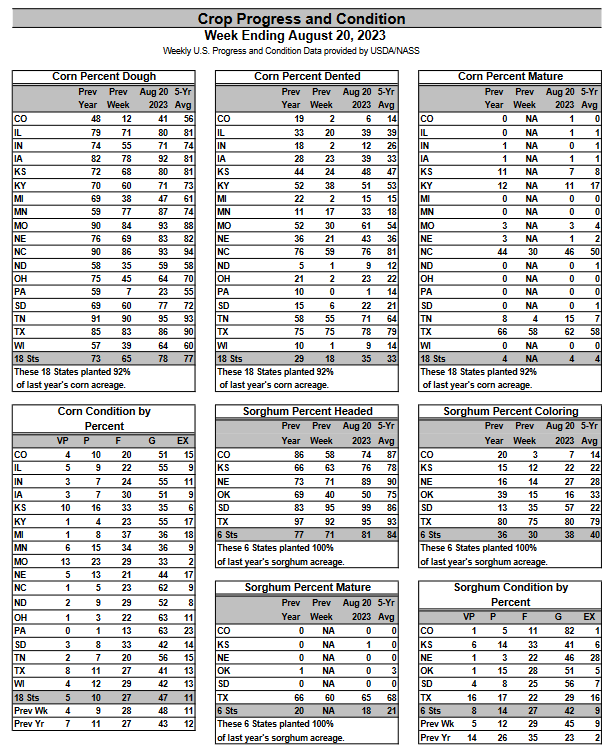
| The condition of corn seems to have recovered from earlier this year to the same level as last year which is amazing. Sorghum is on schedule and in very good condition. |
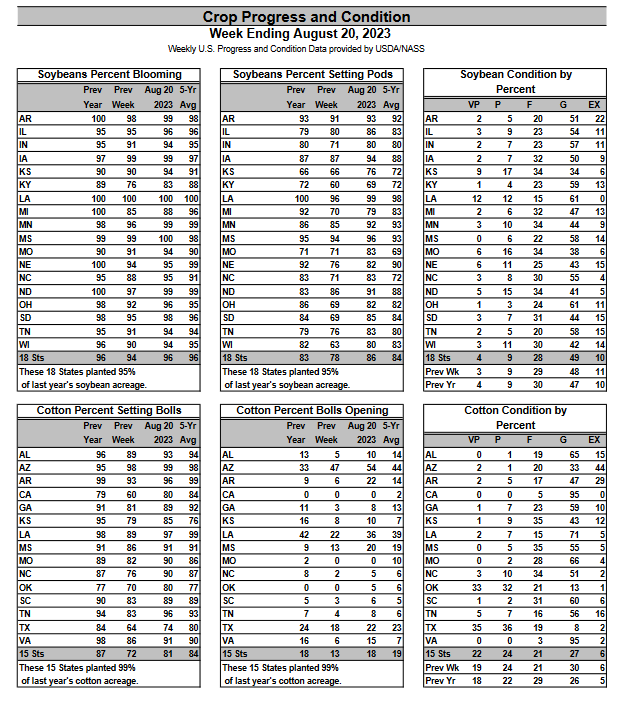
| Soybeans have also improved their condition from earlier this year which is amazing. Cotton is now in line with the five-year average. |
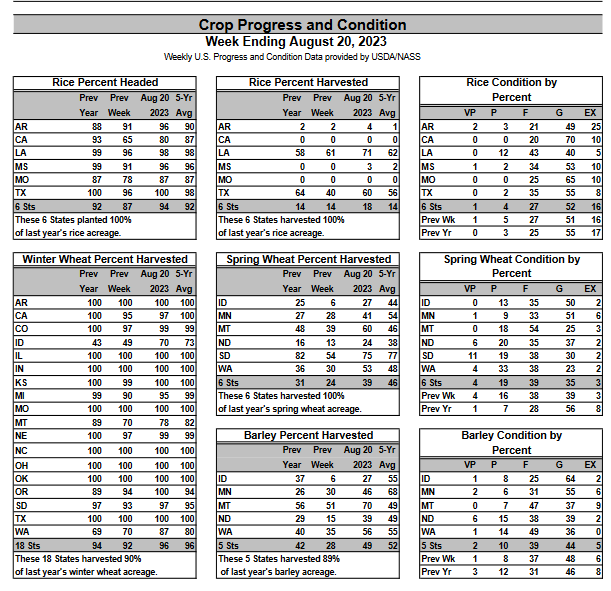
| Rice looks very good. Winter Wheat is in line with the five-year average. Spring wheat is not doing well. Barley could be doing better. |
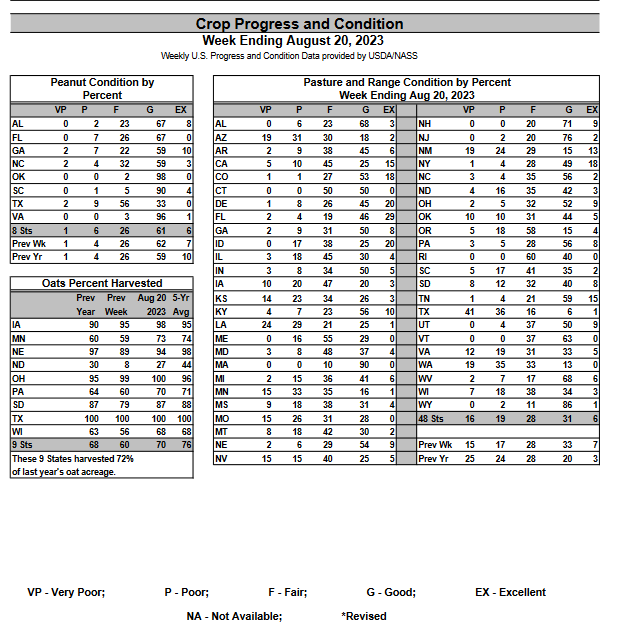
| Peanuts seem to be in line with the five-year average. Oats are slightly slow but not much. The pastures are a lot better than last year. |
Some additional detail is provided HEREIt is mostly some additional weeks of data and it is all in larger print. |
Let us take a look at the weather forecasts.
| 6
– 10
|
|
|
| 8
– 14 |
|
|
| 3
– 4 |
|
|
HAZARDS OUTLOOKS
Here is the latest Day 3 -7 and Day 8 – 14 hazards forecasts which update only on weekdays. I think it supplements the standard weather forecast.
| You can track the situation daily by accessing our Daily Weather forecast which you can access HERE. But the weather outlook maps in this article also update. Of interest are the areas of excessive heat. |
Looking at the month-to-date precipitation

| You can see the dry areas. |
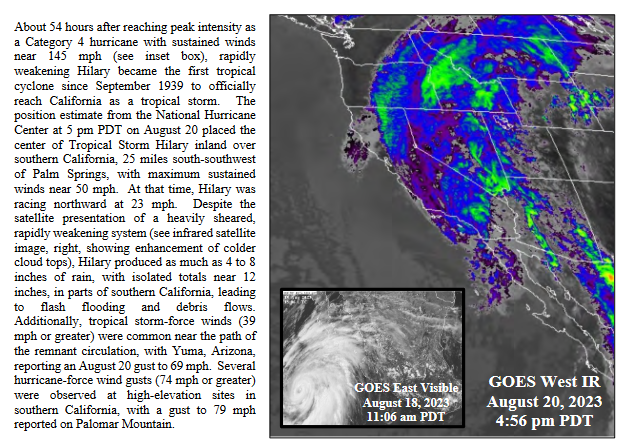
And of course there was Hilary
The NASS Report of the Week.
This week we reported on Rice Stocks. The full report can be accessed HERE
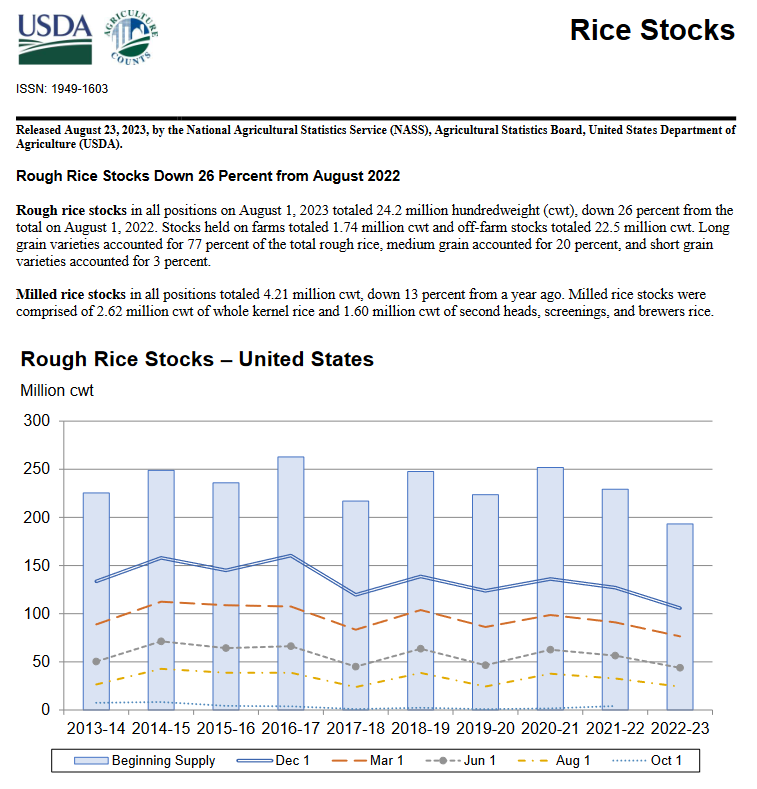
| Not sure why but rice stocks (rice in inventory) are way down on a year-over-year basis. |
International
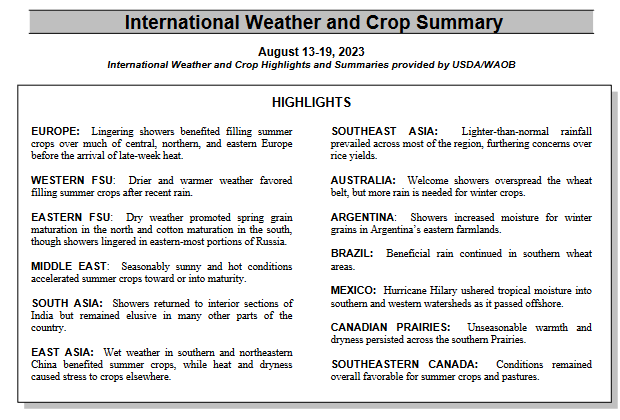
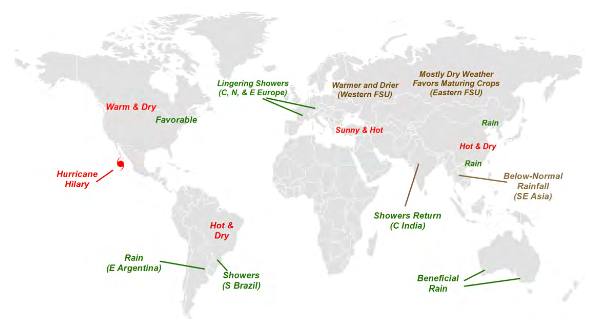
| And here is the map which was provided this week. Conditions were generally good other than Asia and the Canadian Prairies. |
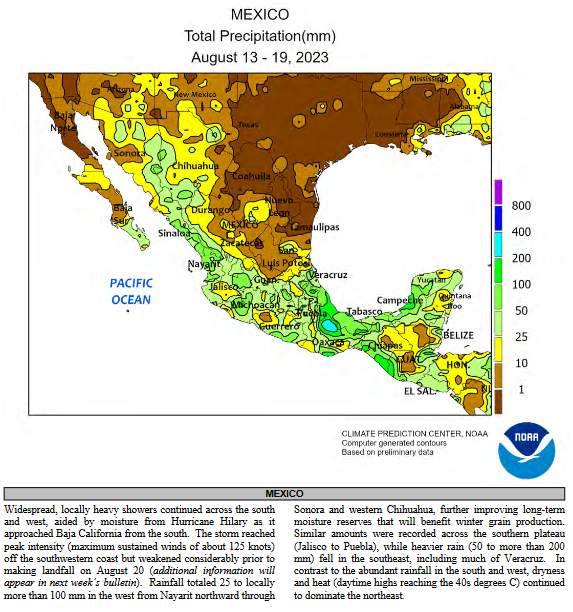
| I am showing Mexico because it informs us of the progress of the Sonoran Monsoon which seems to have been reinvigorated a bit in Mexico and is starting to impact CONUS to some extent. |
Sources of Information
Weekly Updates can be found HERE
and perhaps more directly HERE
Additional Useful Sources of Information
WASDE: World Agricultural Supply and Demand Estimates HERE
NASS Report Schedule HERE
Executive Briefings HERE
Economics and Prices HERE
Office of the Chief Economist HERE.
Drought information by crop HERE
–
| I hope you found this article interesting and useful. |