Here is what we are paying attention to in the next 48 to 72 hours. The article also includes weather maps for longer-term outlooks and a five-day World weather outlook.
We start with the U.S. Information. You can update this section here but these are 48 to 72-hour forecasts so if I have not been able to update this area twice daily, what is shown is still valid and the images in the body of the article update automatically but sometimes they are a bit slow to update.
Short Range Forecast Discussion
NWS Weather Prediction Center College Park MD
358 PM EDT Sun Aug 20 2023Valid 00Z Mon Aug 21 2023 – 00Z Wed Aug 23 2023
…There is a Slight to High Risk of excessive rainfall over parts of
Southern California, the Great Basin, and the Northern Intermountain
Region……There is a Slight Risk of severe thunderstorms over parts of
Southeastern California……There are Air Quality Warnings over the parts of the Pacific Northwest
and Northern/Central Rockies……Excessive Heat Warnings and Advisories from parts of the Plains, the
Mississippi Valley, and Central/Western Gulf Coast…
![]()
![[Image of WPC Flash Flooding/Excessive Rainfall Outlook]](https://www.nhc.noaa.gov/storm_graphics/EP09/refresh/EP0923WPCERO+gif/085022WPCERO_sm.gif) |
–
| Notices: Recently we published the ENSO Alert Update and you can access that article HERE. |
First, the 48-Hour Forecast (It is a 48 to 72 Hour Forecast actually)
Daily weather maps. The Day 1 map updates twice a day and the Day 2 and 3 maps update only once a day. These maps update automatically. But if that does not happen, you can get updates by clicking HERE
TODAY (or late in the day the evening/overnight map will appear)
TOMORROW
NEXT DAY
This animation shows how things may play out over the next 60 hours. To update click here.
The NWS Climate Prediction Center’s: Watches, Warnings, and Advisories plus other information can be found HERE. We post at least one of those updates daily, sometimes both. The Highlights are shown in the lede paragraph of this article.
ATMOSPHERIC RIVERS
This tells us what is approaching the West Coast. Click HERE to update If I have not gotten around to doing the update. Here is some useful information about Atmospheric Rivers.
Continuation of the NWS Short Range Forecast. It is updated by NWS twice a day and these updates can be found here
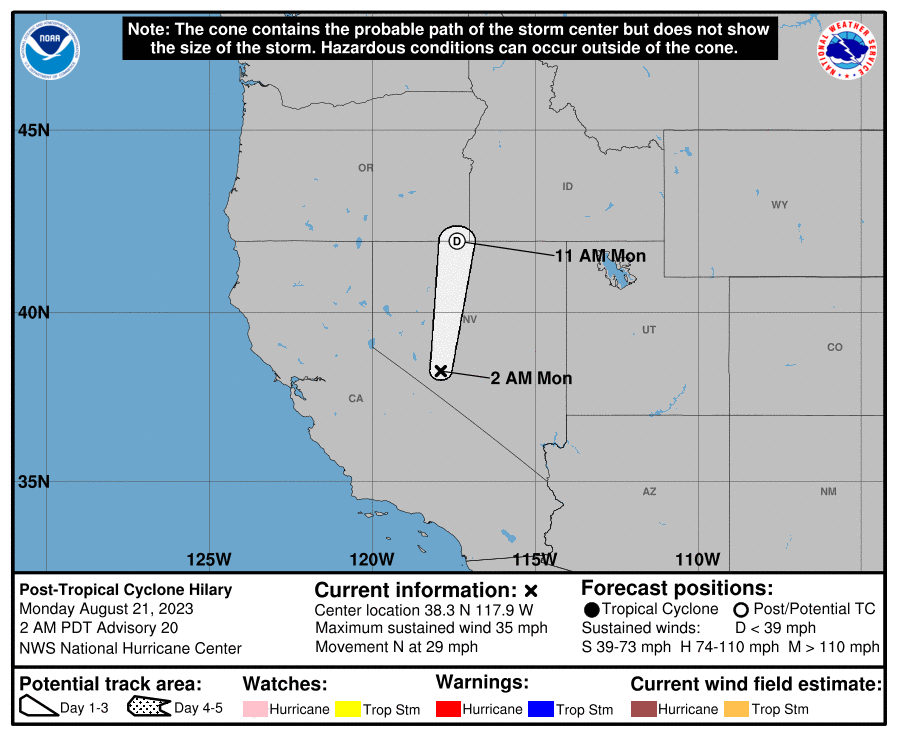
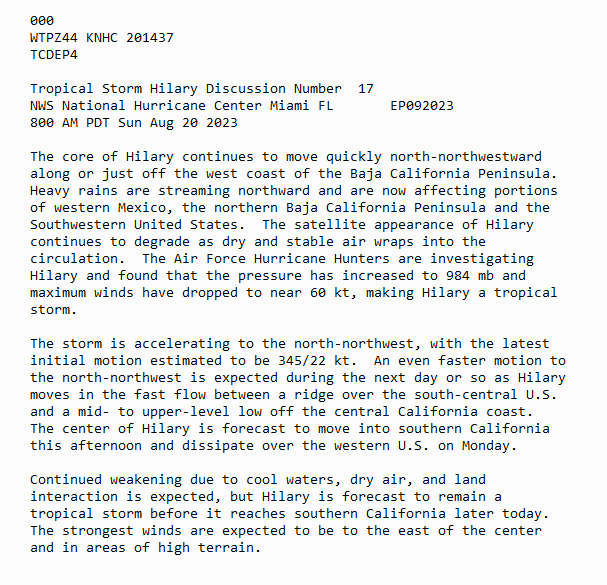
T.S. Hilary is forecast to move northward over Baja California Peninsula
on Sunday afternoon and into Southern California by late afternoon Sunday.
Hilary is then forecast to continue to move northward and dissipate over
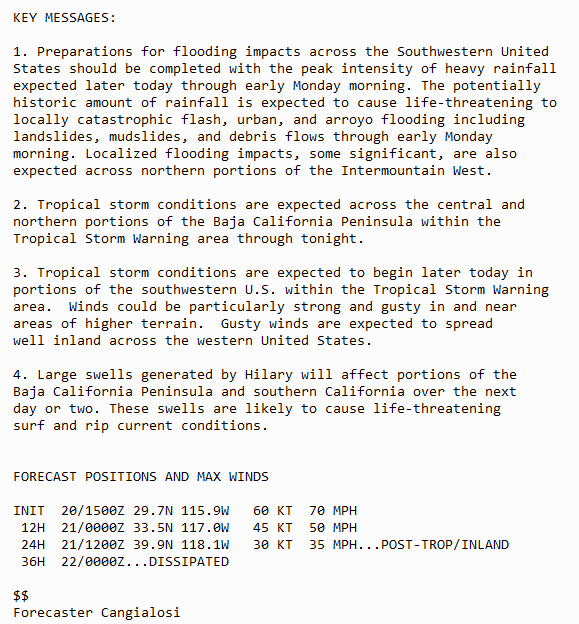
central Nevada on Monday. Hilary will also produce potentially historic
rainfall amounts expected to cause flash, urban, and steep-sided gully
flooding, including landslides, mudslides, and debris flows. Localized
flooding impacts, some significant, are also expected across northern
portions of the Intermountain West. Therefore, the WPC has issued a High
Risk of excessive rainfall over parts of Southern/Central California into
Monday morning. Severe, widespread flash flooding is expected. Areas that
normally do not experience flash flooding will flood. Lives and property
are in great danger through Monday.Hilary will also produce showers and severe thunderstorms over
Southeastern California. Therefore, the SPC has issued a Slight Risk of
severe thunderstorms over parts of Southeastern California through Monday
morning.The hazards associated with these thunderstorms are lightning, severe
thunderstorm wind gusts, a few tornadoes, and a minimal threat of hail.
The showers and thunderstorms will extend northward into the Northern
Intermountain Region, Northern Rockies, and Northern Plains through Monday
afternoon.The threat of excessive rainfall continues on Monday. Therefore, the WPC
has issued a Slight Risk of excessive rainfall over parts of California,
Great Basin, Southwest, Pacific Northwest, Northern Intermountain Region,
and Northern Rockies from Monday into Tuesday morning. The associated
heavy rain will create mainly localized areas of flash flooding, with
urban areas, roads, small streams, and burn scars the most vulnerable.In addition, the threat of severe thunderstorms decreases slightly on
Monday. On Monday, the associated moisture plume moves eastward into the
Southwest and Great Basin, producing strong to severe thunderstorms.
Therefore, the SPC has issued a Marginal Risk of severe thunderstorms over
parts of the Southwest, Great Basin, and Northern Rockies from Monday into
Tuesday morning. The hazards associated with these thunderstorms are
frequent lightning, severe thunderstorm wind gusts, hail, and a minimal
threat of tornadoes.The threat of excessive rainfall continues on Tuesday as the showers and
thunderstorms with heavy rain over parts of the Great Basin, Southwest,
and Northern Intermountain Region. Therefore, the WPC has issued a Slight
Risk of excessive rainfall with these thunderstorms over two regions, the
first area over parts of the Northern Intermountain Region and the second
over parts of the Great Basin on Tuesday. The associated heavy rain will
create mainly localized areas of flash flooding, with urban areas, roads,
small streams, and burn scars the most vulnerable. In addition, on
Tuesday, the threat of severe thunderstorms ends over the West.Furthermore, wildfire smoke over parts of the Pacific Northwest and
Northern/Central Rockies has prompted Air Quality Alerts over parts of the
Pacific Northwest and Northern/Central Rockies.Meanwhile, a front over the Great Lakes will move into the Northeast and
settle over the Mid-Atlantic parts by Tuesday. The system will produce
scattered showers and thunderstorms over parts of the Northeast on Monday
into Monday evening.In addition, upper-level energy and tropical moisture will move across the
Central Gulf Coast Sunday evening and Monday. The energy will produce
scattered showers and thunderstorms over parts of the region. Further,
onshore flow off the Atlantic will continue to produce showers and
thunderstorms over the southern tip of Florida through Tuesday.As the energy and tropical moisture moves over the Western Gulf Coast, the
system will produce showers and thunderstorms with heavy rain over parts
of south-central Texas. Therefore, the WPC has issued a Slight Risk of
excessive rainfall with these thunderstorms over parts of south-central
Texas on Tuesday. The associated heavy rain will create mainly localized
areas of flash flooding, with urban areas, roads, and small streams the
most vulnerable.Furthermore, an upper-level high over the Central Plains/Middle
Mississippi Valley will create oppressive daytime heat, limited overnight
cooling, which will also contribute to the effects of heat, prompting
Excessive Heat Warnings and Heat Advisories over portions of the
Central/Southern Plains, the Upper/Middle/Lower Mississippi Valley,
Central/Western Gulf Coast.In addition, dangerous heat will continue to intensify and expand into the
Plains states, with numerous daily high-temperature records expected,
especially in the Central Plains and Texas. The heat wave will then expand
early next week to include much of the Central and Southeast U.S. Some
locations in the Midwest may see their hottest day of the year so far this
weekend. Portions of the South Central U.S. and Gulf Coast may further
extend their record number of days with a heat index reading of at least
110�F.Moreover, the prolonged nature of the heat wave, combined with very warm
overnight temperatures, will limit the relief from the oppressive daytime
heat and compound overall heat impacts. Further, excessive heat is
anticipated to focus over the southeastern quadrant of the country next
week. The greatest risk of excessive heat is for eastern Texas and parts
of the Gulf Coast States.
Learn about wave patterns HERE.
Below is the current five-day cumulative forecast of precipitation (Updates can be found HERE)
Now we look at Intermediate-Term “Outlook” maps for three time periods. Days 6 – 10, Days 8 – 14, and Weeks 3 and 4. An outlook differs from a forecast based on how NOAA uses these terms in that an “outlook” presents information as deviation from normal and the likelihood of these deviations.
Below are the links to obtain updates and additional information. They are particularly useful if you happen to be reading this article significantly later than when it was published. I always try to provide readers with the source of the information in my articles.
| Days 6 – 10 (shown in Row 1) | Days 8 – 14 (Shown in Row 2) | Weeks 3 and 4 (Shown in Row 3 but updates only on Fridays) |
| https://www.cpc.ncep.noaa. gov/products/predictions/610day/ | https://www.cpc.ncep .noaa.gov/products/predictions/814day/ | https://www.cpc.ncep.noaa.gov/products/predictions/WK34/ |
Showing the actual maps. They should now update automatically. The Week 3 – 4 Outlook only updates on Fridays. So below is what I call the Intermediate-term outlook. On Fridays, it extends out 28 Days. That declines day by day so on Thursday it only looks out 22 days until the next day when the Week 3 – 4 Outlook is updated and this extends the outlook by one additional week.
| 6–
10
|
|
|
| 8–
14 |
|
|
| 3–
4 |
|
|
HAZARDS OUTLOOKS
Click here for the latest complete Day 3 -7 Hazards forecast which updates only on weekdays. Once a week probably Monday or Tuesday I will update the images. I provided the link for readers to get daily updates on weekdays. Use your own judgment to decide if you need to update these images. I update almost all the images Friday Night for the weekend edition of this Weather Report. So normally readers do not need to update these images but if the weather is changing quickly you may want to.
Temperature month to date can be found at https://hprcc.unl.edu/products/maps/acis/MonthTDeptUS.png
Precipitation month to date can be found at https://hprcc.unl.edu/products/maps/acis /MonthPNormUS.png
World Forecast
Below are the Day 1 -3 and 4-6 forecasts for temperature and precipitation. Updates and much additional information can be obtained HERE
World Temperature Anomalies
World Accumulated Precipitation
This information is provided by the University of Maine. They draw upon many different sources. There is a lot of information available at the link provided. I have just provided two useful forecasts. There are probably over a hundred different forecasts available from this source.
Worldwide Tropical Forecast (This is a NOAA Product)
This graphic updates on Tuesdays) If it has not been updated, you can get the update by clicking here Readers will only have to do that if they are reading this article much later than the date of it being published.
Information on Tropical Storms can be found HERE. Western Pacific information can be found HERE.
|
–
| I hope you found this article interesting and useful. |
–