On the third Thursday of the month right on schedule NOAA issued their updated Seasonal Outlook which I describe as their Four-Season Outlook because it extends a bit more than one year into the future.
Usually, we pay the most attention to the Mid-Month forecast for the next month which is September, the three-month Outlook for September through November and the Seasonal Drought Outlook.
Tonight I want to focus on the months beyond September through November 2023 In particular I want to focus on the winter months.
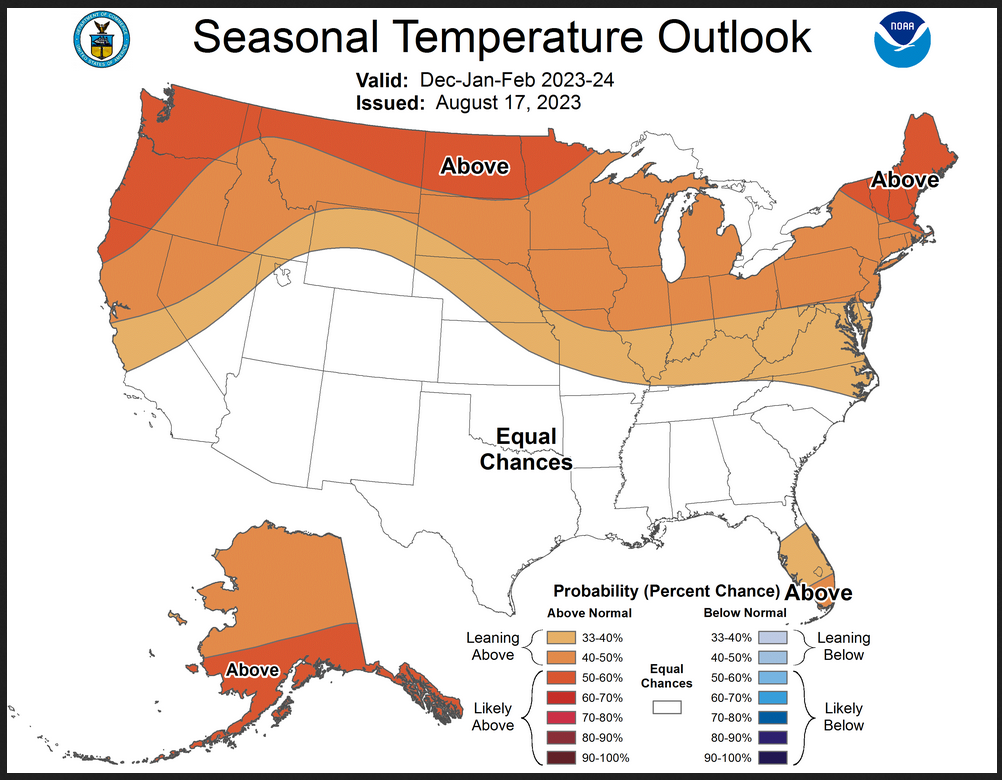
| NOAA is showing a warmer than normal Northern Tier and equal chances for the rest of CONUS other than Florida |
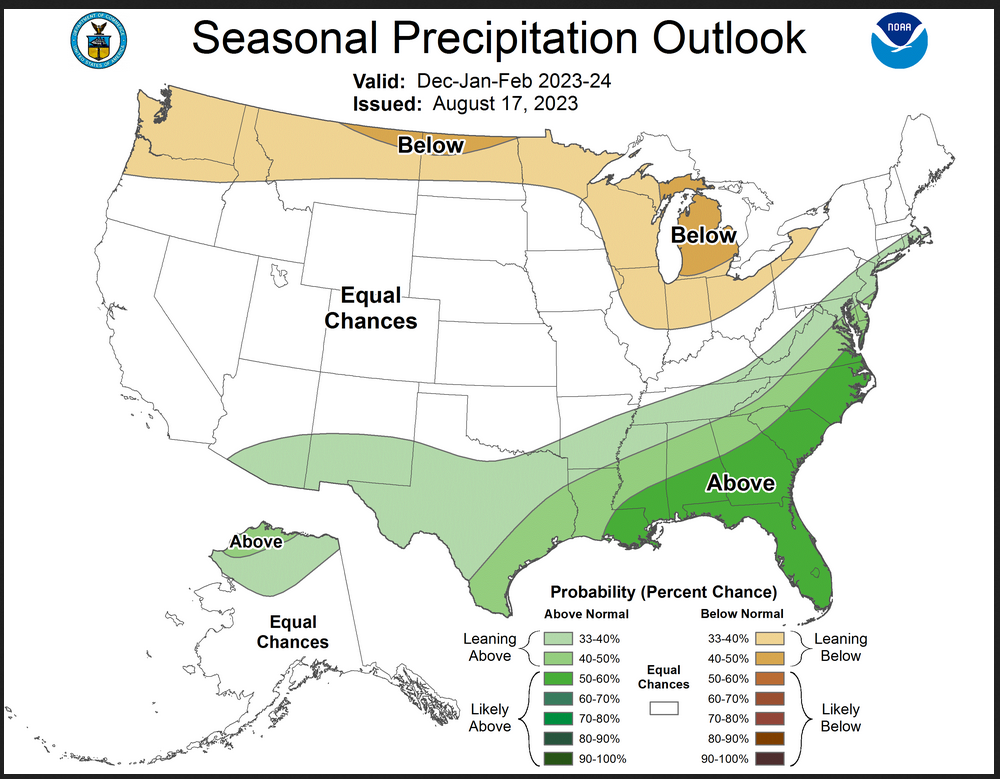
| NOAA is showing a dry extreme Northern Tier and a mostly wet Southern Tier and the Southeast. But what about the Colorado River Basin? Pretty much a normal year? What about New Mexico? If the Jet Stream is so far south that there will only be normal precipitation for Northern New Mexico and Colorado? That is not a good scenario for New Mexico. |

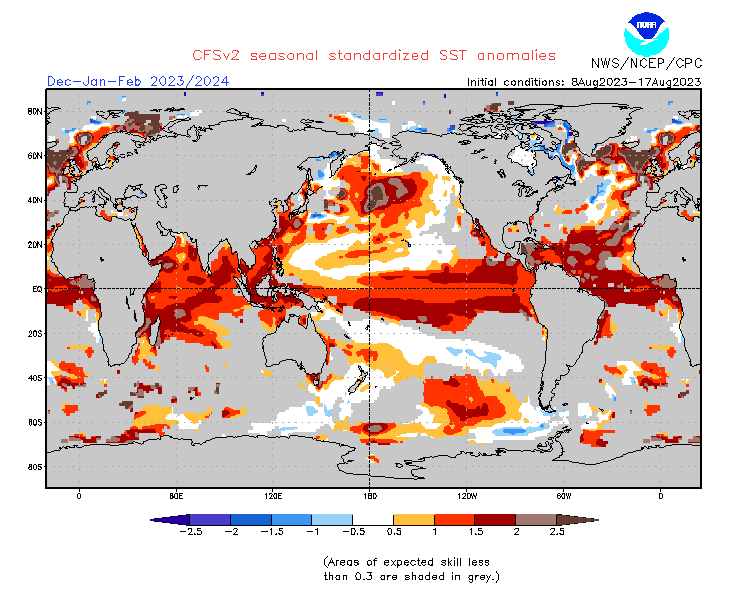
| The above is the NOAA forecast of Ocean Temperatures during the December/January/February period. You can definitely see the El Nino warm tongue extending from Equdor to the west. But where is the warmest water? Where is the most evaporation taking place? As an aside this is a strange-looking El Nino in terms of the distribution of the warm water at the surface. |
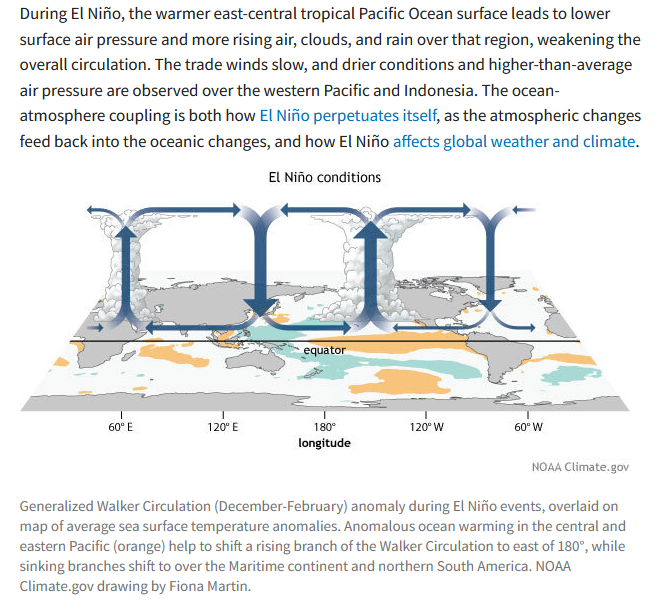
| The above is the typical El Nino pattern of the Walker Circulation. Notice the updraft where clouds are forming over warm water. Then look at the image above it. How confident are you that the Walker Circulation will look like the above? I could go into a number of other things but my point is how confident can we be in the NDJ maps that were provided to us? Please do not misunderstand. I am not criticizing NOAA. I am just pointing out how difficult it is to translate an ENSO forecast into a weather Outlook. What we are seeing in these maps is the canonical form of El Nino impacts combined with decadal trends. |
Here are the Twelve Temperature Maps. These are overlapping three-month maps (larger versions of these and other maps can be accessed HERE)
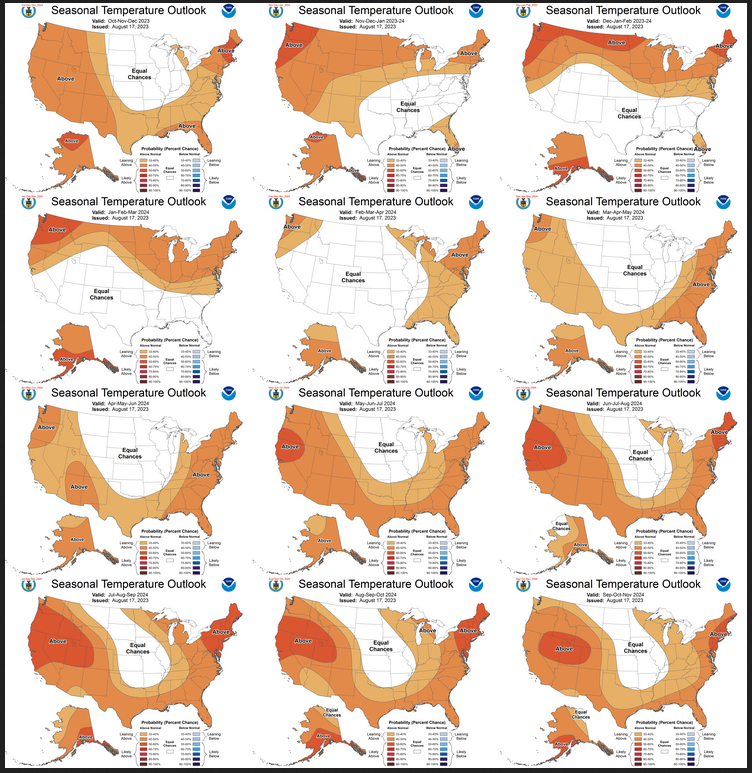
Notice that this presentation starts with October/November/December 2023 (OND) since SON is considered the near-term and is covered earlier in the presentation in our article from yesterday which you can access HERE. The changes over time are generally discussed in the discussion but you can see the changes easier in the maps.
Now the Twelve New Precipitation Maps
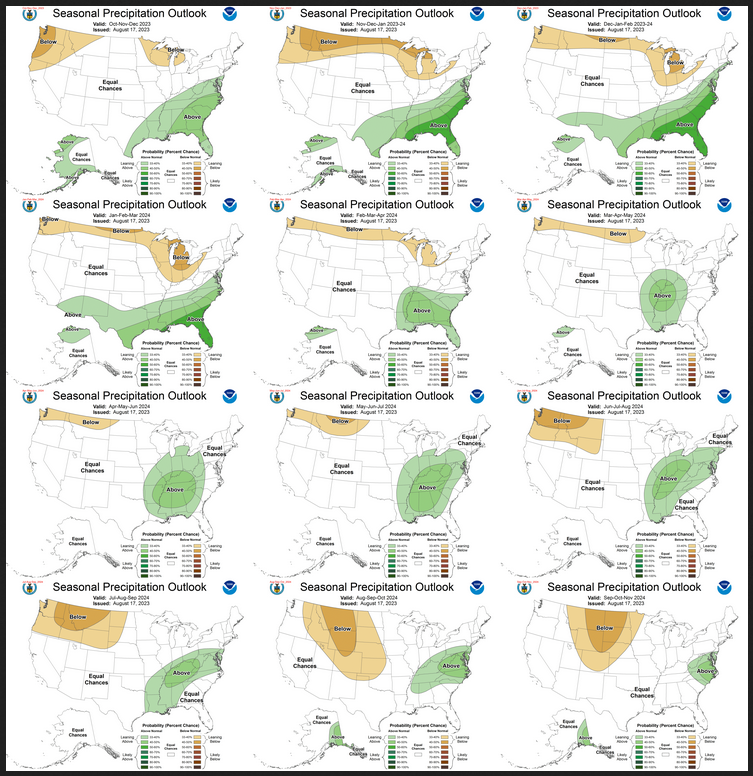
Similar to Temperature in terms of the organization of the twelve overlapping three-month outlooks.
Review of the ENSO Assumptions utilized by NOAA (CPC) in Preparing this Four-Season OutlookThe key information used by NOAA follows.
IRI CPC ENSO STATE Probability Distribution (IRI stands for the International Research Institute for Climate and Society)
Here are the new forecast probabilities. This information is released twice a month and the first release is based on a survey of Meteorologists, the second is based on model results. The probabilities are for three-month periods e.g. JAS stands for July/August/September. I am just showing the first release which is what we have and presumably what NOAA (actually their CPC Division) worked from.

| It looks like El Nino through the forecast period. It does start to reduce intensity in DJF 2023/2024 but this may simply be the higher level of uncertainty that far out into the future. This information is shown as bars but we do not see the confidence intervals for each three-month forecast. |
And we include one more graphic namely the NOAA proprietary ENSO model. It is not the primary tool that NOAA uses but we find it to be useful. We are allowing it to update, unlike the other images in this article. So if you look back at this article a year from now, this image will have been updated. In shorter time frames. it is a way to monitor ENSO.

| The image will update if you click HERE. This model is predicting a fairly strong El Nino lasting a while. This image shows the various model runs that have been made. So based on this model, the range of NINO 3.4 values might range from about 0.75 to 2.0 and there are varying results from other meteorological agencies. So we are pretty sure this will be an El Nino winter but not at all sure what the precipitation pattern will be. NOAA has presented its best guess. |
| I left out a lot more of the uncertainty in this sort of longer-term outlook. It tells us a lot and it tries to tell us the level of confidence we should have but NOAA has to present something that ordinary people can understand so they provide a pretty long discussion but it is not a book. But they do it each month and the reason for this is that things generally get clearer as we get closer to the event. |
–
| I hope you found this article interesting and useful. I hope it was thought stimulating. |
–