Here is what we are paying attention to in the next 48 to 72 hours. The article also includes weather maps for longer-term outlooks and a five-day World weather outlook.
We start with the U.S. Information. You can update this section here but these are 48 to 72-hour forecasts so if I have not been able to update this area twice daily, what is shown is still valid and the images in the body of the article update automatically but sometimes they are a bit slow to update.
Short Range Forecast Discussion
NWS Weather Prediction Center College Park MD
Fri Aug 18 2023
Valid 12Z Fri Aug 18 2023 – 12Z Sun Aug 20 2023…Heavy rainfall and flash flooding becoming more likely over parts of
the Southwest……Critical fire conditions expected from the Northwest to the northern
High Plains today……Dangerous heat redeveloping over the central U.S…..
![]()
| Notices: Recently we published the ENSO Alert Update and you can access that article HERE. |
First, the 48-Hour Forecast (It is a 48 to 72 Hour Forecast actually)
Daily weather maps. The Day 1 map updates twice a day and the Day 2 and 3 maps update only once a day. These maps update automatically. But if that does not happen, you can get updates by clicking HERE
TODAY (or late in the day the evening/overnight map will appear)
TOMORROW
NEXT DAY
This animation shows how things may play out over the next 60 hours. To update click here.
The NWS Climate Prediction Center’s: Watches, Warnings, and Advisories plus other information can be found HERE. We post at least one of those updates daily, sometimes both. The Highlights are shown in the lede paragraph of this article.
ATMOSPHERIC RIVERS
This tells us what is approaching the West Coast. Click HERE to update If I have not gotten around to doing the update. Here is some useful information about Atmospheric Rivers.
Continuation of the NWS Short Range Forecast. It is updated by NWS twice a day and these updates can be found here
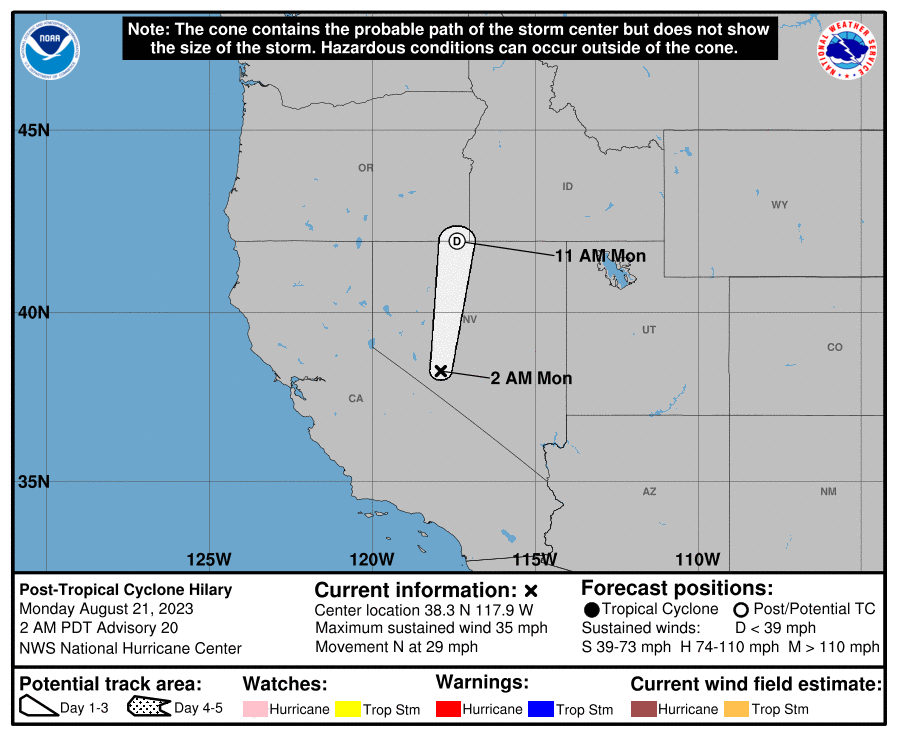
Monsoonal moisture along with tropical moisture associated with Hurricane
Hillary will begin to increase thunderstorm coverage across portions of
the Southwest today, with heavy rainfall and flash flooding possible. As
Hillary continues to track north in the eastern Pacific near Baja
California, the threat for heavy rainfall and flash flooding is likely to
increase on Saturday, especially for portions of Southern California,
western Arizona, and southern Nevada. With the increase in cloud cover,
temperatures will return to more seasonal values today before dropping
below normal across much of Southern California, western Arizona, and the
Great Basin over the weekend.Farther to the north, an area of low pressure is forecast to strengthen
over the Canadian Prairie. Windy and mostly dry conditions to its south
and southwest will lead to critical fire conditions extending from the
Inland Northwest to northeastern Montana today.Over the central U.S., dangerous heat will continue to intensify with
well-above normal to record-breaking temperatures expected from the
central Gulf Coast and lower Mississippi Valley to the northern High
Plains today. This heat will persist from the southern Plains to the
central Gulf Coast into the weekend while building across the central
Plains and shifting east across the northern Plains into the upper
Midwest. However, a cold front trailing the previously noted low over
Canada will bring relief to the northern High Plains over the weekend.In the eastern U.S., showers and thunderstorms with areas of heavy
rainfall will accompany an area of low pressure and its cold front as they
move across the Northeast today. Behind the front, high pressure with
seasonal to below-average temperatures will move from the Great Lakes and
Ohio Valley into the Northeast and Mid-Atlantic states today and Saturday.
The front is forecast to stall across the Southeast, where seasonal to
above-normal temperatures are forecast into the weekend.
Learn about wave patterns HERE.
Below is the current five-day cumulative forecast of precipitation (Updates can be found HERE)
Now we look at Intermediate-Term “Outlook” maps for three time periods. Days 6 – 10, Days 8 – 14, and Weeks 3 and 4. An outlook differs from a forecast based on how NOAA uses these terms in that an “outlook” presents information as deviation from normal and the likelihood of these deviations.
Below are the links to obtain updates and additional information. They are particularly useful if you happen to be reading this article significantly later than when it was published. I always try to provide readers with the source of the information in my articles.
| Days 6 – 10 (shown in Row 1) | Days 8 – 14 (Shown in Row 2) | Weeks 3 and 4 (Shown in Row 3 but updates only on Fridays) |
| https://www.cpc.ncep.noaa. gov/products/predictions/610day/ | https://www.cpc.ncep .noaa.gov/products/predictions/814day/ | https://www.cpc.ncep.noaa.gov/products/predictions/WK34/ |
Showing the actual maps. They should now update automatically. The Week 3 – 4 Outlook only updates on Fridays. So below is what I call the Intermediate-term outlook. On Fridays, it extends out 28 Days. That declines day by day so on Thursday it only looks out 22 days until the next day when the Week 3 – 4 Outlook is updated and this extends the outlook by one additional week.
| 6–
10
|
|
|
| 8–
14 |
|
|
| 3–
4 |
|
|
HAZARDS OUTLOOKS
Click here for the latest complete Day 3 -7 Hazards forecast which updates only on weekdays. Once a week probably Monday or Tuesday I will update the images. I provided the link for readers to get daily updates on weekdays. Use your own judgment to decide if you need to update these images. I update almost all the images Friday Night for the weekend edition of this Weather Report. So normally readers do not need to update these images but if the weather is changing quickly you may want to.
Temperature month to date can be found at https://hprcc.unl.edu/products/maps/acis/MonthTDeptUS.png
Precipitation month to date can be found at https://hprcc.unl.edu/products/maps/acis /MonthPNormUS.png
World Forecast
Below are the Day 1 -3 and 4-6 forecasts for temperature and precipitation. Updates and much additional information can be obtained HERE
World Temperature Anomalies
World Accumulated Precipitation
This information is provided by the University of Maine. They draw upon many different sources. There is a lot of information available at the link provided. I have just provided two useful forecasts. There are probably over a hundred different forecasts available from this source.
Worldwide Tropical Forecast (This is a NOAA Product)
This graphic updates on Tuesdays) If it has not been updated, you can get the update by clicking here Readers will only have to do that if they are reading this article much later than the date of it being published.
Information on Tropical Storms can be found HERE. Western Pacific information can be found HERE.
–
| I hope you found this article interesting and useful. |
–