Is Global Warming impacting the ENSO Cycle? A friend of mine posted an interesting post on this on Climate.Gov and I think it is worth discussing. But we really do not have the ability at this point in time to know if this is happening and if so why.
This introduces the ENSO BLOG post on Climate.gov. Here is the link to the full post.

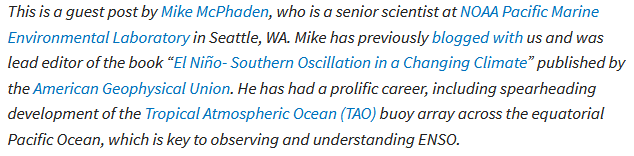
He provides two pieces of evidence. This is the one that resonated with me.

| Presumably, we see higher highs (El Nino) and lower lows (La Nina) since 1960. We do not seem to see higher highs and higher lows which one might expect with warmer oceans but all the values are anomalies that complicate things a lot. Actually, I am not 100% sure of exactly what this data represents. Presumably, it is the 5-month running mean minus the 1981- 2010 climatology. That is slightly different than the usual calculation of the value of the Nino 3.4 Index but it is challenging to compare current values to historical values as the temperature of the ocean surface increases. I will copy Mike McPhaden and ask him if I have described the above correctly – stay tuned. Trying to understand the impact of Global Warming is not simple. |
The Footnotes to the post provide useful information

I have been interested in this topic for some time. I discussed it in a talk I gave in 2017.
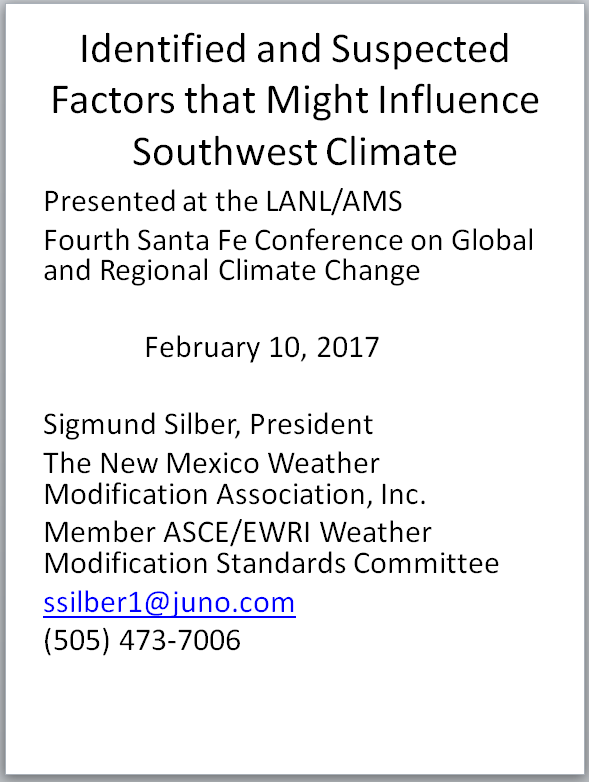
Here is a link to an article I wrote about my talk. One of the graphics does not seem to want to display but it is not very relevant to this discussion.
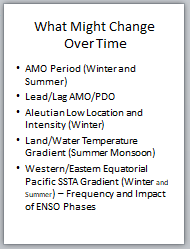
| It seemed to me that warmer oceans would reduce the gradient between the various parts of the Equatorial Pacific and could impact the cycle of El Nino to Neutral to La Nina to Neutral to El Nino etc. Slowing the transitions might indeed make the intensity of the phases more intense. But I wonder about the stronger La Ninas. |
There is another recent post that relates to this topic. Here is the Link to the article I wrote about that post.
New Experimental Forecast Addresses the Impact of Global Warming on Marine Heat Waves – July 17, 2023.
From that article two maps one showing the ocean temperature of oceans forecast for this September and another one stripping out the recent impact of Global Warming on the Oceans.

| The yellow and orange colors show what NOAA calls Marine Heat Waves. Of interest is the Atlantic Ocean which would be a major hurricane maker if not for the El Nino which blows the tops off of developing hurricanes. We expect to see the El Nino warm tongue off of Peru during an El Nino. But there are a lot of other areas that are yellow and orange but some of that is the IOD. I do not like the color coding that was used. I find the graphic confusing. I will get used to it. BTW it shows PDO Negative, unfortunately. |

–
| This is quite different and makes the point. But oceans are 3D and I prefer the way JAMSTEC handles it with layers of the ocean. NOAA probably does that as well but so far they have not figured out how to display it. And of course, 3D is difficult to display. I think they should show the legend with both graphics. |
| So what we have here is kind of a tease. There could be a change taking place. If it is taking place it could be caused by Global Warming or something else. So to me, all we have at this point is something to try to understand better. No firm conclusions can be drawn at this point. But it is something we need to study. Also, we have not talked at all about how the atmosphere reacts to the ocean temperature anomalies which used to be measured by the Southern Oscillation Index or SOI but there are other indices also used now. So in this article, we have only looked at part of the process albeit usually the more important part. Also, we have not looked at the possible impact of the Pacific Decadal Oscillation (PDO). The climate is very complicated. |
–
| I hope you found this article interesting and useful |
–