At the end of every month, NOAA updates its Outlook for the following month which in this case is July of 2023. We are reporting on that tonight.
There have been some significant changes in the Outlook for July and these are addressed in the NOAA Discussion so it is well worth reading. We highlighted some of the important statements within the NOAA Discussion. We also provided the prior Mid-Month Outlook for July for comparison. From the NOAA Discussion:
- El Niño is still present in the equatorial Pacific, and likely to remain in place for the entire month.
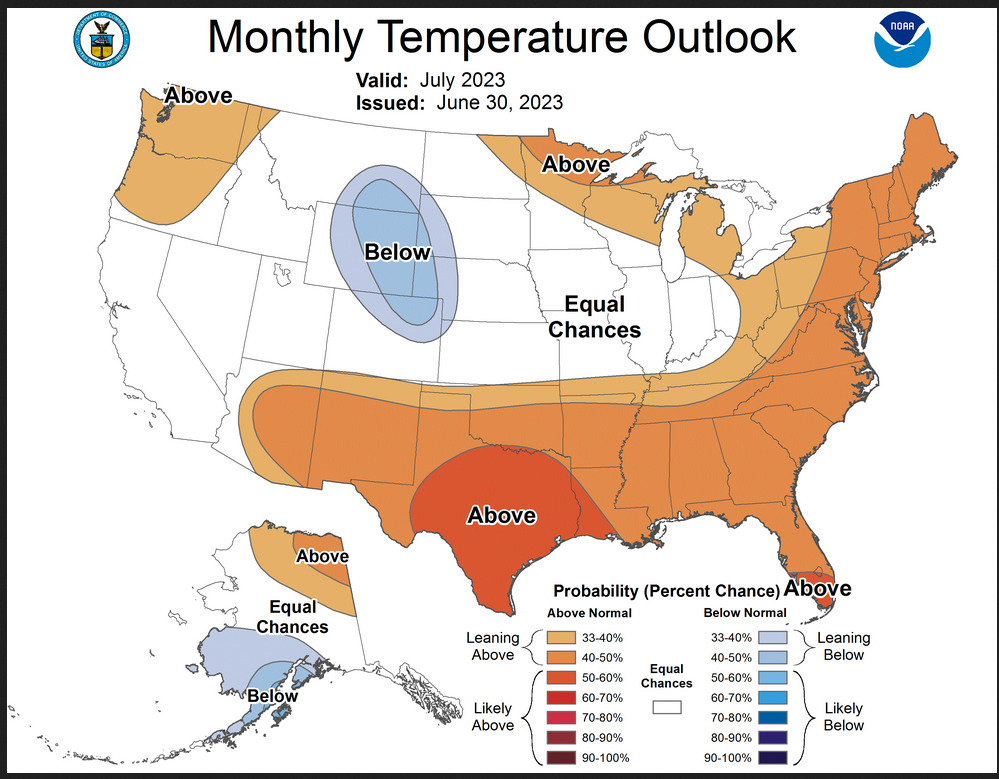
- For the temperature outlook, the largest changes from the mid-month outlook to the updated outlook extend from the Northern and Central Rockies to High Plains, and across southern Alaska.
- The outlook over the Northern and Central Rockies and High Plains now favors below-normal temperatures, largely influenced by the forecast conditions early in the month (Days 1-14).
- The probabilities for above-normal temperatures are decreased over the Mississippi and Ohio River Valleys, reflective of the latest official outlooks and model guidance.
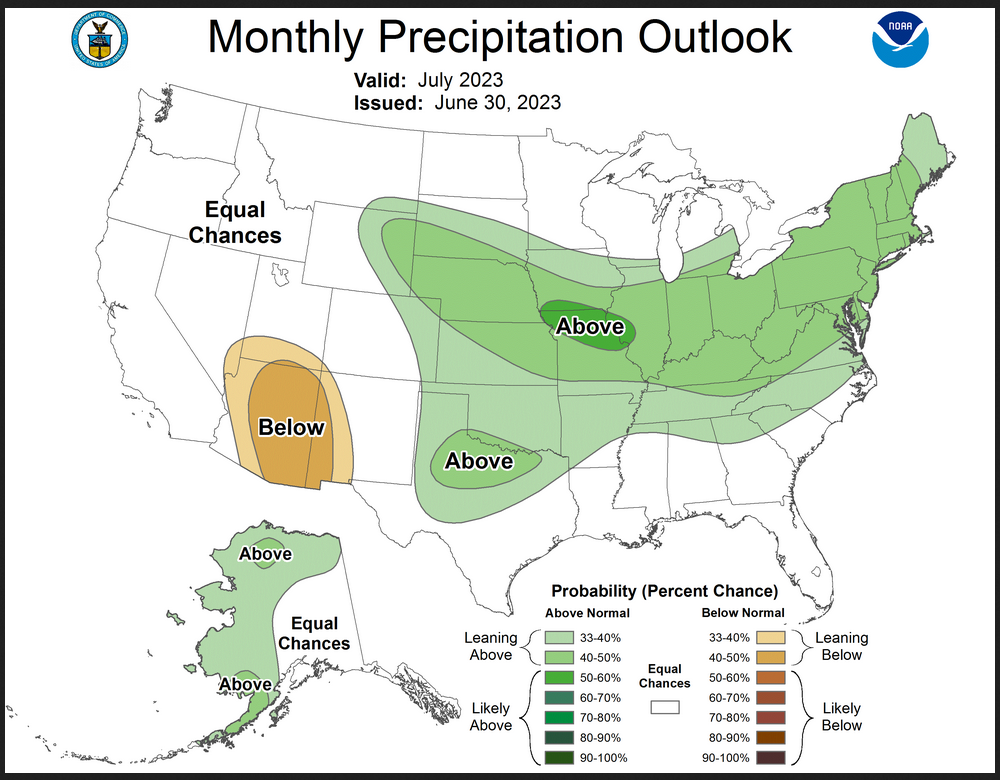
- The precipitation outlook for Alaska has changed to favoring above-normal precipitation from the Alaska Peninsula northward across western Alaska to the Brooks Ranges and along the northern coast.
- Hurricane Beatriz could trigger a monsoon moisture surge during the first half of July across the Southwest, so probabilities are mitigated compared to some model guidance.
- Stronger signals for above-normal precipitation are located over the Central Great Plains and Middle Mississippi Valley due to predicted rains in the first week exceeding the threshold for the below normal category on the monthly timescale.
- Small portions of Texas are also likely to exceed that threshold during the first week of July.
- During the remainder of the month, an active storm track is forecast from the Northern Rockies to the Ohio Valley and Northeast, which leads to enhanced probabilities of above-normal precipitation in those regions.
- During July, a pattern change favors widespread above-normal rainfall extending from the central Plains across the Corn Belt and Northeast, with enhanced rainfall possibly extending southward to the southern Appalachians and Piedmont.
It may be easier to just look at the maps than digest the above.
The article includes the Drought Outlook for July. NOAA also adjusted the previously issued Seasonal Drought Outlook to reflect the changes in the July Outlook. We have also included the current fire incidents (dramatically decreased) and four months of Wildland Fire Potential Outlooks and also a map showingthe water-year-to-date precipitation. We also provide the Week 2/3 Tropical Outlook for the World.
| Our regular Daily Weather article can be found HERE. In addition to the short-term forecast it also provides the 6 – 10 day, 8 – 14 day, and Week 3 – 4 Outlooks. That is not a full month but close to it. So it is helpful if one wants to understand how the full-month forecast is expected to vary through the month. And the maps in the Daily article update throughout the month. |
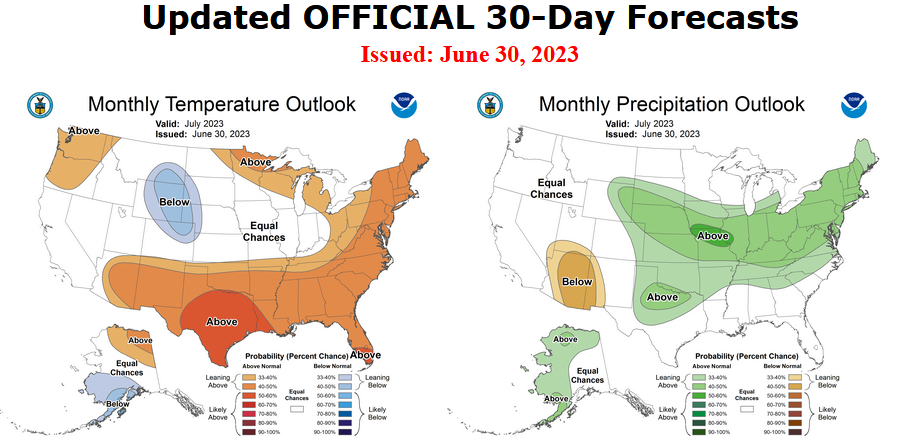
Here is the updated Outlook for July 2023
For Comparison Purposes, Here is the Mid-Month Outlook for July.
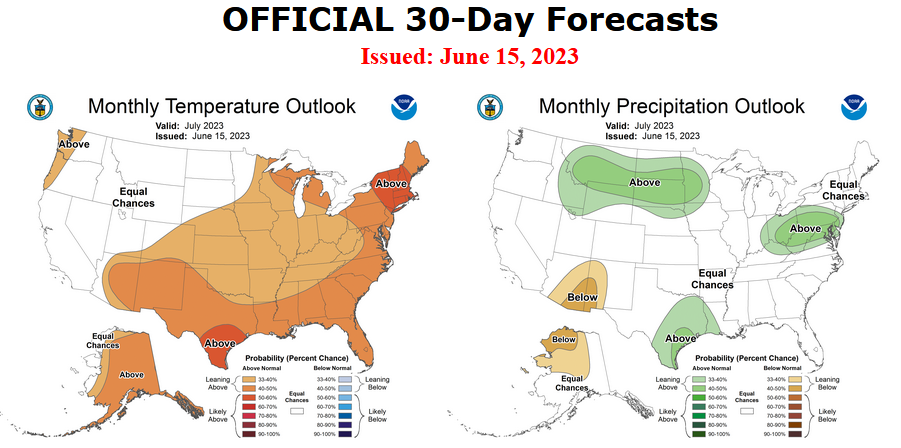
| There has been a significant to dramatic change. Remember, it is the top set of maps that are the current outlook for July. Looking at the Northern Tier we have a lot of changes. One actually expects the probabilities to increase since June 30 is a lot closer to July than June 15 was so there should be less uncertainty. |
Combination of the Updated Outlook for July and the Three-Month Outlook
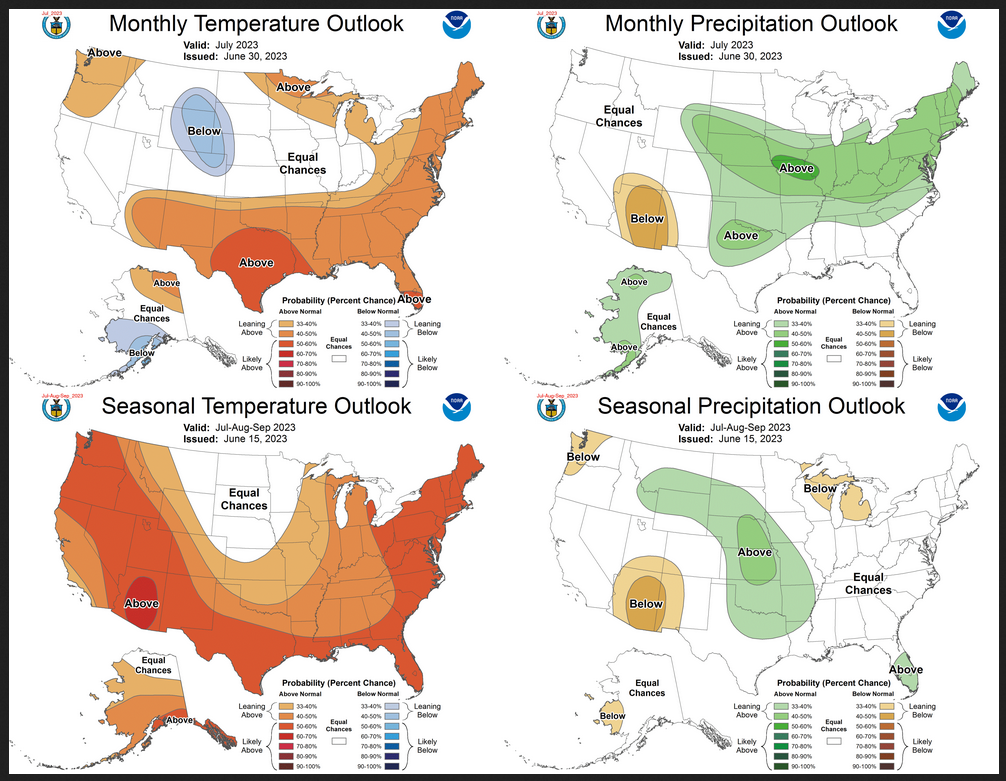
| Quite a substantial difference between July and the three-month period that includes July. The biggest changes are in the Northern Tier. |
ANALYSIS
| For both temperature and precipitation, if you assume the colors in the maps are assigned correctly, it is a simple algebra equation to solve the month two/three anomaly probability for a given location = (3XThree-Month Probability – Month One Probability)/2*. So you can derive the month two/three outlook this way. You can do that calculation easily for where you live or for the entire map. |
It is important to remember that the Outlook for next month was updated on the last day of the current month and the three-month Outlook was issued on the third Thursday. So the period of time between the Mid-Month and End of Month Update varies from month to month from 10 days to 16 days. So there sometimes is a substantial change in the Next Month’s Outlook from the Mid-Month prediction. In such cases, we wonder if a change in the one-month outlook suggests that the three-month outlook would need to also be adjusted. I think that in this case, the answer is that it might be wise to review that but it will not happen until the third Thursday in the coming month. We will get a hint of that a week earlier when the ENSO Update is issued on the Second Thursday of this coming month which is not far from now.
Here are larger versions of the Temperature and Precipitation Outlook maps.
NOAA (Really the National Weather Service Climate Prediction Division CPC) Discussion (I have shown certain important points in bold type. My comments if any are in brackets [ ])
30-DAY OUTLOOK DISCUSSION FOR JULY 2023
The updated temperature and precipitation outlooks for July 2023 are updated to reflect recent model guidance and incorporate the latest official outlooks from the Weather Prediction Center(WPC) for week-1, and those from the Climate Prediction Center (CPC) for further leads. El Niño is still present in the equatorial Pacific, and likely to remain in place for the entire month. The active phase of the Madden Julian Oscillation (MJO) is over the Indian Ocean, but of low amplitude and unlikely to have a major impact outside of influence on tropical cyclone formations potentially later in the month. Early month signals are likely to drastically change the soil moisture anomaly patterns over the Coterminous United States (CONUS), so the analogs based on those anomalies are not heavily weighted.
Temperature
For the temperature outlook, the largest changes from the mid-month outlook to the updated outlook extend from the Northern and Central Rockies to High Plains, and across southern Alaska. The outlook over the Northern and Central Rockies and High Plains now favors below-normal temperatures, largely influenced by the forecast conditions early in the month (Days 1-14). The probabilities for above-normal temperatures are decreased over the Mississippi and Ohio River Valleys, reflective of the latest official outlooks and model guidance. Some tools indicate above-normal temperatures over California and Nevada, while others indicate near or below-normal temperatures in the second half of the month, so equal chances of above, near, or below normal temperatures (EC) is indicated for those areas of disagreement among the tools. Across southern mainland Alaska and the Alaska Peninsula, troughing during the first half of the month could tip temperatures to the below-normal category, though some moderation is likely in the second half of the month.
Precipitation
The precipitation outlook for Alaska has changed to favoring above-normal precipitation from the Alaska Peninsula northward across western Alaska to the Brooks Ranges and along the northern coast. This is mainly a signal early in the month, but does remain with weak probabilities through the entire month. Over the CONUS, the monsoon rains are still expected to be below normal. Hurricane Beatriz could trigger a monsoon moisture surge during the first half of July across the Southwest, [Editor’s Note: not likely based on the track released by the NHC] so probabilities are mitigated compared to some model guidance. Stronger signals for above-normal precipitation are located over the Central Great Plains and Middle Mississippi Valley due to predicted rains in the first week exceeding the threshold for the below normal category on the monthly timescale. Small portions of Texas are also likely to exceed that threshold during the first week of July. During the remainder of the month, an active storm track is forecast from the Northern Rockies to the Ohio Valley and Northeast, which leads to enhanced probabilities of above-normal precipitation in those regions.
Drought Outlook
Here is the newly issued Drought Outlook for next month.
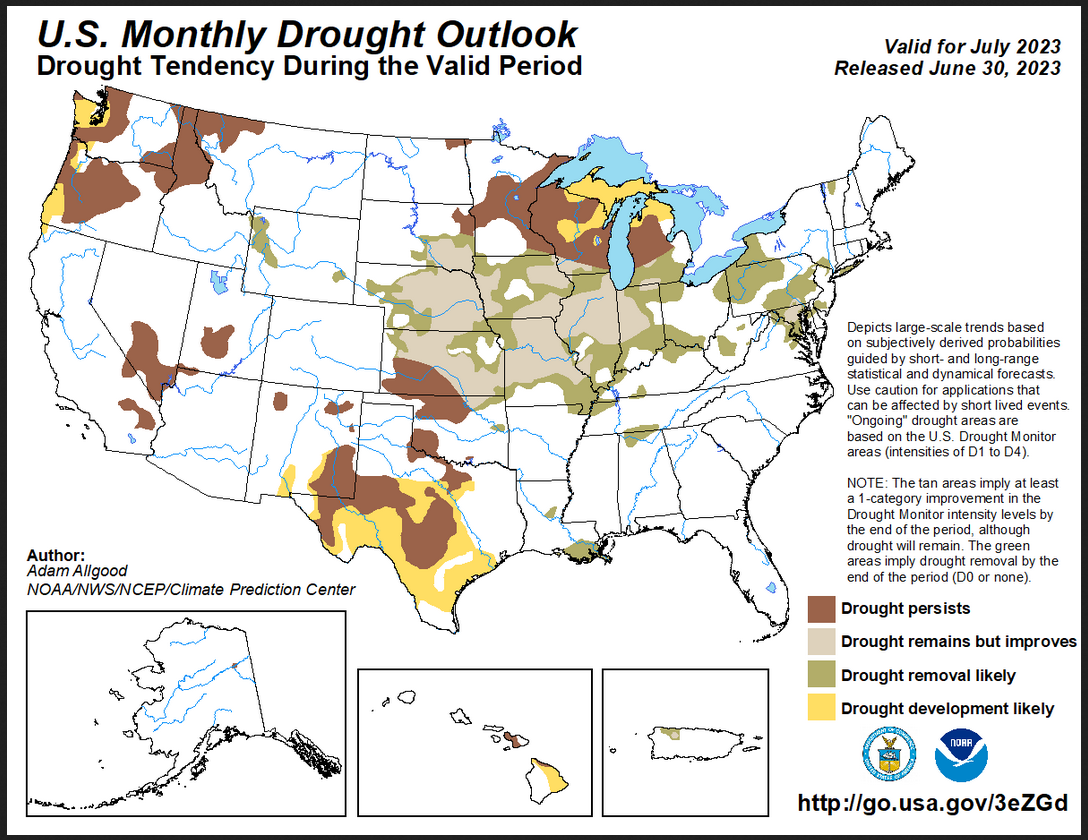
| You can see where drought development or reduction is likely. There is a significant reduction in the area that is forecast to be in drought. The summary and detailed discussions that accompany this graphic can be accessed HERE, but the short version is shown below. |
Here is the short version of the drought summary
Latest Monthly Assessment – During June, widespread convective activity across the western half of the contiguous US brought drought relief to the higher elevations of the Plains states and portions of the Intermountain West, though drought conditions expanded across parts of the Pacific Northwest following periods of above-normal temperatures that resulted in an early melting of a meager snowpack. In contrast, a blocking pattern resulted in persistent dryness across the Midwest and Northeast, which, despite a lack of extreme heat, caused widespread drought expansion. Drought also began to expand across parts of Texas during late June, as a heat dome brought dry conditions and excessive heat, while the onset of Florida’s seabreeze convective regime eliminated drought conditions across the state. During July, a pattern change favors widespread above-normal rainfall extending from the central Plains across the Corn Belt and Northeast, with enhanced rainfall possibly extending southward to the southern Appalachians and Piedmont. Based on this outlook, drought reductions are favored for portions of the Plains, the Corn Belt, and the entire Northeast region, with persistence maintained across the northern Mississippi Valley and southern Plains due to a more mixed signal. Dryness early in July may promote further drought expansion across the Great Lakes region, while persistent excessive heat and drier conditions favor more widespread drought expansion for Texas. Across the West, early monsoon activity is favored to be weak, which may cause some drought development across southern New Mexico, though favorable moisture remains across the Four Corners region. Some additional drought development is possible west of the Cascades. Outside of the contiguous US, drought persistence is favored for Alaska’s Yukon Flats due to a high sun angle this time of year and no clear wet signal. Drought expansion is favored for Hawaii, where El Niño conditions are associated with subsidence and reduced trade winds. In contrast, an active Atlantic pattern is favored to continue across the northern Caribbean, favoring drought reductions for Puerto Rico.
We also have an updated Seasonal Drought Outlook (link).
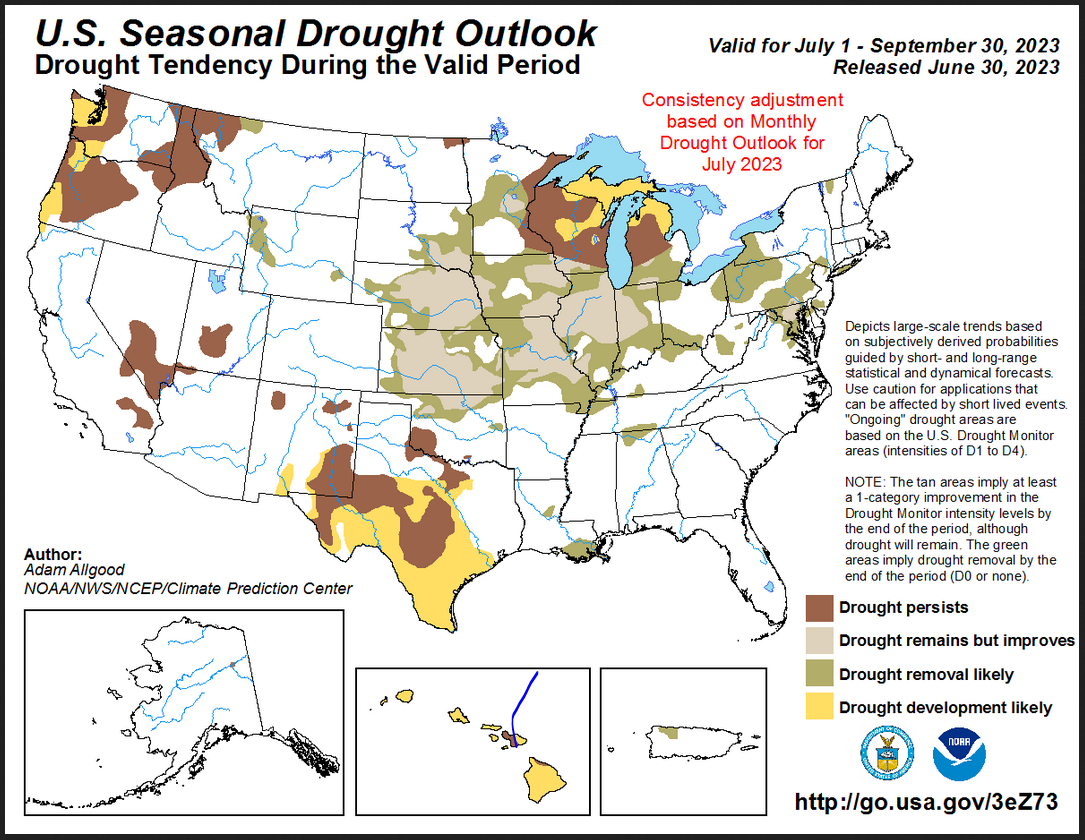
| I do not have confidence in this graphic because it is the same as the graphic for the single month of Julia so ignore it for now. |
| To update this forecast (which updates on Tuesdays) click HERE |
Month-to-date Temperature as the current month evolves can be found at https://hprcc.unl.edu/products/maps/acis/MonthTDeptUS.png
Month-to-date Precipitation as the current month evolves can be found at https://hprcc.unl.edu/products/maps/acis/MonthPNormUS.png
CLIMAS Podcast
No Podcast this Month
I wanted to show the stream flow. But I was only able to generate the June 1 graphic tonight. So I decided to show the water-year-to-date precipitation. Here is the LINK
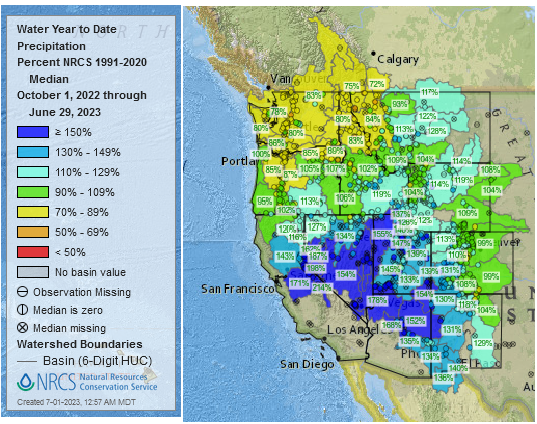
| This provides a very clear picture of the weather pattern since October 1, 2022. |
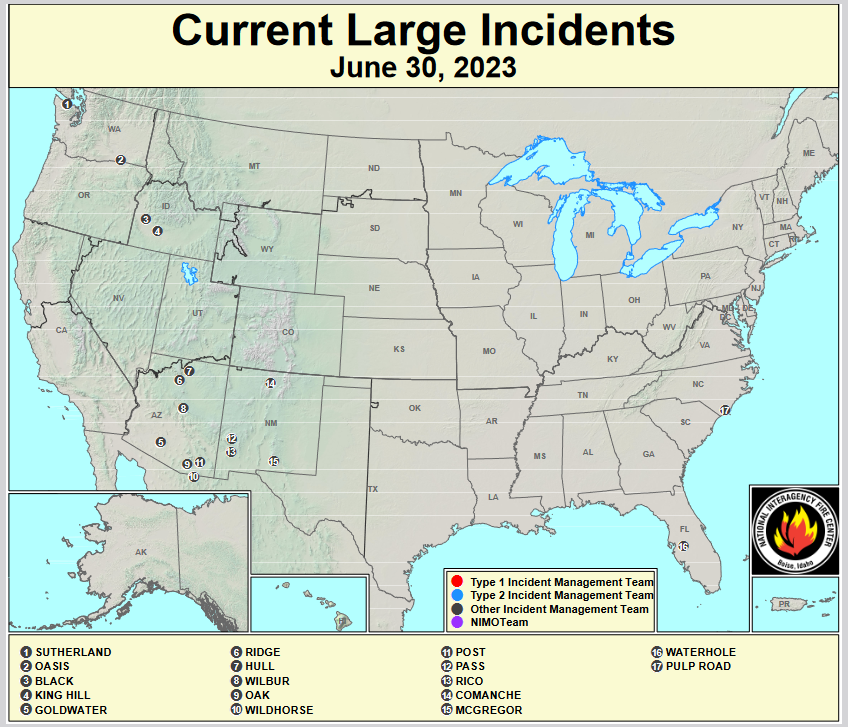
Fire Outlook: Current and Forecast
Updates to the major fire situation can be found by clicking here https://fsapps.n wcggov/afm/index.php
| The number of wildfires has increased slightly. This map does not include Canada where they are having a lot of problems with wildfires right now. |
Now looking at the wildland fire potential Outlooks. (Normally these maps will update in the afternoon of the first day of the month but sometimes it takes a couple of days).
July Wildfire Risks
August Wildfire Risks
September Wildfire Risks
October Wildfire Risks
| I hope you found this article interesting and useful |