Here is what we are paying attention to in the next 48 to 72 hours. The article also includes weather maps for longer-term outlooks and a five-day World weather forecast.
We start with the U.S. Information.
Short Range Forecast Discussion
NWS Weather Prediction Center College Park MD
Thu Jun 15 2023Valid 12Z Thu Jun 15 2023 – 12Z Sat Jun 17 2023
…Numerous severe thunderstorms expected today across parts of the
central and southern Plains……Additional chances for flash flooding and severe weather throughout the
central/eastern Gulf Coast and Southeast, as well as into the central High
Plains through Friday……Mid-June heat wave underway across much of Texas and the Deep South…
…Poor air quality due to Canadian wildfire smoke forecast over the
northern Plains and Midwest today…
![]()
| Information Note: This article is now set up so that all the maps should automatically update. The links are provided but should not be needed. The downside is that if you go back to a previous version the maps will have been updated and not be relevant to the date of the prior article but will be current information. The NWS twice-a-day 48-hour forecasts do not auto-update in this article. I do it and I can be late doing it. The link for the NWS updates is HERE. Most of our other articles will not be set up to auto-update so that prior versions of the article will be meaningful.
Recently, we published the World Agriculture Report. You can access this report HERE. We also published the June 1 Update of the Colorado and Eastern Great Basin. You can access that article HERE. Remember the easiest way to get back to the article you were reading is to hit the return arrow in the upper left of your screen. There are other ways. |
![]()
We start with the ENSO Alert System Update. We were asleep last week and got confused with May. The ENSO Alert status is updated on the second Thursday which was the 8th of this month the earliest in the month it can be. We will provide the full report later but for now the two key slides.
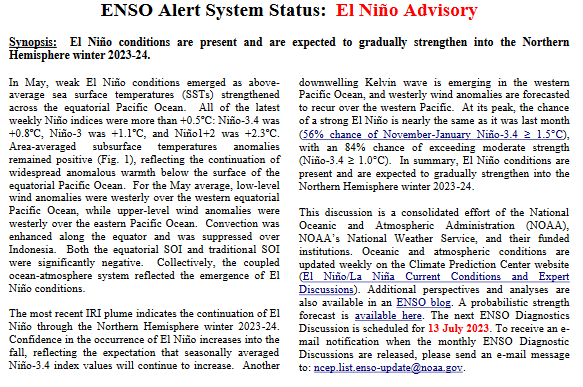
| The key here is the statement “At its peak, the chance of a strong El Niño is nearly the same as it was last month (56% chance of November-January Niño-3.4 ≥ 1.5°C), with an 84% chance of exceeding moderate strength (Niño-3.4 ≥ 1.0°C)”. Get ready. |
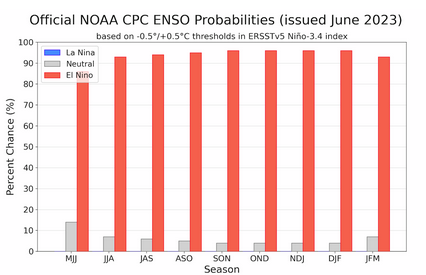
| At this point, the real question is about the Spring of next year. |
Back to current weather, first, the 48-Hour Forecast (It is a 48 to 72 Hour Forecast actually)
Daily weather maps. The Day 1 map updates twice a day and the Day 2 and 3 maps update only once a day. These maps update automatically. But if that does not happen, you can get updates by clicking HERE
TODAY (or late in the day the evening/overnight map will appear)
TOMORROW
NEXT DAY
This animation shows how things may play out over the next 60 hours. To update click here.
The NWS Climate Prediction Center’s: Watches, Warnings, and Advisories plus other information can be found HERE.
ATMOSPHERIC RIVERS
This tells us what is approaching the West Coast. Click HERE to update If I have not gotten around to doing the update. Here is some useful information about Atmospheric Rivers.
Continuation of the NWS Short Range Forecast. It is updated by NWS twice a day and these updates can be found here. We post at least one of those updates daily, sometimes both. The Highlights are shown in the lede paragraph of this article.
A very active weather pattern impacting much of the Nation with numerous
types of hazardous weather is anticipated to continue through the start of
this weekend. Headlining the busy June weather pattern is the threat of
significant severe thunderstorms throughout parts of the central and
southern Plains today, with severe weather and heavy rain chances also
extending into the eastern Gulf Coast. A shortwave trough ejecting into
the southern High Plains this afternoon combined with a sharp dry line and
lifting warm front over the southern Plains will aid in providing an
environment conducive for several developing severe thunderstorms across
southwest Kansas, western Oklahoma, and the far northeastern Texas
Panhandle. These thunderstorms are then forecast to race southeastward by
late this afternoon into central Oklahoma. The severe hazards associated
with these expected storms include hailstones greater than 2 inches in
diameter, wind gusts above 80 mph, and a few tornadoes. The Storm
Prediction Center has issued a Moderate Risk (level 4/5) of severe
thunderstorms to further highlight this threat.Farther east and to the south of a lingering frontal boundary, ongoing
thunderstorm activity and redevelopment later today will create additional
chances for flash flooding and severe weather from the central/eastern
Gulf Coast to parts of southern Georgia and northern Florida. With ample
atmospheric moisture content in place from the nearby Gulf of Mexico,
thunderstorms will be capable of containing intense rainfall rates while
exhibiting slow forward motion at times. These factors combined with
recent rainfall saturating soils across parts of the region could lead to
an increasing flash flood risk from central Mississippi to the
Georgia-Florida border. A Slight Risk (level 2/4) of Excessive Rainfall
remains in effect for the region. A few storms throughout the central and
eastern Gulf Coast may also be capable of containing damaging wind gusts,
large hail, and a few tornadoes today. The active weather will not
conclude tonight as another round of intense thunderstorms are possible on
Friday, while extending farther northwest into the Lower Mississippi
Valley as well. Damaging wind gusts and large hail could accompany the
developing thunderstorms, as well as a renewed threat for scattered flash
flooding. Elsewhere, slow-moving and localized severe storms along an
approaching cold front may impact parts the Rockies and central High
Plains through the end of the week. Saturated soils across Wyoming,
Colorado, and western Kansas may increase the flash flooding threat
somewhat. Thus, a Slight Risk (level 2/4) has been issued for today across
parts of Wyoming and on Friday across the central High Plains.It wouldn’t be an active summer weather pattern without oppressive heat
and much of Texas and the Deep South will have plenty heading into the
beginning of the holiday weekend. A building upper-level ridge over South
Texas will allow for dangerously hot temperatures and high humidity across
much of the Lone Star State (outside of the Texas Panhandle). Sultry heat
indices up to 110 degrees will also extend east into southern Louisiana.
High temperatures into the triple digits and upper-90s could exceed daily
high temperatures records for the next few days throughout the region. The
highest heat indices are forecast across South Texas, where it could feel
as hot as 120 degrees. This ongoing summer heat wave isn’t expected to let
up and likely to continue well into next week. Additionally, South Florida
will also endure some mid-June heat through at least Friday as highs reach
into the mid-90s, with heat indices as high as 110 degrees. Residents and
visitors within regions impacted by excessive heat are urged to follow
proper heat safety; such as staying hydrated, limiting time outdoors, and
checking in on any vulnerable friends, family, and neighbors.For the northern half of the Lower 48, upper-level troughs over the
Northeast, Great Lakes, and Northwest will offer scattered shower and
thunderstorm chances through Saturday. A few severe thunderstorms are
possible along and near a developing surface low pressure system and cold
front across the Ohio Valley today, before the isolated damaging wind gust
and hail threat shifts to the Mid-Atlantic on Friday. However, the likely
more widespread impact associated with the weather pattern over the
Northeast and Great Lakes will be associated with the influx of
near-surface wildfire smoke throughout the northern Plains and Midwest
thanks to northerly flow out of Canada. Air Quality Alerts have been
issued throughout Minnesota and Wisconsin, with smoke also forecast to
enter parts of Iowa and northern Illinois today. For areas impacted by
reduced air quality due to wildfire smoke, residents and visitors should
limit prolonged or heavy exertion outdoors.
Learn about wave patterns HERE.
Below is the current five-day cumulative forecast of precipitation (Updates can be found HERE)
Now we look at Intermediate-Term “Outlook” maps for three time periods. Days 6 – 10, Days 8 – 14, and Weeks 3 and 4. An outlook differs from a forecast based on how NOAA uses these terms in that an “outlook” presents information as deviation from normal and the likelihood of these deviations.
Below are the links to obtain updates and additional information. They are particularly useful if you happen to be reading this article significantly later than when it was published. I always try to provide readers with the source of the information in my articles.
| Days 6 – 10 (shown in Row 1) | Days 8 – 14 (Shown in Row 2) | Weeks 3 and 4 (Shown in Row 3 but updates only on Fridays) |
| https://www.cpc.ncep.noaa. gov/products/predictions/610day/ | https://www.cpc.ncep .noaa.gov/products/predictions/814day/ | https://www.cpc.ncep.noaa.gov/products/predictions/WK34/ |
Showing the actual maps. They should now update automatically. The Week 3 – 4 Outlook only updates on Fridays. So below is what I call the Intermediate-term outlook. On Fridays, it extends out 28 Days. That declines day by day so on Thursday it only looks out 22 days until the next day when the Week 3 – 4 Outlook is updated and this extends the outlook by one additional week.
| 6
– 10
|
|
|
| 8
– 14 |
|
|
| 3
– 4 |
|
|
HAZARDS OUTLOOKS
Click here for the latest complete Day 3 -7 Hazards forecast which updates only on weekdays. Once a week probably Monday or Tuesday I will update the images. I provided the link for readers to get daily updates on weekdays. Use your own judgment to decide if you need to update these images. I update almost all the images Friday Night for the weekend edition of this Weather Report. So normally readers do not need to update these images but if the weather is changing quickly you may want to.
Temperature month to date can be found at https://hprcc.unl.edu/products/maps/acis/MonthTDeptUS.png
Precipitation month to date can be found at https://hprcc.unl.edu/products/maps/acis /MonthPNormUS.png
World Forecast
Below are the Day 1 -3 and 4-6 forecasts for temperature and precipitation. Updates and much additional information can be obtained HERE
World Temperature Anomalies
World Accumulated Precipitation
This information is provided by the University of Maine. They draw upon many different sources. There is a lot of information available at the link provided. I have just provided two useful forecasts. There are probably over a hundred different forecasts available from this source.
Worldwide Tropical Forecast (This is a NOAA Product)
This graphic updates on Tuesdays) If it has not been updated, you can get the update by clicking here Readers will only have to do that if they are reading this article much later than the date of it being published.
–
Information on Tropical Storms can be found HERE. Western Pacific information can be found HERE.


–
| I hope you found this article interesting and useful. |
–