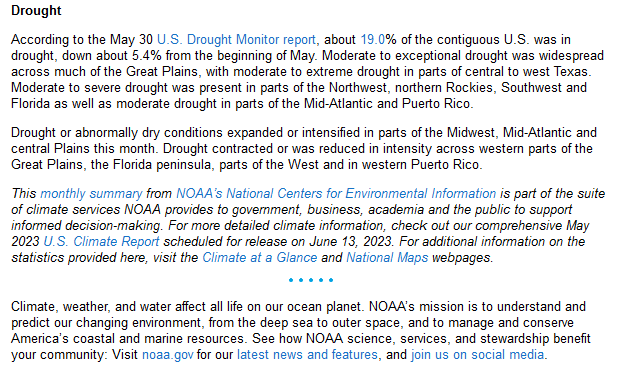
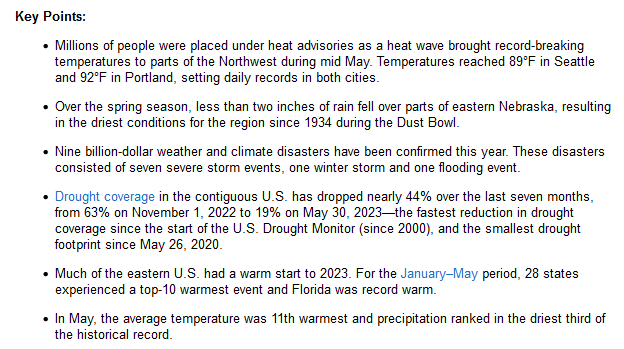
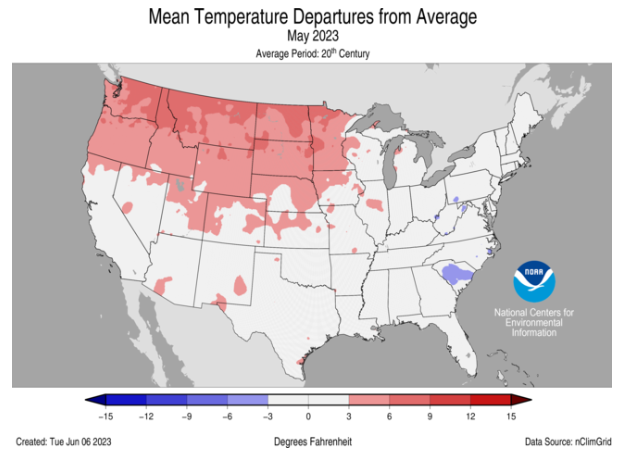
Every month NOAA takes a look at the prior month and sends me an email with their analysis. I am showing their full email report and I have added some additional images which support the report issued by NOAA. Some pretty interesting weather for May of 2023. This report also looks at the three-month period March through May which is meteorological spring. There has been a blocking pattern for some time which at least partially explains the west/east divide in the temperature and precipitation patterns. The NOAA report is very good and the state ranking graphics I added help to understand what has taken place as ENSO Neutral has tried to become El Nino.

| To a certain extent, the overall situation with Carbon Dioxide in the Atmosphere is relevant to this discussion thus the article on the Keeling Curve might be of interest to readers and can be accessed HERE. |


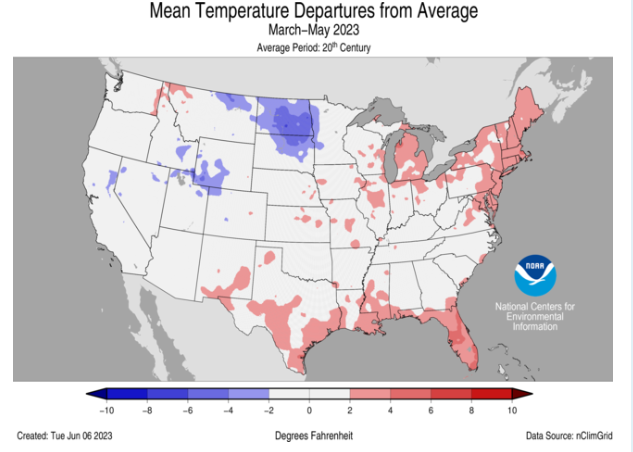
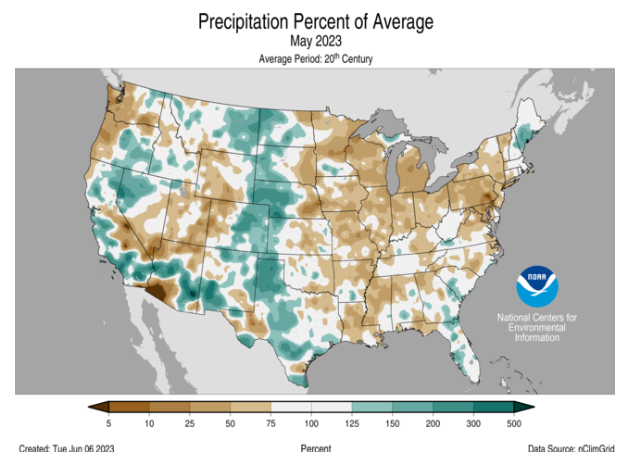

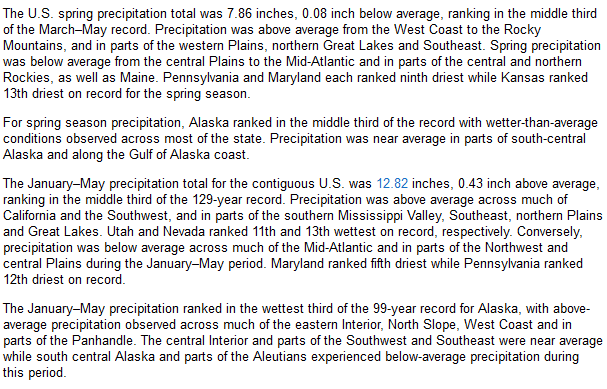

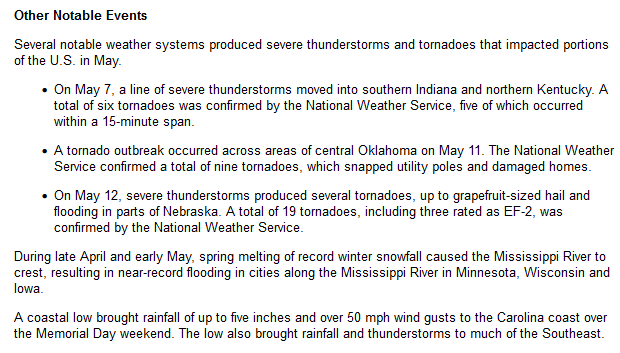
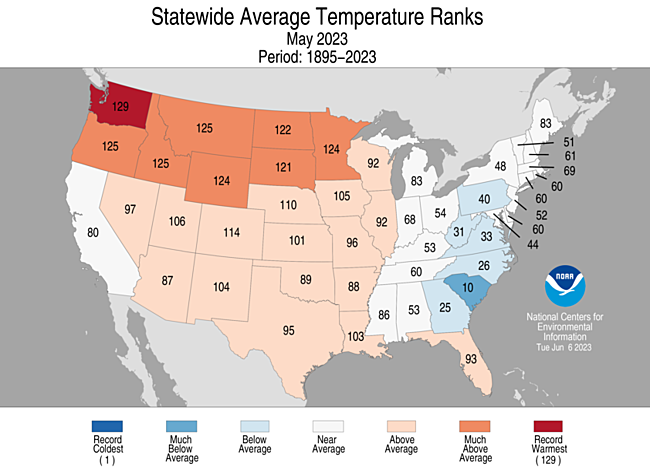
Some Additional Information: Looking at the state rankings the conditions for each state are ranked relative to the most recent 129 years of data. So for temperature, if it is the warmest in that history it gets ranked 129th, and if it is the coldest it gets ranked 1st.
| We had a record broken in Washington State. You also can see a north/south divide and a west/east divide. |
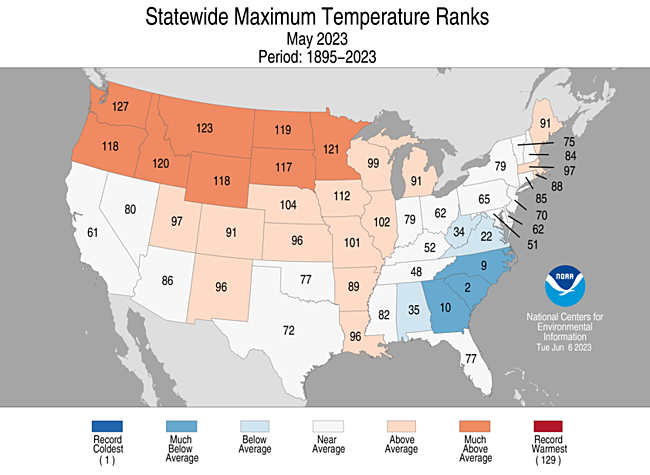
| You can see the extremes. No records but 2nd and 127th are close to records. When you are looking at maximum temperature rather than average temperature there is a lot of similarity but the ranking is usually a bit different. You still see the north/south divide and the west/east divide. |
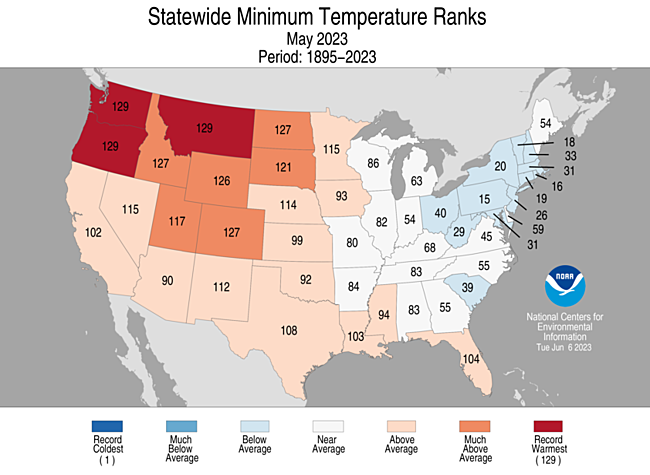
| Looking at minimums there were three record breakers. I will be interested in the precipitation as usually, low humidity allows for overnight lows to be extreme. |
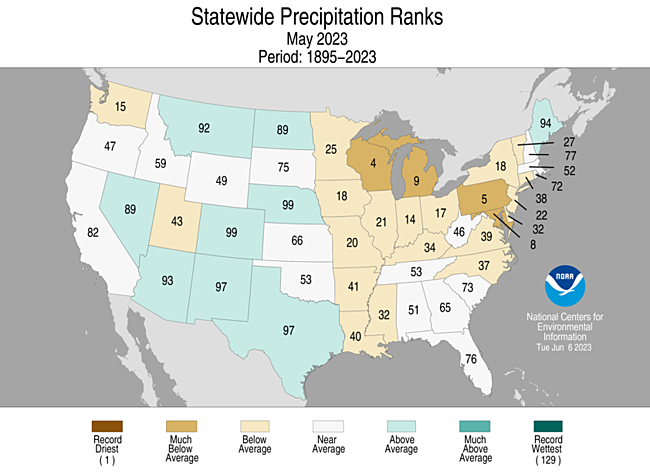
| Yes, Washington State was fairly dry and four states were quite dry. We certainly see the west/east divide and to some extent the north/south divide. |
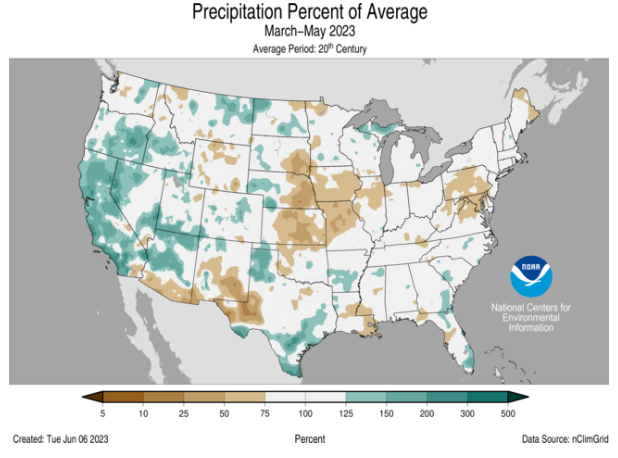
Now we will look at the rankings over a three-month period which is meteorological spring.
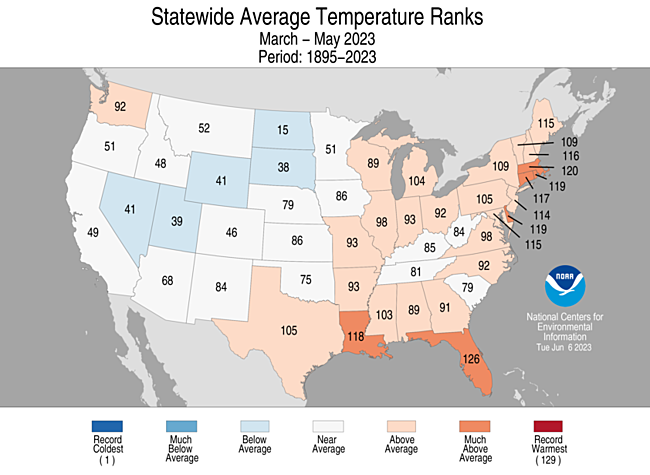
| Five pretty warm states and different from the May ranking. Obviously, May was very different from the three-month period that included May. |
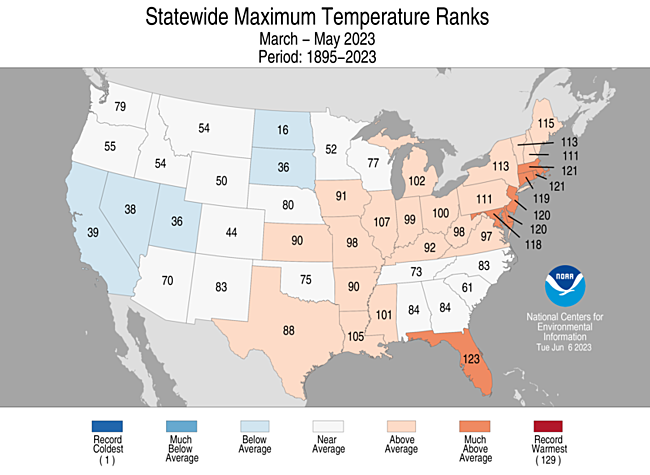
| Six pretty warm states. |
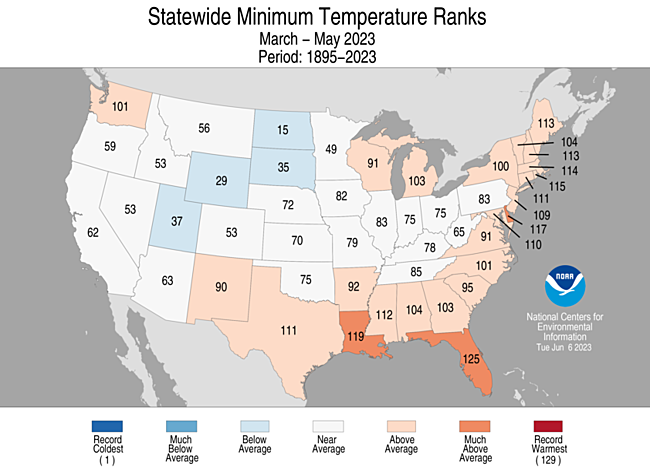
| Three very warm states. Now we see why they report average, maximum, and minimum temperatures. |
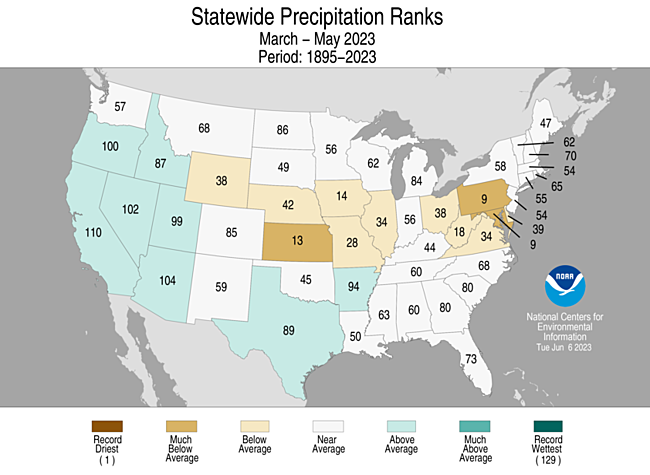
| Looks like three states were much below average in precipitation (with respect to their 129-year record) with most states pretty much in the middle. |
–
| I hope you found this article interesting and useful. |
–
