At the end of every month, NOAA updates its Outlook for the following month which in this case is June of 2023. We are reporting on that tonight.
There have been some significant changes in the Outlook for June and these are addressed in the NOAA Discussion so it is well worth reading. We highlighted some of the important statements within the NOAA Discussion. We also provided the prior Mid-Month Outlook for June for comparison. From the NOAA Discussion:
- The MJO is expected to provide a favorable large-scale environment for tropical cyclone (TC) development across the East Pacific during early June.
- Typhoon Maway , currently located to the east of Taiwan, is forecast to recurve northeastward over the Northwest Pacific.
- Dynamical models generally depict a persistent, anomalous 500-hPa ridge over the higher latitudes of west-central North America into the latter half of June which supports increased probabilities for above-normal temperatures from the Pacific Northwest and Northern Rockies east to the Midwest.
- 30-day precipitation deficits range from 2 to 5 inches across the Corn Belt where low topsoil [Editor’s note: probably referring to moisture] is present.
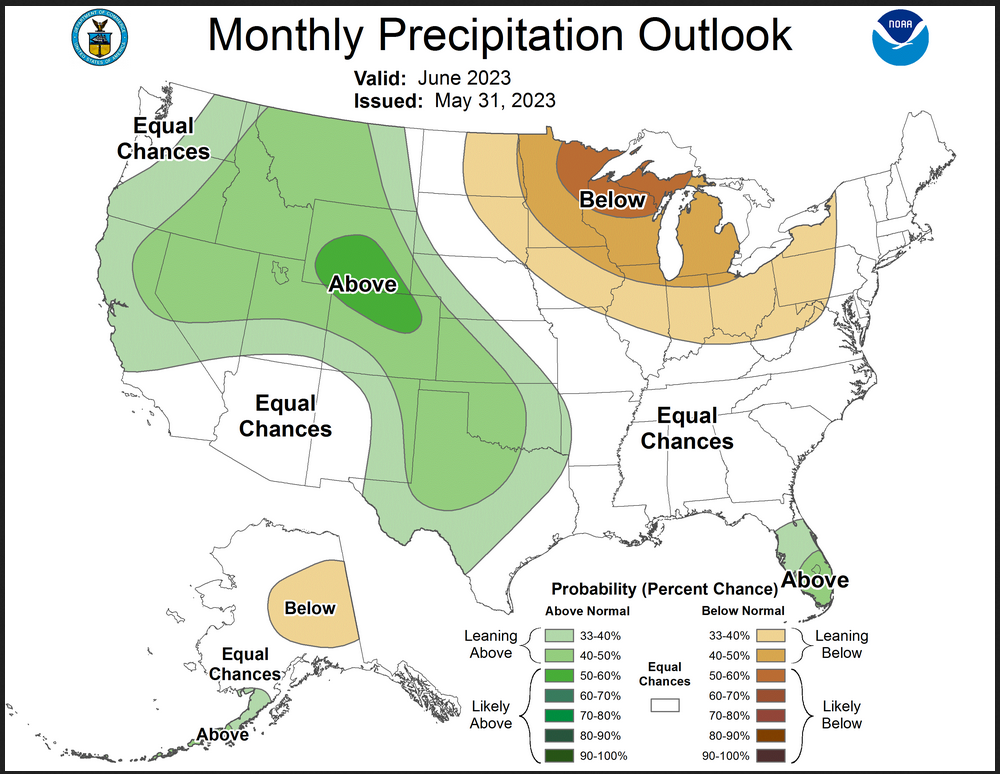
- Positive SST anomalies over the Gulf of Mexico along with forecasted above normal temperatures in week 3-4 tools, tilts the forecast toward above normal across Florida and along the Gulf Coast.
- Increased probabilities for below-normal temperatures are forecast for the Central to Southern High Plains, Southwest, and southern California.
- Below-normal precipitation across the Midwest. This favored dryness extends east to the Central Appalachians
- Wetter-than-normal conditions especially across the interior West, High Plains, and Southern Great Plains where increased probabilities for above-normal precipitation are forecast for the month
- A wet start to the month is likely across the Florida Peninsula.
- The largest change in the revised precipitation outlook was made to Alaska as most recent model guidance has backed off the dry signal initially forecast for southeastern Alaska.
It is probably easier to just look at the maps than digest the above.
The article includes the Drought Outlook for June. NOAA also adjusted the previously issued Seasonal Drought Outlook to reflect the changes in the June Outlook. We have also included the current fire incidents (dramatically decreased) and four months of Wildland Fire Potential Outlooks and also a map showing the current snowpack in the West and the water-year-to-date precipitation. We also provide the Week 2/3 Tropical Outlook for the World.
| Our regular Daily Weather article can be found HERE. In addition to the short-term forecast it also provides the 6 – 10 day, 8 – 14 day, and Week 3 – 4 Outlooks. That is not a full month but close to it. So it is helpful if one wants to understand how the full-month forecast is expected to vary through the month. And the maps in the Daily article update throughout the month. |
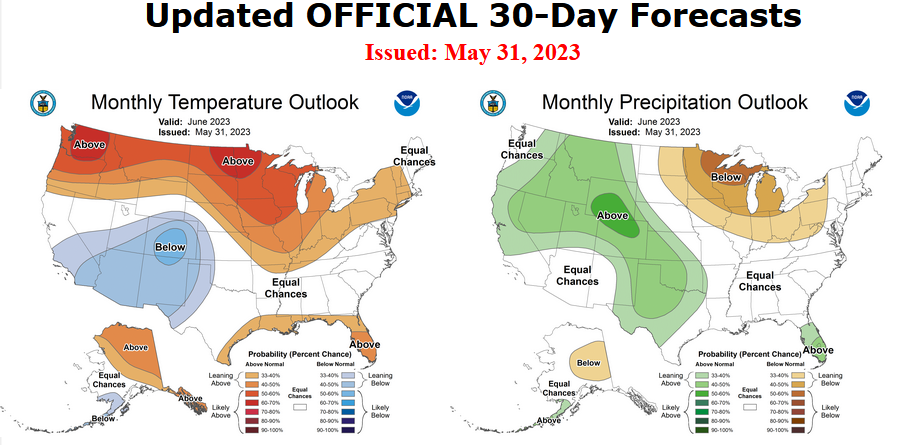
Here is the updated Outlook for June, 2023
For Comparison Purposes, Here is the Mid-Month Outlook for June.

| There has been a very substantial change. Remember, it is the top set of maps that are the current outlook for June. A major change is the reversal in New Mexico from warm to cold relative to normal. That is a big change in less than two weeks. One actually expects the probabilities to increase since May 31 is a lot closer to June than May 18 was. But looking at the Northern Tier we have a lot of high probabilities shown. |
Combination of the Updated Outlook for June and the Three-Month Outlook
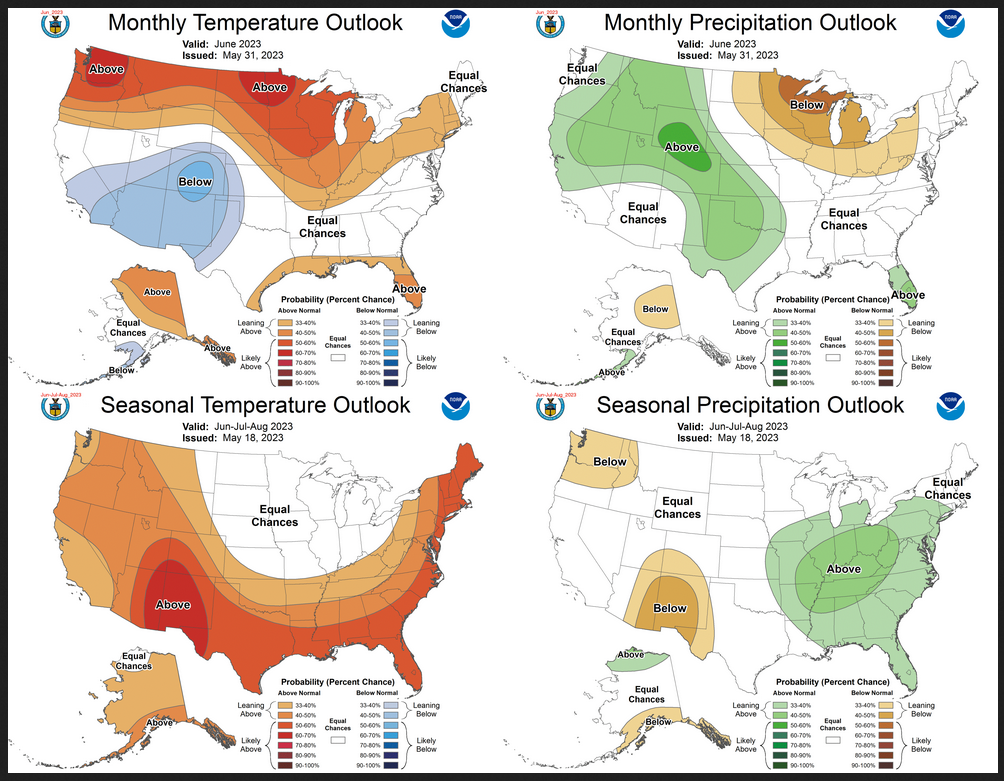
| Quite a dramatic difference between June and the three-month period that includes June. |
ANALYSIS
| For both temperature and precipitation, if you assume the colors in the maps are assigned correctly, it is a simple algebra equation to solve the month two/three anomaly probability for a given location = (3XThree-Month Probability – Month One Probability)/2*. So you can derive the month two/three outlook this way. You can do that calculation easily for where you live or for the entire map. |
It is important to remember that the Outlook for next month was updated on the last day of the current month and the three-month Outlook was issued on the third Thursday. So the period of time between the Mid-Month and End of Month Update varies from month to month from 10 days to 16 days. So there sometimes is a substantial change in the Next Month’s Outlook from the Mid-Month prediction. In such cases, we wonder if a change in the one-month outlook suggests that the three-month outlook would need to also be adjusted. I think that in this case, the answer is that it might be wise to review that but it will not happen until the third Thursday in the coming month. We will get a hint of that a week earlier when the ENSO Update is issued on the Second Thursday of this coming month which is not far from now.
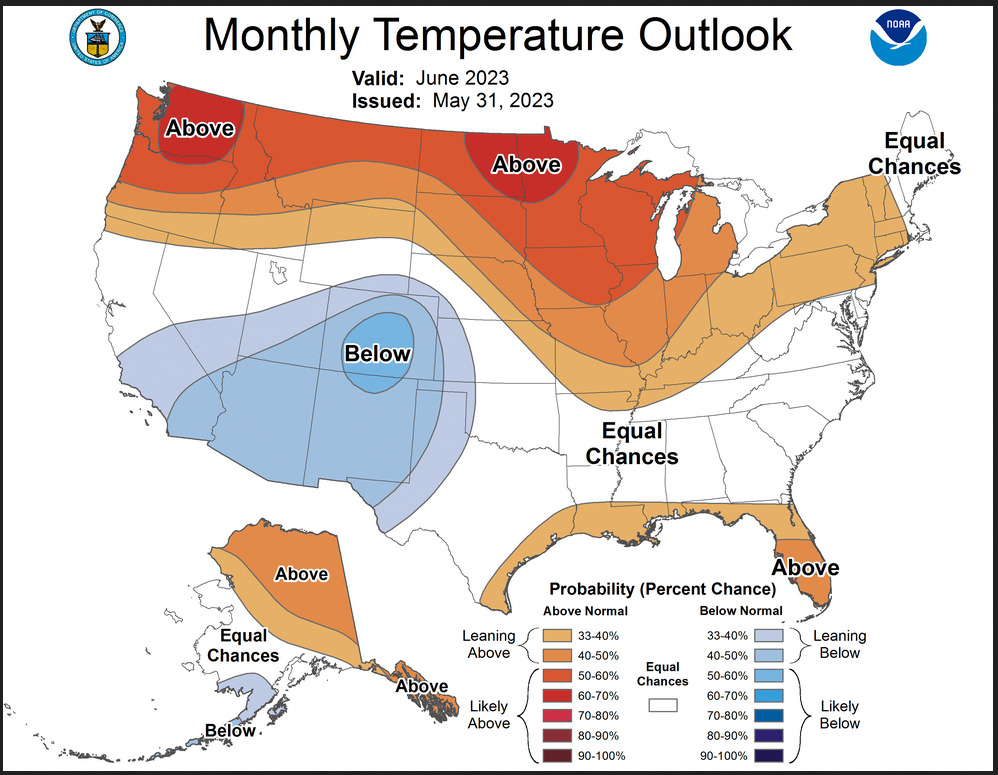
Here are larger versions of the Temperature and Precipitation Outlook maps
NOAA (Really the National Weather Service Climate Prediction Division CPC) Discussion (I have shown certain important points in bold type. My comments if any are in brackets [ ])
30-DAY OUTLOOK DISCUSSION FOR JUNE 2023
The updated June temperature and precipitation outlooks are based on the latest dynamical models, WPC temperature and precipitation forecasts during the first week of the month, the CPC 6-10/8-14 day temperature and precipitation outlooks, and the week 3-4 dynamical models (valid June 14-27). Sea surface temperature (SST) anomalies and soil moisture conditions were used for the temperature outlook. The Madden-Julian Oscillation (MJO) eastward propagation recently slowed as its enhanced phase entered the Western Hemisphere. The MJO is expected to provide a favorable large-scale environment for tropical cyclone (TC) development across the East Pacific during early June. The National Hurricane Center is currently monitoring a trough of low pressure over the Gulf of Mexico. Regardless of development, this disturbance could result in heavy precipitation across the Florida Peninsula at the beginning of June. Later in the month, large uncertainty exists on the MJO evolution and its related influences as a transition to El Niño is well underway.
Typhoon Mawar, currently located to the east of Taiwan, is forecast to recurve northeastward over the Northwest Pacific. This predicted model track of the extratropical low pressure system is likely to contribute to an amplified 500-hPa trough (ridge) over the Aleutians (western North America) during early to mid-June. This predicted longwave pattern along with the latest model guidance favors below-normal temperatures across the Aleutians and Alaska Peninsula with above-normal temperatures more likely for southeastern Alaska and northern Mainland Alaska. Dynamical models generally depict a persistent, anomalous 500-hPa ridge over the higher latitudes of west-central North America into the latter half of June which supports increased probabilities for above-normal temperatures from the Pacific Northwest and Northern Rockies east to the Midwest. The largest probabilities (more than 60 percent) of above-normal temperatures are forecast across parts of the Pacific Northwest, North Dakota, and Minnesota where guidance favors above-normal temperatures throughout the month. 30-day precipitation deficits range from 2 to 5 inches across the Corn Belt where low topsoil is present. This low soil moisture is another factor supporting above-normal temperatures for this region. Although near to below-normal temperatures are forecast across the Northeast during early to mid-June, building heat upstream over west-central Canada is expected to eventually spread eastward with time, which is consistent with the week 3-4 dynamical models. Therefore, the updated June outlook leans towards above-normal temperatures for much of this region. Equal chances (EC) of below, near, or above-normal temperatures are forecast for areas of New England where the signal for relatively cool temperatures is strongest early in the month. Positive SST anomalies over the Gulf of Mexico along with forecasted above normal temperatures in week 3-4 tools, tilts the forecast toward above normal across Florida and along the Gulf Coast.
Based on the likelihood of below-normal temperatures associated with an early month southern stream trough and support from the week 3-4 European Centre for Medium Range Weather Forecast (ECMWF) and Climate Forecast System (CFS) models, increased probabilities for below-normal temperatures are forecast for the Central to Southern High Plains, Southwest, and southern California. During the past 30 days, more than 5 inches of precipitation occurred in northeast Colorado and the Texas Panhandle which has led to moist topsoil and further supports cooler-than-normal temperatures for these areas. The lowest forecast confidence in the temperature outlook exists across much of the interior Southeast due to uncertainty on the amplitude and placement of a 500-hPa trough near the East Coast during the second week of June. The ECMWF and Canadian ensemble means are less amplified with this trough and provide a warmer outcome for these areas, compared to the GEFS. Given these diverging model solutions early in the month, EC are forecast for a majority of the Southeast.
A predicted anomalous 500-hPa ridge upstream over western to central Canada throughout much of June and little to no precipitation during the first week of the month favors below-normal precipitation across the Midwest. This favored dryness extends east to the Central Appalachians, based in part on WPC’s 7-day forecast. Through at least mid-June, model solutions remain consistent that shortwave troughs are likely to undercut the high-latitude ridging over west-central Canada, favoring wetter-than-normal conditions especially across the interior West, High Plains, and Southern Great Plains where increased probabilities for above-normal precipitation are forecast for the month. Daily CFS model runs, dating back to mid-May, have been very consistent with this wet signal during June. A wet start to the month is likely across the Florida Peninsula as a trough of low pressure shifts east from the Gulf of Mexico. Based on predicted heavy precipitation at the beginning of June and the lack of a dry signal among tools at later time scales, elevated probabilities for above-normal precipitation are forecast across the Florida Peninsula. The largest change in the revised precipitation outlook was made to Alaska as most recent model guidance has backed off the dry signal initially forecast for southeastern Alaska. A slight lean towards below-normal precipitation is maintained for interior eastern Alaska due to the nearby anomalous 500-hPa ridge. Conversely, an amplified 500-hPa trough early in the month favors above-normal precipitation across the Aleutians and Alaska Peninsula.
Drought Outlook
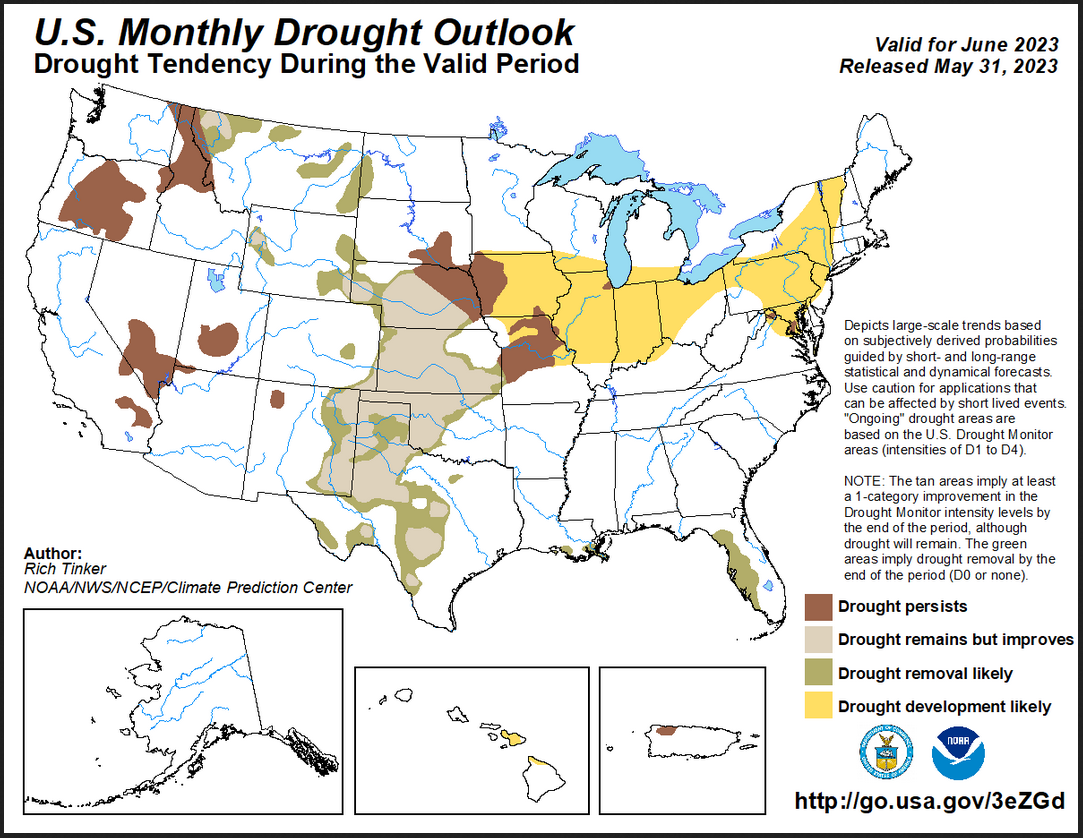
Here is the newly issued Drought Outlook for next month.
–
| You can see where drought development or reduction is likely. There is a significant reduction in the area that is forecast to be in drought. But there is also a large area of drought that was forecast a couple of weeks ago. The summary and detailed discussions that accompany this graphic can be accessed HERE |
Here is the short version of the drought summary
Latest Monthly Assessment – Broad drought expansion is possible during June across a large portion of the Midwest and the Ohio Valley, as well as in parts of the mid-Atlantic region and the Northeast. Currently, drought is restricted to some small sections around Chicago, IL and in Maryland and northern Virginia. The past few weeks have seen little precipitation across these regions, and subnormal precipitation is expected through the first half of June. The June Long Lead Forecast favors below normal precipitation in a large part of these areas as well, and there are some indications that precipitation may increase toward the end of the month, but anything that falls is not expected to be enough to remove any drought that develops in the next three weeks.
Drought is expected to persist near and just west of the large development area, specifically from eastern South Dakota southward through much of Missouri. Drought persistence is also anticipated where it exists in the Southwest, The Pacific Coast, and the northern Intermountain West. Current areas of drought have persisted for at least several months, and this is one of the drier times of year there, so any precipitation that falls is not expected to be enough to significantly affect the areas of drought.
Over a large portion of the Plains and much of the Rockies, unusually heavy precipitation is expected through early June, and the June Long Lead Forecast favors above-normal precipitation for the month as a whole. So improvement or removal is anticipated over the broad area of drought from southern and western Texas northward through most of the High Plains and eastern Rockies as well as the central and southern Great Plains. Farther east, persistent surface and mid-level low pressure is bringing rainfall to the small area of drought in southeast Virginia, which should lead to its removal. And drought removal is also expected in Florida where heavy rainfall is expected in early June and above-normal rainfall is favored for the month as a whole. In addition, their wetter time of the year is getting underway.
Drought should persist and expand on the northern Big Island of Hawai’i, and a large part of Maui could see drought develop by the end of the month. Persistence is also favored for the small drought area in northwest Puerto Rico while Alaska has no drought and none is expected to develop in the next several weeks.
We also have an updated Seasonal Drought outlook.
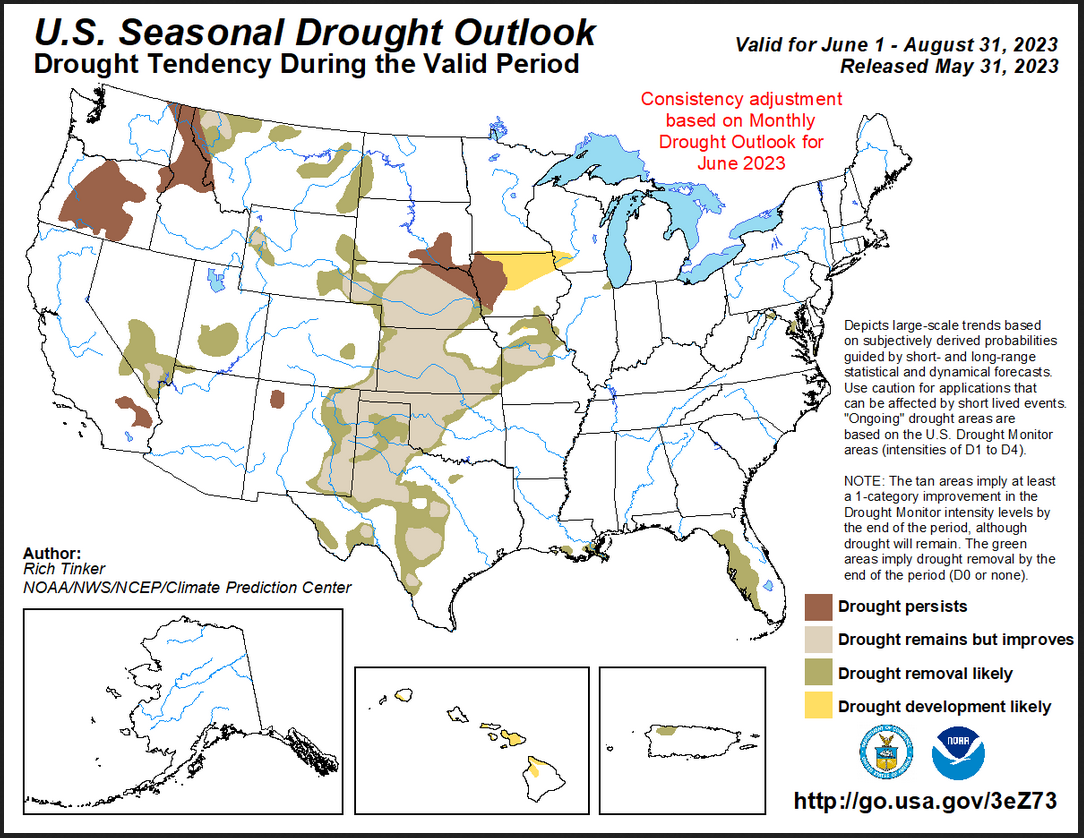
| The large area of drought development shown for June is much reduced in the three-month map. Keep in mind the initial three-month map was issued on May 18, 2023. All that has happened here is that the June portion of that outlook has been updated. Given the major changes between the June Mid-month and end-of-month update, one might ask if the earlier forecasts for July and August remain valid. That is always an issue when we look at the end-of-month update. Nevertheless, this map looks really good. |
 –
–
| To update this forecast (which updates on Tuesdays) click HERE |
Month-to-date Temperature as the current month evolves can be found at https://hprcc.unl.edu/products/maps/acis/MonthTDeptUS.png
Month-to-date Precipitation as the current month evolves can be found at https://hprcc.unl.edu/products/maps/acis/MonthPNormUS.png
CLIMAS Podcast
No Podcast this Month
Water year-to-date SWE can be found by clicking HERE I provided a map that was current as of the day before this article was published.
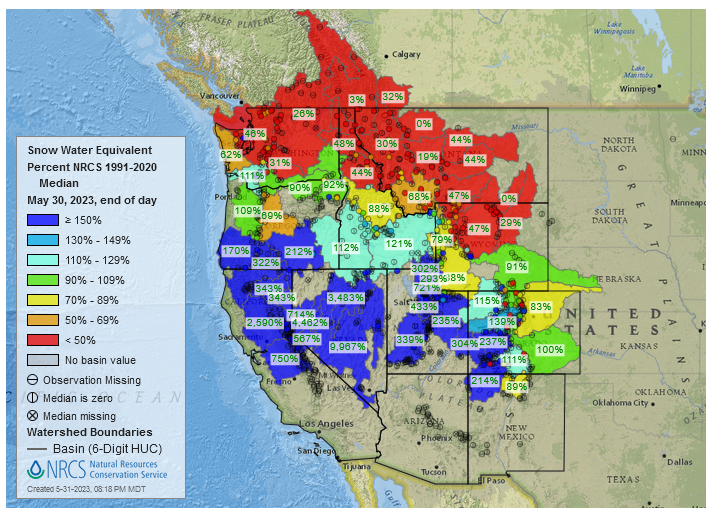
| We are at the end of run-off so the data may not be too meaningful. But it is showing the percent of the median so it is adjusted for the time of the year. |
I wanted to show the stream flow. But I was only able to generate the May 1 graphic tonight. So I decided to show the water year-to-date precipitation It is the same link as for the current snowpack with a different choice of the desired graphic.
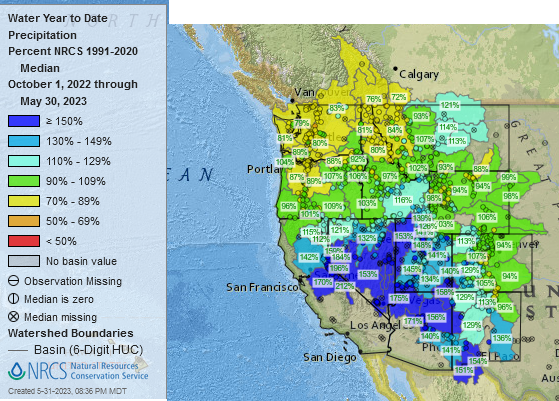
| This provides a very clear picture of the weather pattern since October 1, 2022. |
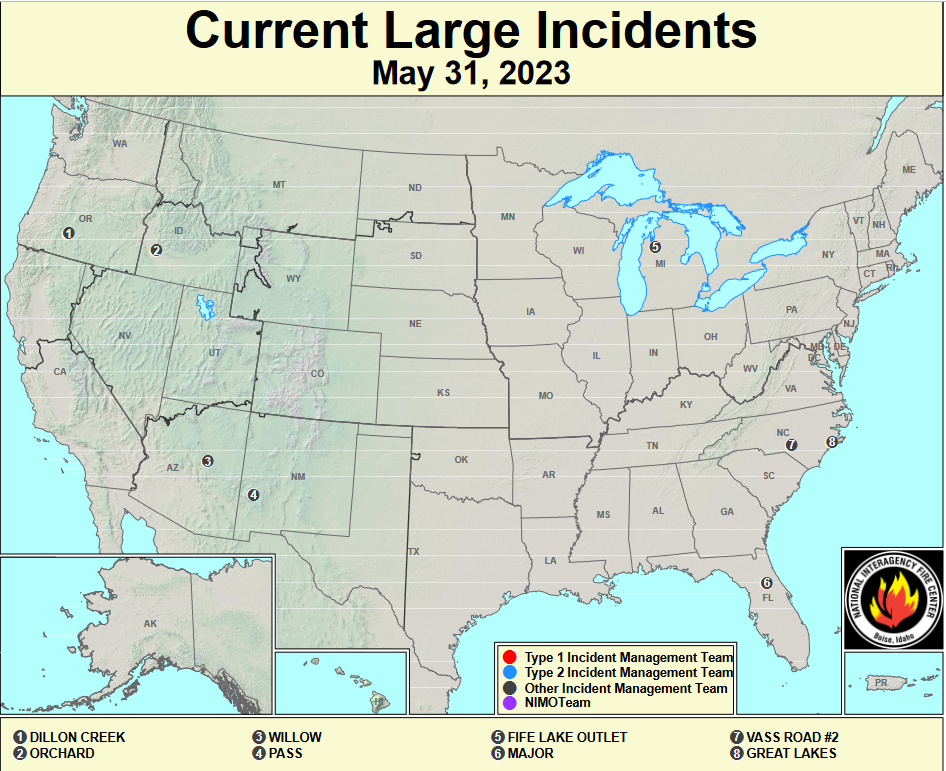
Fire Outlook: Current and Forecast
Updates to the major fire situation can be found by clicking here https://fsapps.n wcggov/afm/index.php
| The number of wildfires has decreased dramatically. This map does not include NovaScotia where they are having a lot of problems with wildfires right now. |
Now looking at the wildland fire potential Outlooks. (Normally these maps will update in the afternoon of the first day of the month but sometimes it takes a couple of days).
Since they are set to auto-update, if you look at a prior version of this article, these four maps will not be the original maps but the updated maps.
June Wildfire Risks
July Wildfire Risks 
August Wildfire Risks
September Wildfire Risks
If you read this article a month from now and if the maps did not auto-update, you can update these graphics by clicking here https://www.ni fc.gov
| I hope you found this article interesting and useful |