Updated at 3:26 a.m. EDT Tuesday, May 30, 2023
We are entering Hurricane Season. So it is appropriate to discuss the recent projections issued by NOAA. NOAA has provided projections for the Atlantic, Central Pacific, and Eastern Pacific.
I also discuss the apparent correlation between hurricane frequency and intensity with the phases of the Atlantic Multidecadal Oscillation (AMO). This is particularly important this year due to the combination of a warm Atlantic and a forecast of an El Nino. These two factors tend to cancel each other out and this combination occurs rarely. This makes the forecast this year interesting and based on a small number of occurrences of this combination. Thus the level of confidence in the Outlook for the Atlantic may be lower than usual.
The analysis of the impact of the AMO on the forecast is in Part II of the article so those who are only interested in the forecast will find that early in the article. Ocean cycles are very important when trying to understand the climate of the U.S. and other parts of the World.
It is also appropriate to remind those who are at risk from tropical cyclones to be as prepared as possible.

Part I: 2023 Hurricane Season Outlooks
This is the time of the year that NOAA issues hurricane projections. But cyclone activity (which they call typhoons) in the western Pacific has already begun with a devasting storm: Mawar. Read more about it HERE. The official hurricane season in the Atlantic officially begins on June 1, 2023, and ends on November 30, 2023. The Eastern Pacific hurricane season begins May 15th and also ends November 30th. So it has already started. The Central Pacific is the same as for the Atlantic. There is no law that storms cannot occur out of season.
Actually, we are talking about tropical cyclones and the information forecast is:
- Number of named storms
- Number of named storms expected to reach Hurricane Level
- Number of Hurricane Level storms expected to reach Cat 3 or higher
The forecasts do not attempt to predict how many storms will make landfall nor what the distribution of the storms will be through the official hurricane season.
NOAA Outreach
Here are the press releases
- NOAA Hurricane Outlook Press Release (25 May 2023)
- NOAA 2023 Atlantic Hurricane Season Outlook (25 May 2023)
- NOAA 2023 Eastern Pacific Hurricane Season Outlook (25 May 2023)
Here is the video of their briefing of journalists. It runs long due to a lot of (well-deserved) self-congratulations. It clarifies a lot of things and hopefully, I have included those clarifications in this article.
To watch the video click HERE That will get you to the live version of the dashboard and click again on the start icon.
To read the transcript of the presentation and the Q&A click HERE
Now I am showing the key graphics that were presented.
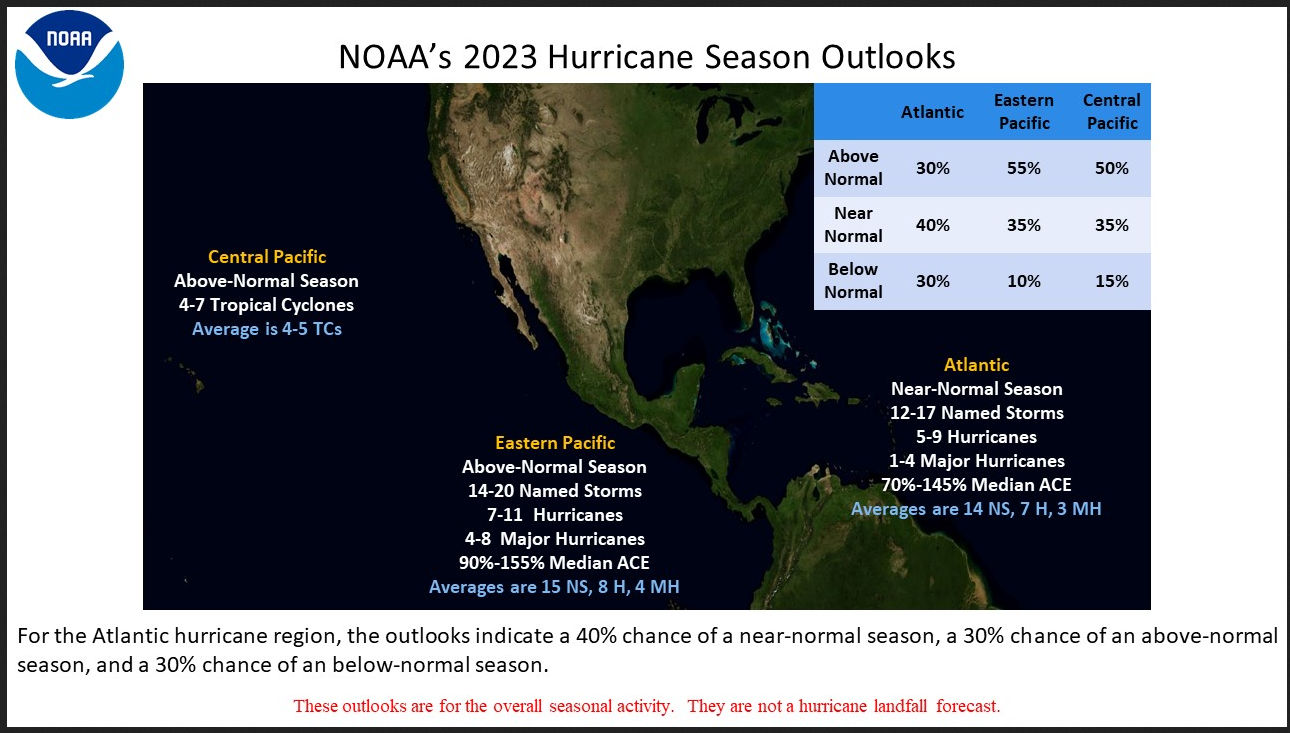
| I apologize for the poor visual quality of the headings in the summary in the top right where from left to right it is the Atlantic, Eastern Pacific, and Central Pacific. |
And here is a simplified version for just the Atlantic. It is the same information as above but many people are mostly interested in Atlantic storms.
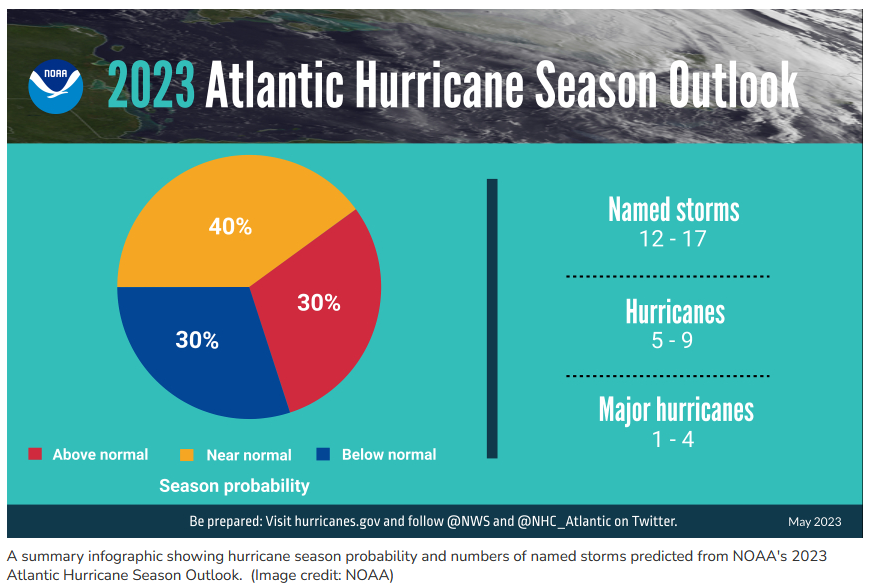
| The 40% likelihood of an average year is pretty interesting. The reasoning is that we have warmer than usual Sea Surface Temperatures combined with El Nino. So the thinking is the two will cancel out. Part of the reason for the warmer Atlantic Ocean is Global Warming but some of it is a cyclical pattern called the AMO or Atlantic Multidecadal Oscillation. That is why in Part II of this article we are going to look at the issue of whether or not the warm phase of the AMO leads to more and stronger storms. |
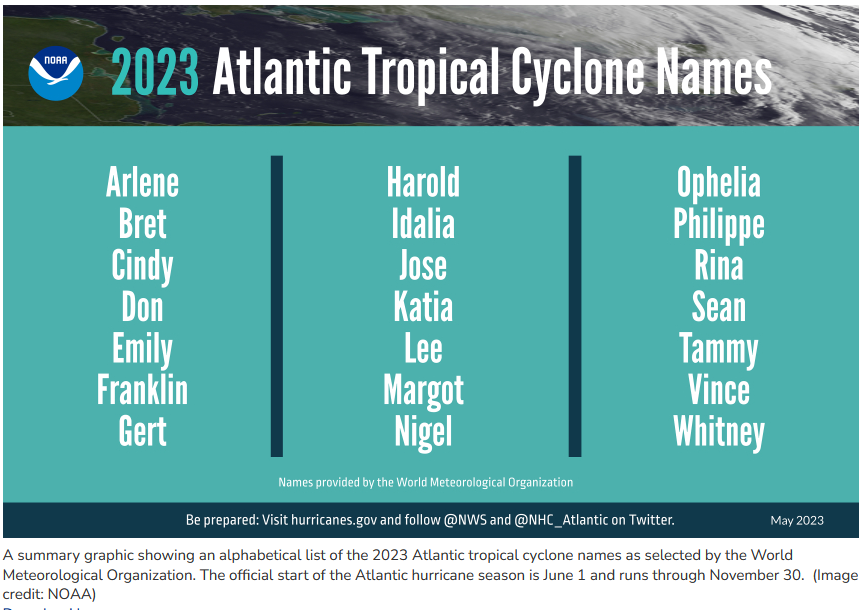
Look for these names.
Part II: Possible Correlation with the Phases of the AMO – Atlantic Multidecadal Oscillation.
What is the Atlantic Multidecadal Oscillation which is abbreviated as the AMO?
What is the AMO?
The AMO is an ongoing series of long-duration changes in the sea surface temperature of the North Atlantic Ocean, with cool and warm phases that may last for 20-40 years at a time and a difference of about 1°F between extremes. These changes are natural and have been occurring for at least the last 1,000 years.
You can find more information HERE.
| To address the question of a possible correlation between the AMO index value and hurricane frequency and intensity, we need to know how to measure the intensity of tropical storms. We are not interested in the intensity at a single point in time but over the life of the storm. Usually, a measure called ACE is used. What is ACE? It is explained HERE. An easy way to think of this is that the force of wind is equal to the square of the velocity. So we are looking at the square of the wind velocity over time. |
| Where and how is the AMO measured? I am sorry that you asked as there are differences of opinion on that. There are differences of opinion on the formula for the index. Thus there is more than one recognize time series for the AMO Index. Here is one version of the AMO index. Here is another. This is by far not the only case of there being multiple indices used in meteorology. We have really only knows about the AMO since 1994 and it took a while for it to be named the AMO. We have known about the Pacific Decadal Oscillation (PDO) longer. Climate science is evolving. We know a lot but there is a lot more to be learned. |
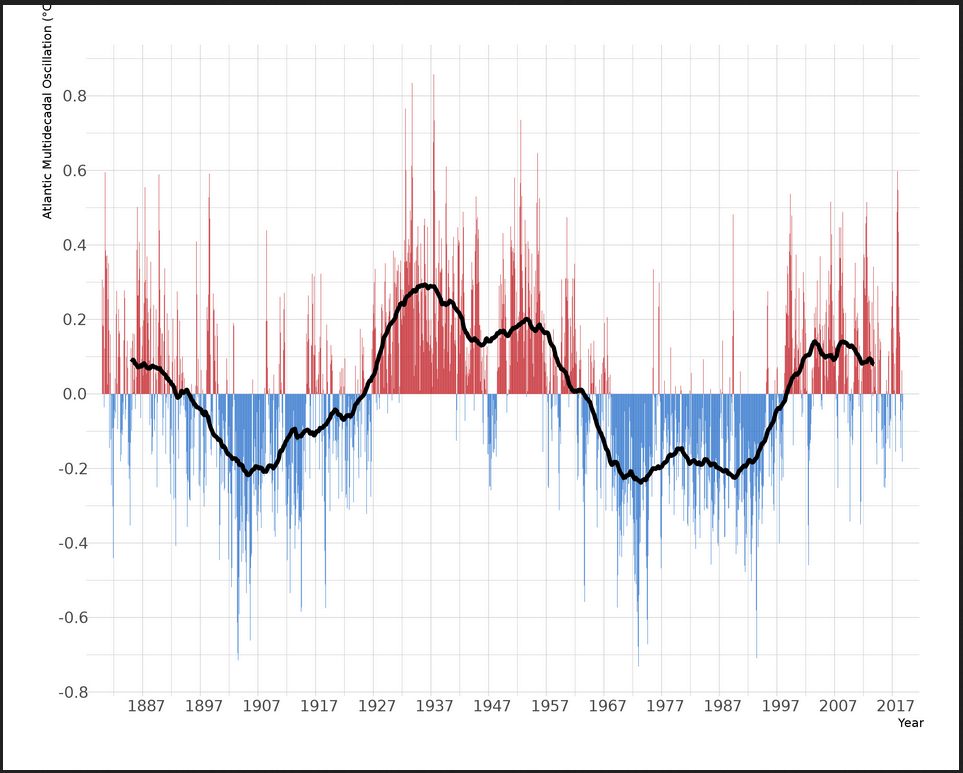
Using perhaps the most widely used index what does the data on the AMO look like?

| Source; If I looked harder I would have been able to find a graphic that was more up-to-date than 2013 or given that I have the index I might have attempted to plot it myself – but I do not have any college students working for me so forget that. You can see it is irregular. The red area is called the warm phase and the blue area is called the cool phase. We remain in the warm phase and I provided readers with two versions of the actual index. Of interest, we only have data on two repetitions of the AMO. I am just speculating but the clear variations in the intensity may be correlated with the ENSO Cycle. Sometimes I slip up and refer to the AMO as a cycle. On another occasion, we might discuss these oscillations in Sea Surface Temperatures (SST) in large water bodies worldwide. |
I found another image;

| Source: This one extends a bit closer to now. There was less smoothing done when creating the plot (always an issue when you plot an index) and it shows the risk of forecasting what the exact condition of the Atlantic will be when hurricanes generate. More than likely, the index would be lower than the value they used but I am not sure what value they used. In that case, we might have less cyclone activity than forecast. |
Let’s see what we can say about the possible correlation between the AMO index and hurricane strength and frequency. We are examining the hypothesis that tropical storms and hurricanes and more frequent and stronger during the warm phase of the AMO.
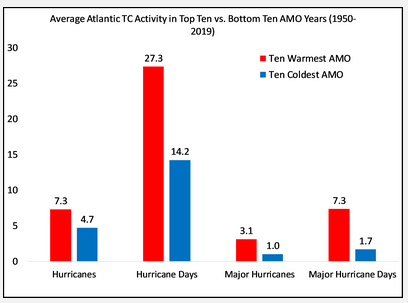
| Source: This show that there is more and more intense Atlantic Tropical Cyclone Activity in the ten warmest years of the AMO compared to the ten coolest years of the AMO as measured by an index. I am not sure about the validity of the index used by the authors of this article. I wish they had used the standard index. But his index makes sense. |
So I want to explore the topic further.
This slide presentation from Enfield is useful The next two graphics are from this source: Atlantic Multidecadal Oscillation It gets difficult since this is a slide presentation using materials from many different authors so keeping track of the attribution is not easy.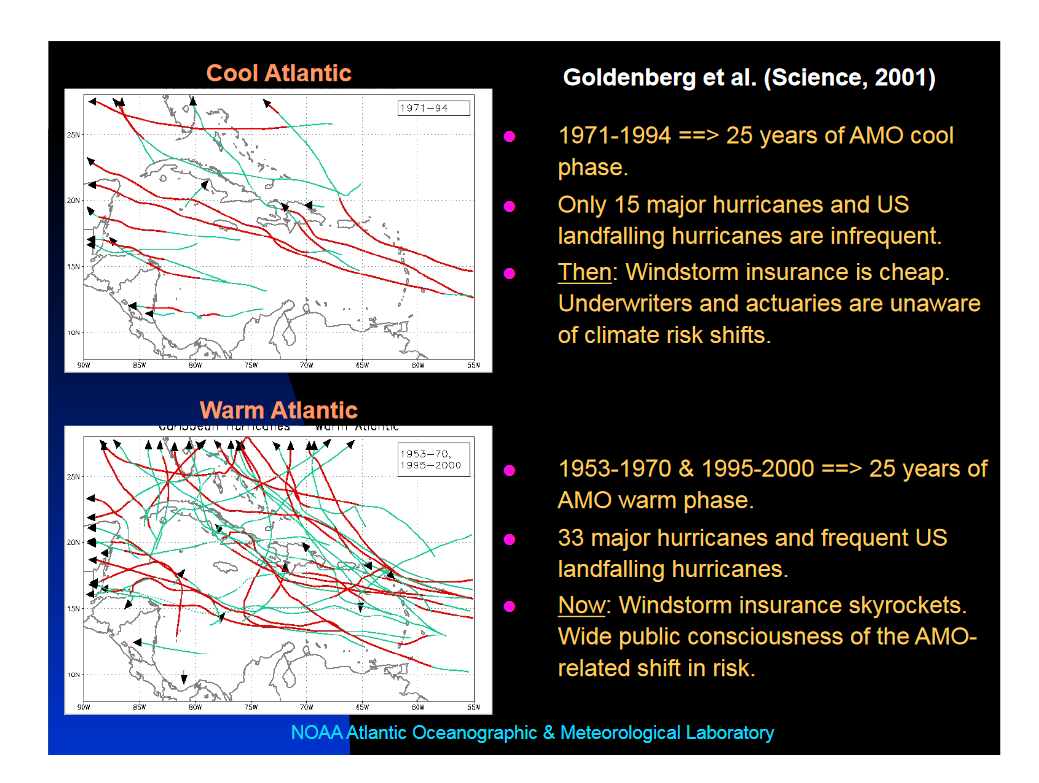
| This from the above-referenced slide presentation was an analysis by Goldberg et al and is from the main NOAA Hurricane Research Center in Miami. It shows more major hurricanes in AMO + (my way of abbreviating Warm Phase as compared to AMO-). It also shows a difference in the track. I am going to reveal a secret here. The AMO may be the same as or at least highly correlated with the Bermuda High. The Bermuda High (also called NASH by those more highly paid than I am) moves seasonally and these movements vary by one of the long cycles. I wrote about this a while back in a presentation I made on the Climate of the Southwest. Yes, everything is connected. So there is more information on the AMO in this article but obviously, it was not addressed to hurricanes as we do not get too many of them in the Southwest. But cyclones in the Eastern Pacific impact the weather of the Southwest. They just do not arrive as hurricanes or even tropical storms but impact the weather of the Southwest by either entering the Westerlies offshore of California or moving inland and arriving as a remnant of a former cyclone. |
Here is another graphic from the same slide presentation
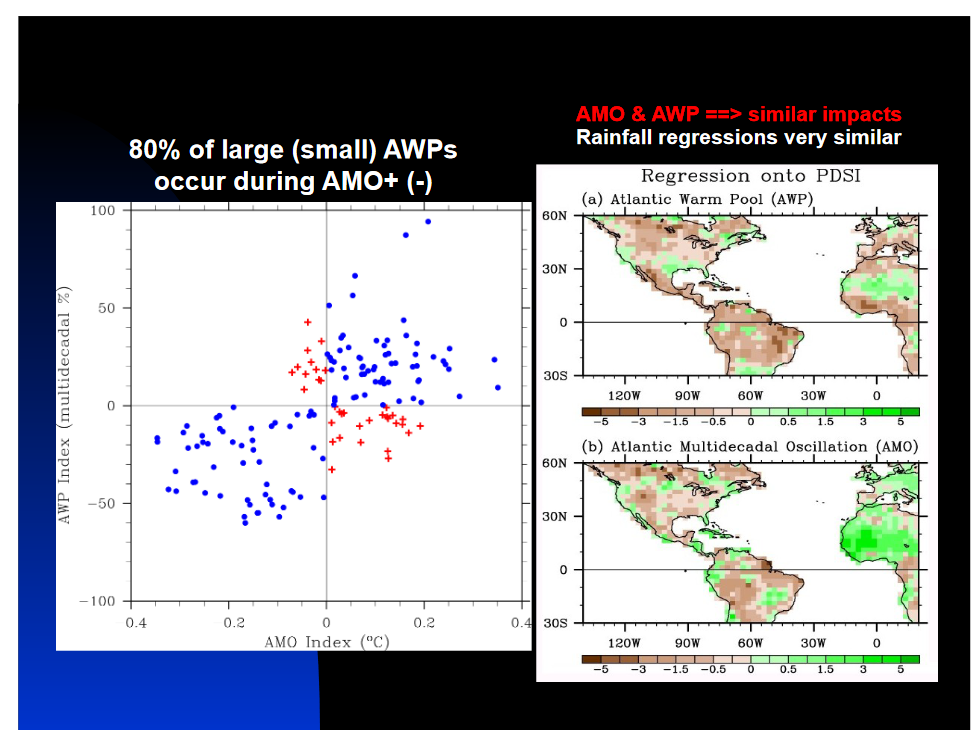
| Basically all this does is show the AMO Index is highly correlated with another index called the AWP index. What is an AWP? |
For that we look at this graphic
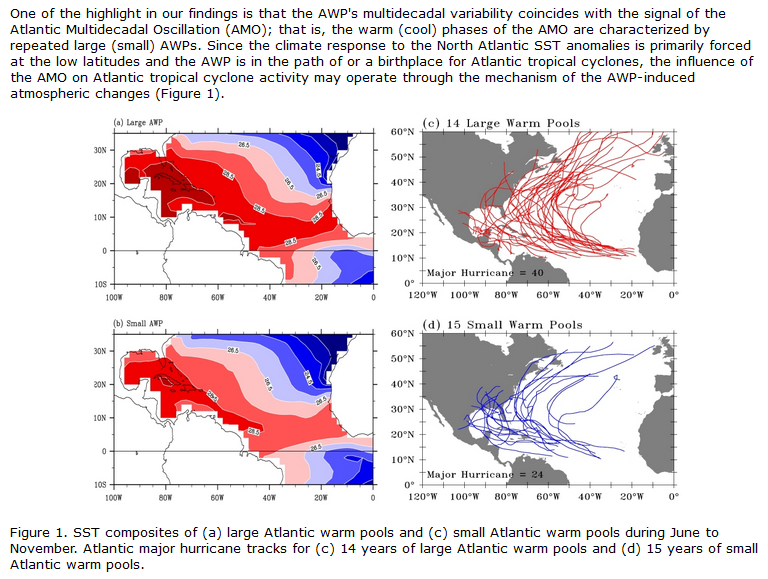
| For that, we look at an analysis by Sang-Ki Lee which you can find HERE. The red areas are the AWPs.
And now I am going to reveal another closely held secret. The Pacific is not the only ocean that has a Warm Pool. OMG. There is one in the Atlantic also because the Atlantic Ocean and the Pacific Ocean both follow the planet where we live as it takes is once a day spin which creates the prevailing easterlies near the Equator. So these onshore winds skim off the warmer air at the surface and send it westward. And surprise surprise the size of the Warm Pool is correlated with increased hurricane activity. What they have not mentioned here is that the two warm pools are correlated with the Phase of ENSO. So large Warm Pool suggests La Nina. But it also seems to suggest AMO+. This is where it gets really tricky. ENSO is nominally a 5 – 9 year cycle and depending on your source the AMO is a 60- to 80-year cycle. What we are not doing this evening is looking at the correlation between La Nina conditions and AMO+. I am sure someone has done it but I am getting tired. I am sure it is correlated which is why having AMO+ and El Nino is unusual. Clearly, the AMO is not a smooth cycle but what is called an oscillation. So during the Warm Phases, there are fluctuations in how warm it is. I think everyone agrees that we need more research into this intriguing set of correlations. And one wonders how Global Warming may change the situation. |
–
| I hope you found this article interesting and useful. |
–