Updated at 5:17 p.m. EDT Friday, May 26 to improve the summary at the end of the article.
USDA has announced record winter wheat crop abandonment. Is this really significant news?
At first, it perplexed me since the total production of winter wheat is expected to increase slightly.
In this article, we explain how you can have an increase in production with an increase in crop abandonment.

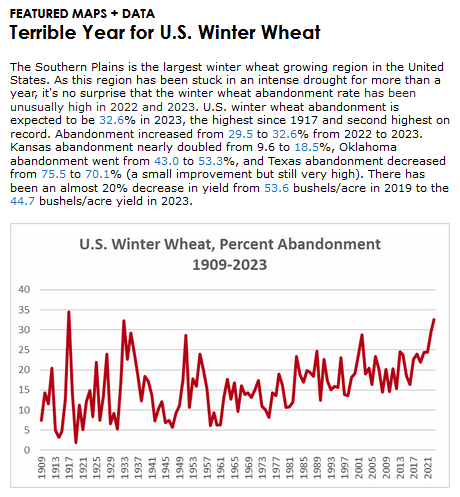
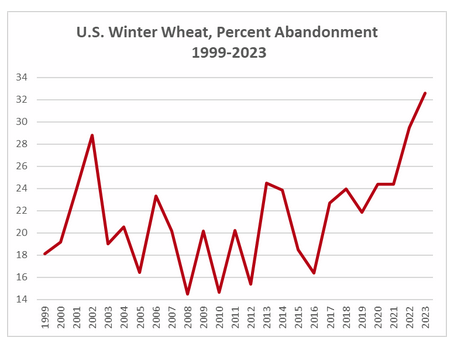
–
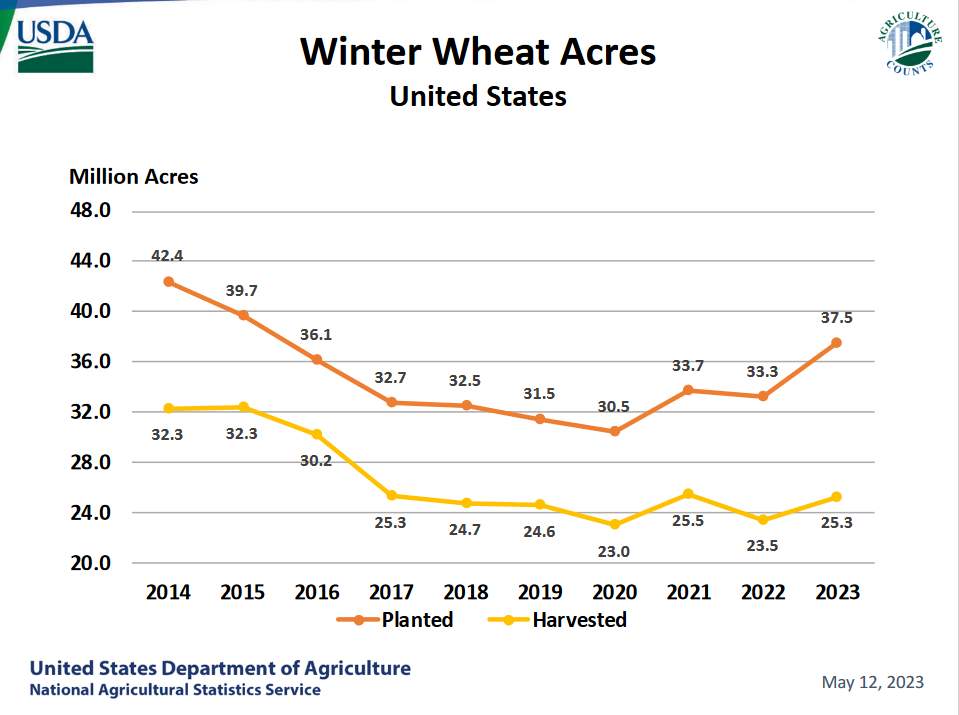
| The second graphic enlarges the more recent part of the history. Abandonment usually means that another crop is planted or the remnants of the crop are used to feed animals often by having animals graze on the abandoned crop. |
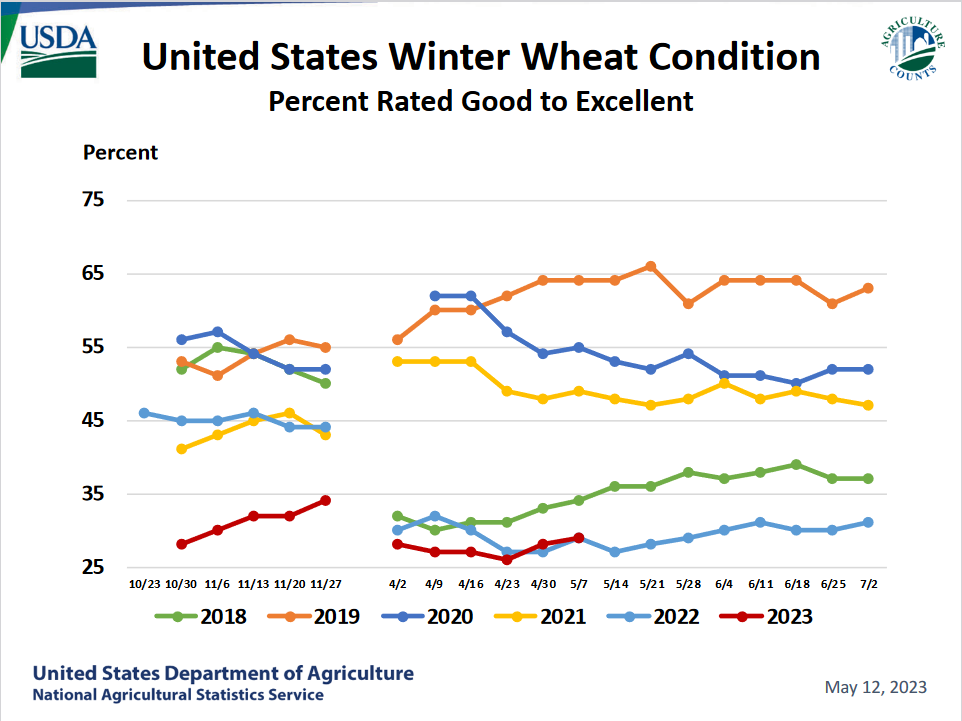
Now we look at the slides from the recent (May 12, 2023) Agriculture Statistics Board Briefing on crops. I am only presenting the wheat graphics tonight. The full report can be found HERE.
–
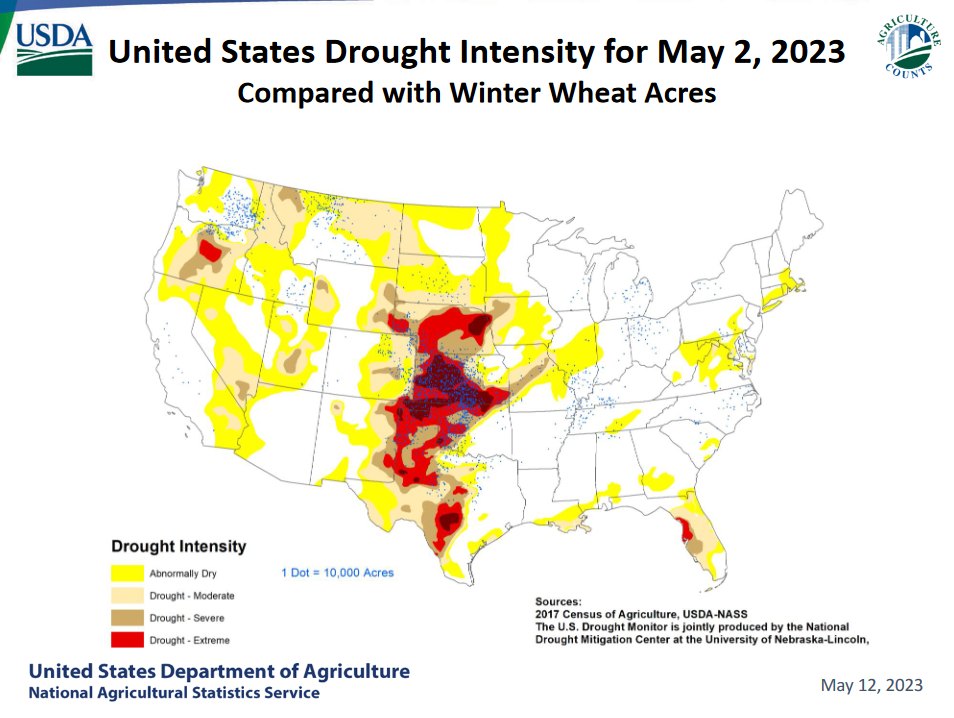
| This may be redundant with the drought slide shown later. There are a number of factors that are correlated and encourage abandonment. |
–
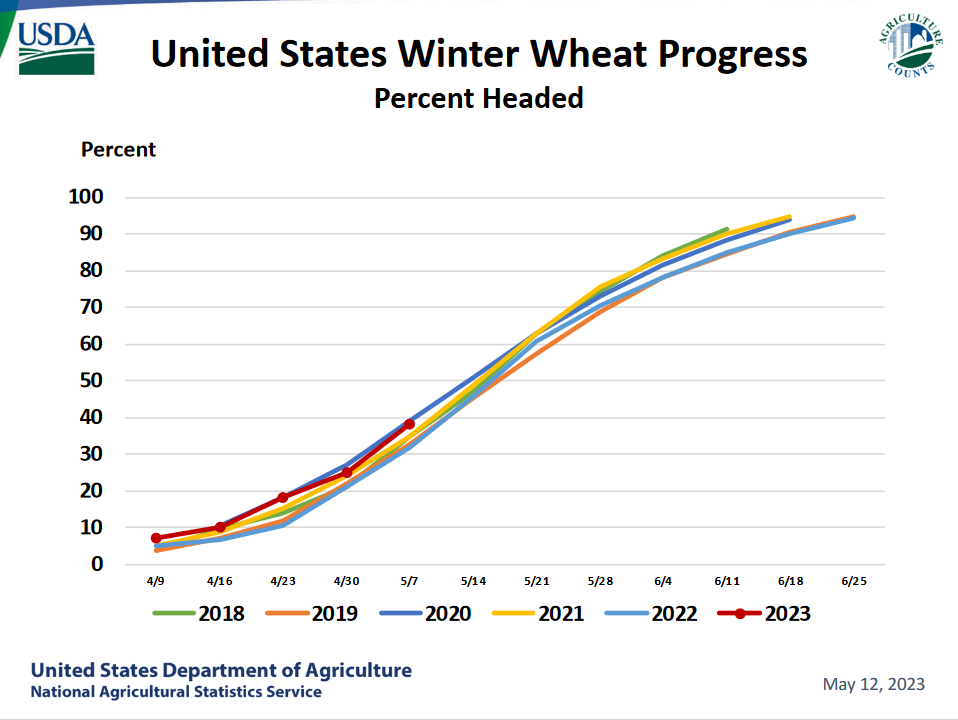
–
| Drought is part of the story |
–
–
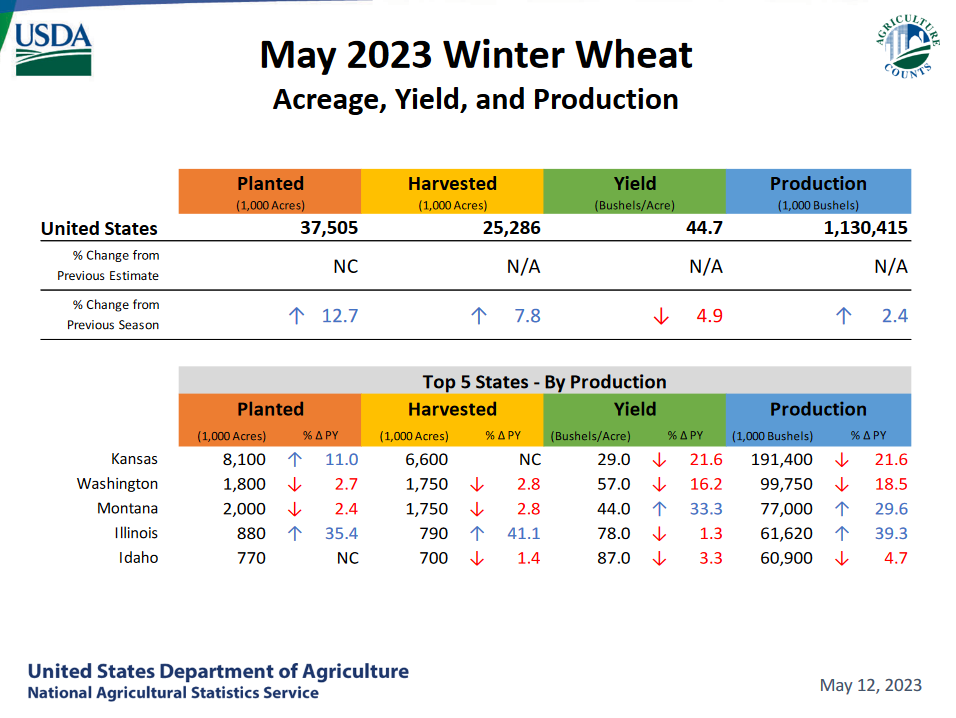
| Production is forecast to be up. So how can abandonment be up? It is because they planted more and they are reporting THE PERCENTAGE ABANDONED. Is this fake news? You be the judge. |
–
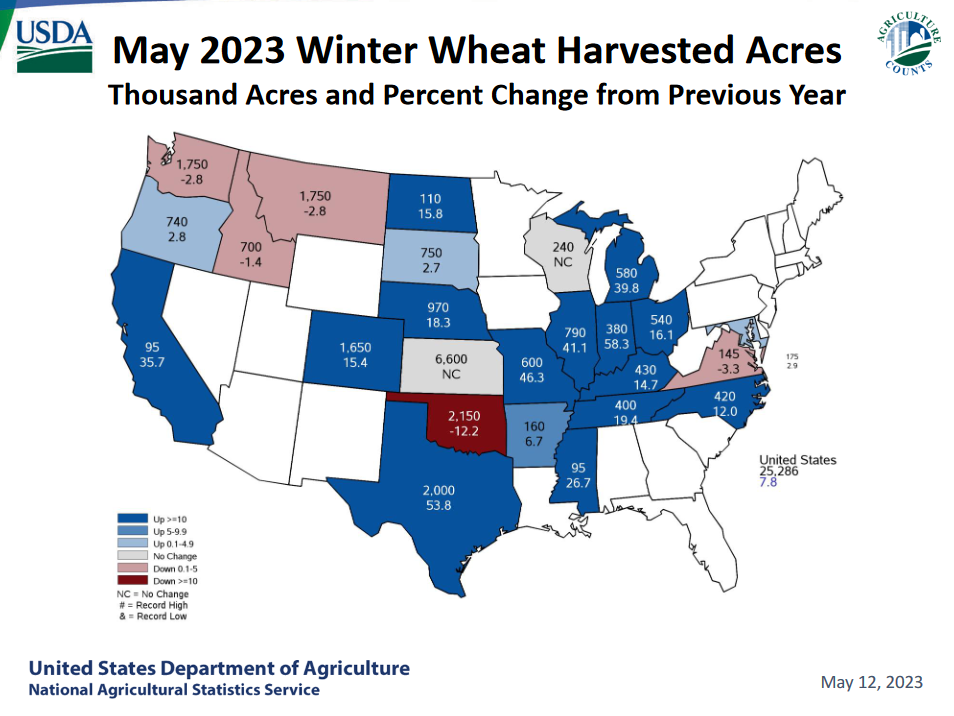
| This shows it more clearly. The number of acres planted increased and the number of acres harvested increased but not as much as the increase in the number of acres planted. So yes the percentage harvested hit a record low. That is significant but it is useful to understand why we can have record abandonment while also having an increase in production. |
–
–
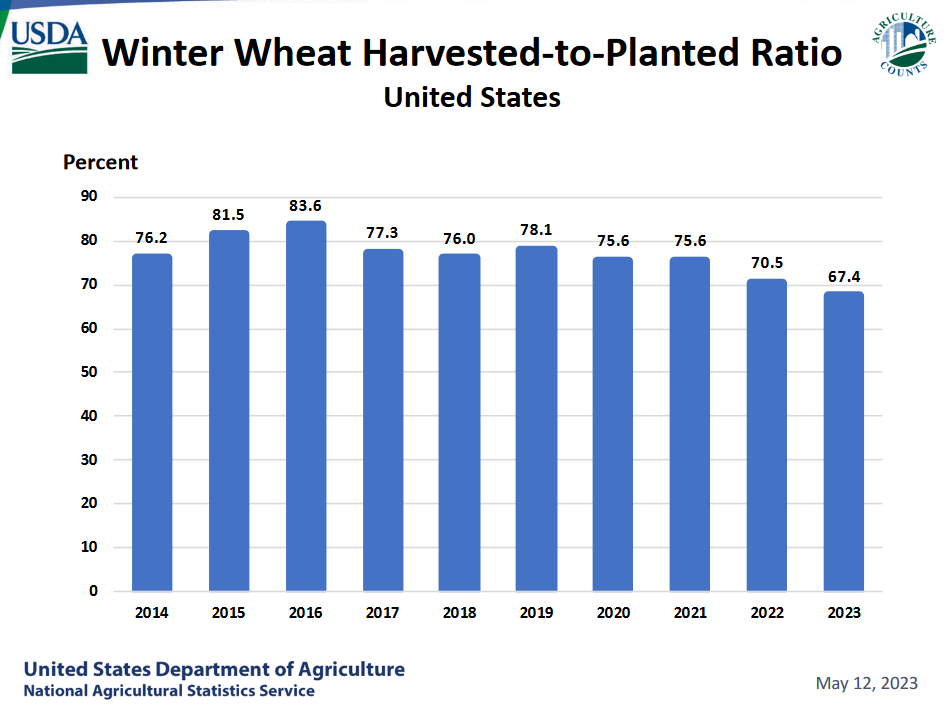
| This is another view of a graphic presented earlier showing that the harvest ratio is projected to have declined. It is a projection but it can only get worse in that abandoned crops in general can not be recovered. |
–
–
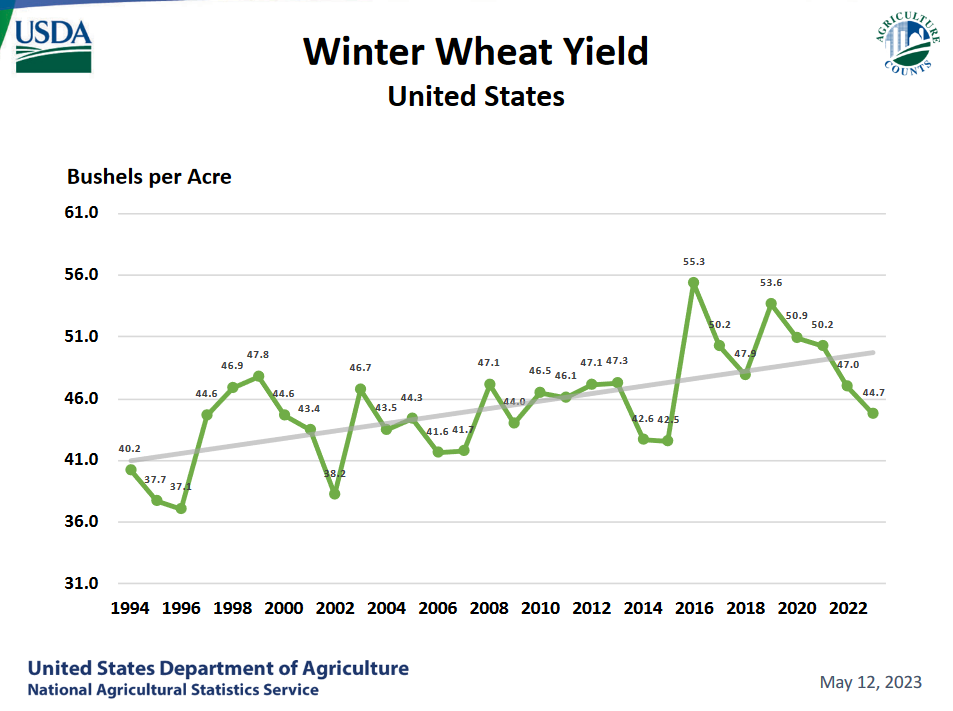
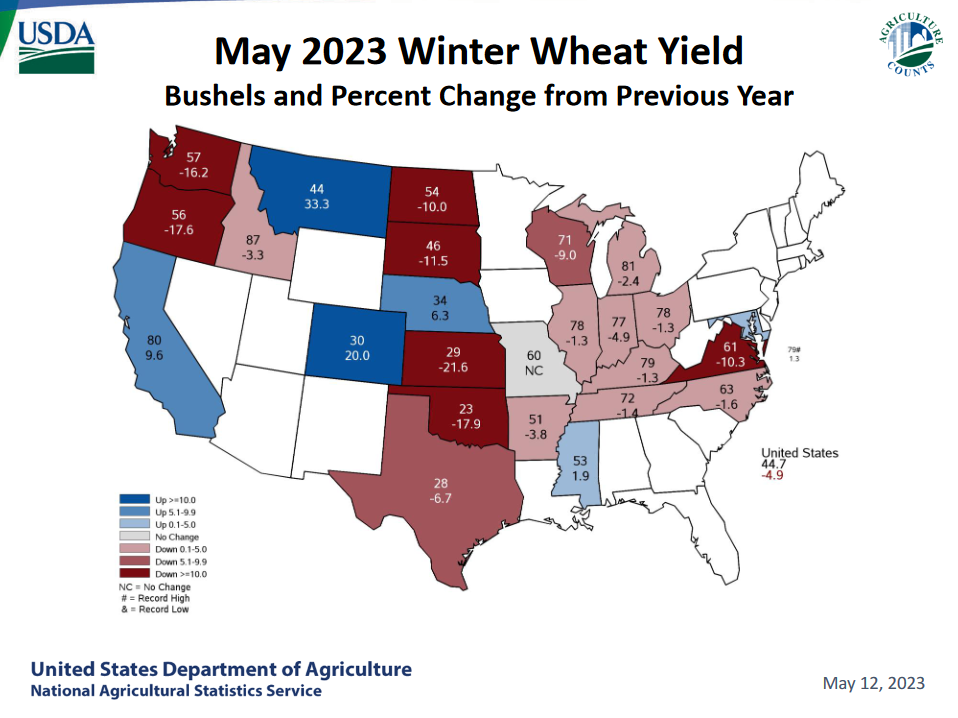
| It looks like a bad year for yield. That is somewhat independent of the abandonment percentage. I am not sure exactly how they calculate the yield. I assume it is for the harvested acres. But low yields are a factor in abandonment. |
–
–
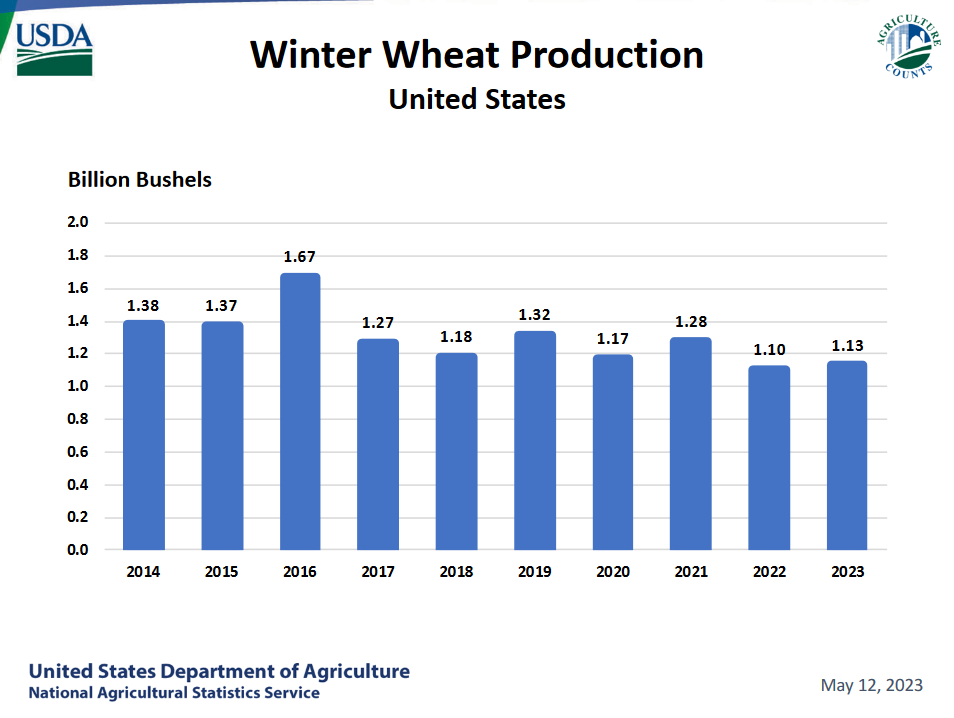
| The net of all the factors is a slight increase in production. |
–
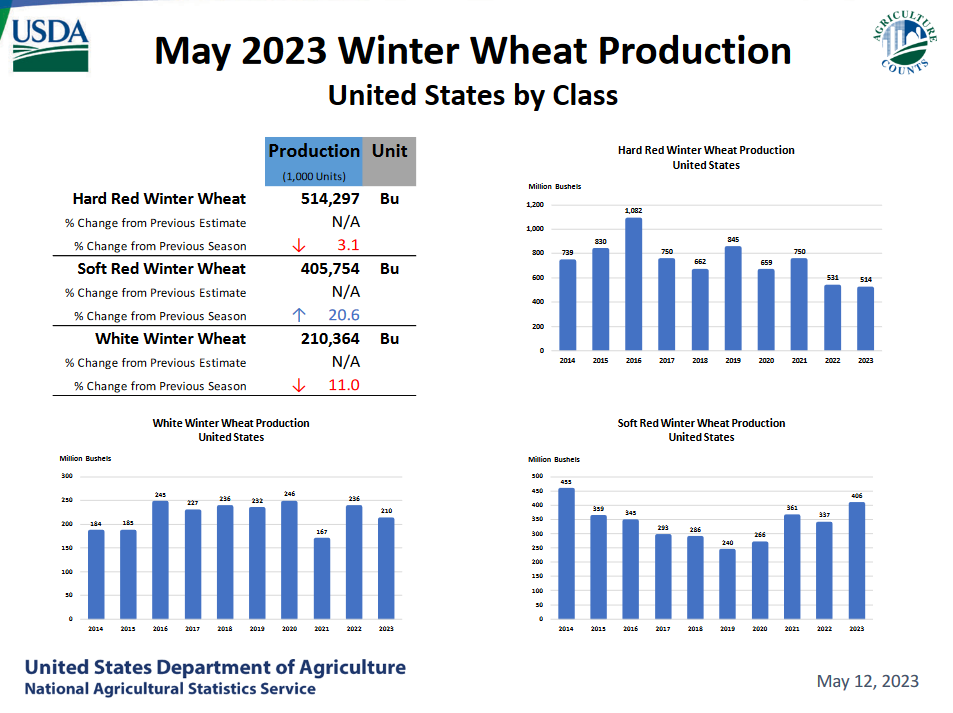
–
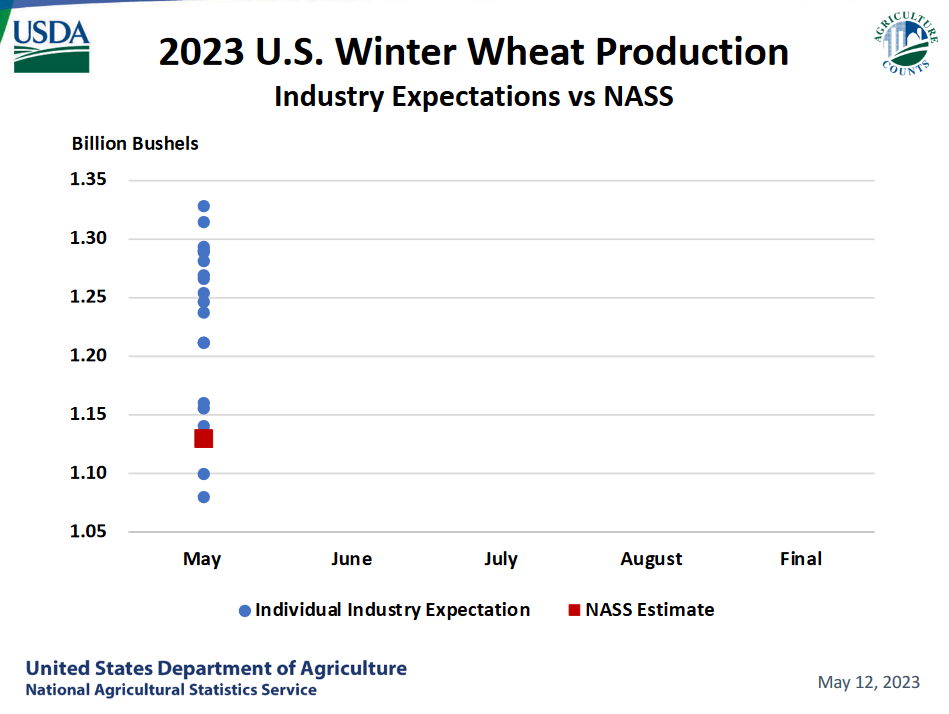
| This graphic shows the NASS forecasts compared to a number of industry forecasts. Over time the spread tends to narrow. |
–
There is more to the story and I may add to this article. In particular one has to look at commodity prices and international competition. So there is much more to this story. What covered in this article was:
Additional information on this from a media source can be accessed HERE. It addresses to some extent what I am discussing pedantically below. We did not address the impact of prices (I took a look at it last night and it did not seem to be a factor in abandonment but I was looking at current information and the information used by farmers when they made the decision to abandon may have been different and they may have abandoned in favor of a crop with high prices). We did not look at the overall world import-export situation. We provided a map that shows some of the information by state. What we did not have WAS INFORMATION OF THE AMOUNT OF DRY FARMING BY STATE. I know it is high in Texas. With dry farming (no irrigation) drought impacts happen fast. I do not have enough information to address the varying amount of dry farming by state but in general, it probably means some combination of poor soil and poor climate that make the cost of irrigation not justified. We did not address insurance. One thing is certain, farmers know how to calculate. I may publish a supplement if I have something worth reading. Otherwise, I might update this article There is a drought alert for the Midwest so this may become a broader subject. |
–
| I hope you found this article interesting and useful |