This article is based primarily on the May 23, 2023, USDA Crop Bulletin which covers the May 15 – 21 period of time. The USDA report becomes available on Tuesdays. I will try to publish this article Tuesday night for viewing Wednesday morning but I am one day late this week.
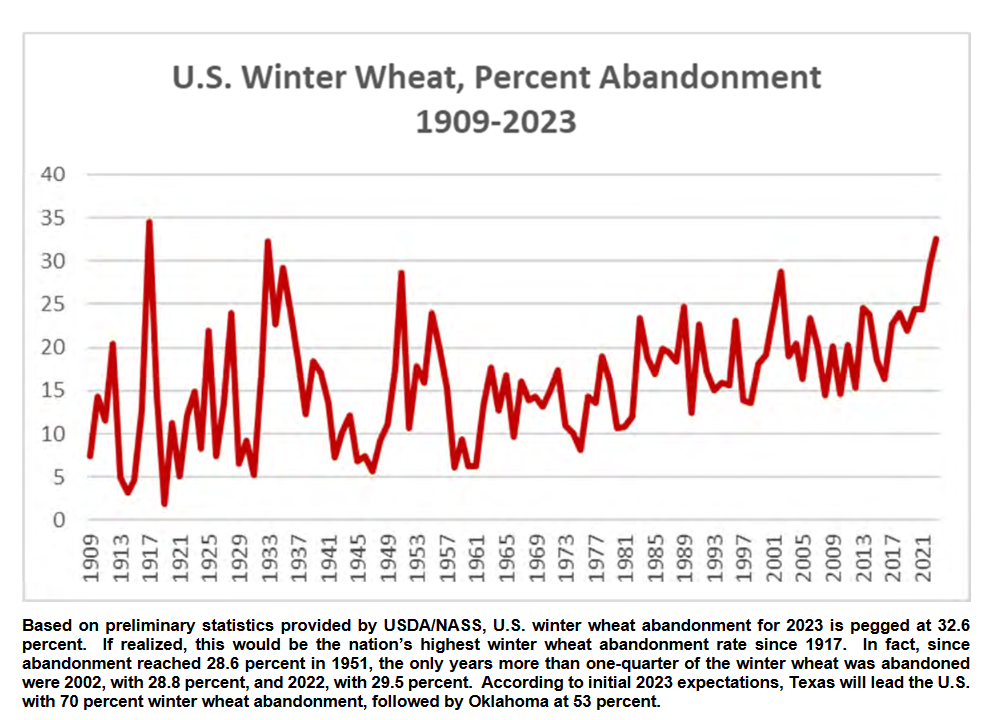
Included in the USDA Crop Bulletin was information on the highest percentage abandonment of Winter Wheat since 2017. I included a link to additional information on this somewhat worrying trend. This year, drought in Kansas was a major factor in this. But it is more complicated than that.
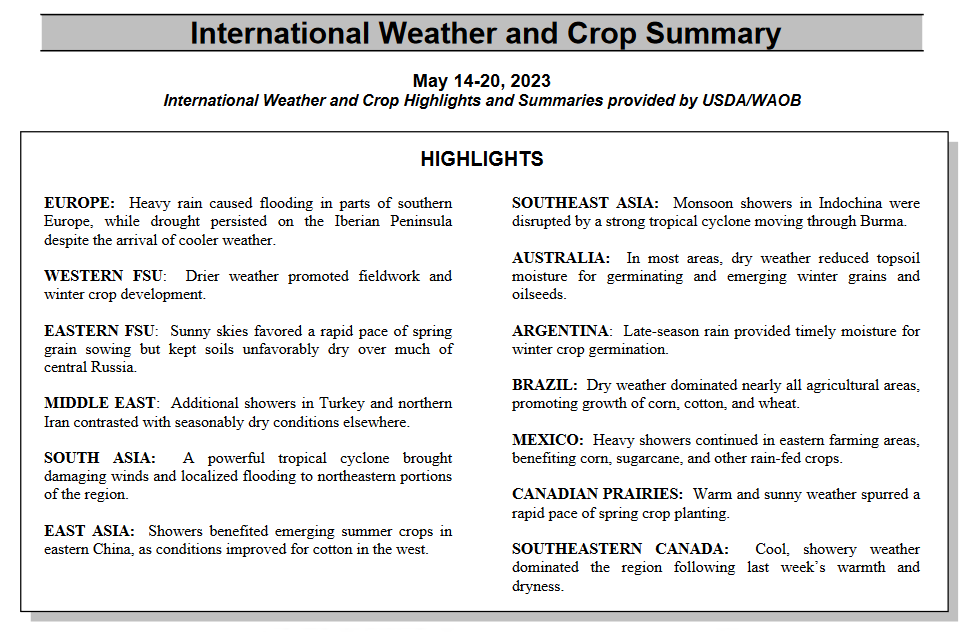
The article includes a short international review of agricultural conditions.
It is still early in the season but we beginning to have information on most crops. And overall it looks like a very good year developing.
![]()
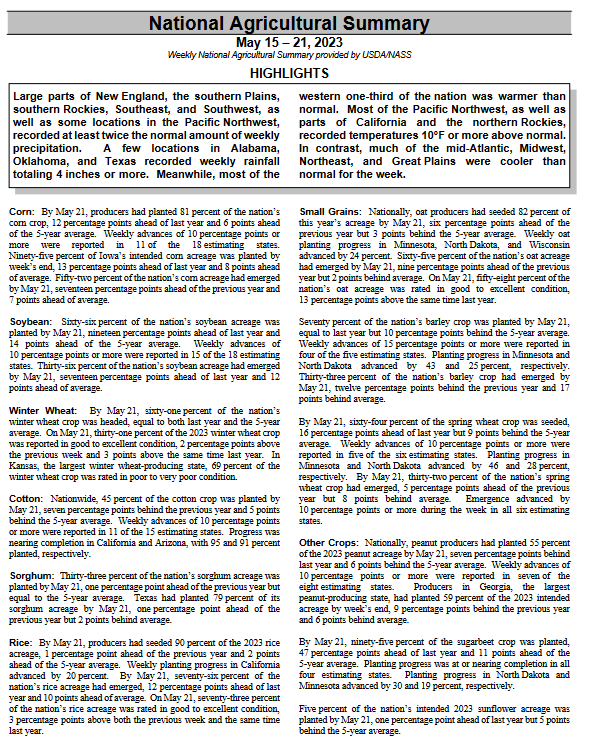
We start with the National Agriculture Summary. The Tables below the summary may have additional data. The boxes with my comments may be incomplete so for crops of interest check the data out yourself to be sure.
| Below is pretty much the same information in table format. However, there is additional information in these tables. |
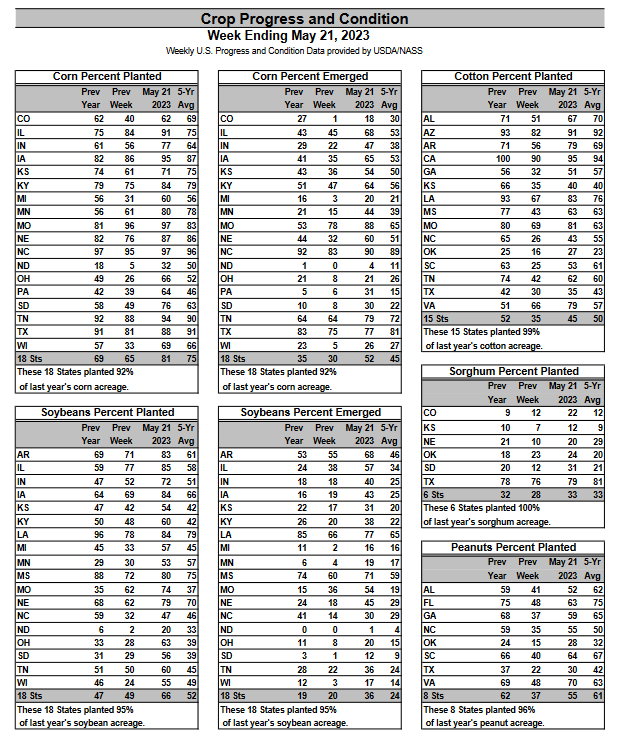
| Corn and soybeans look very good with cotton being a little slow. |
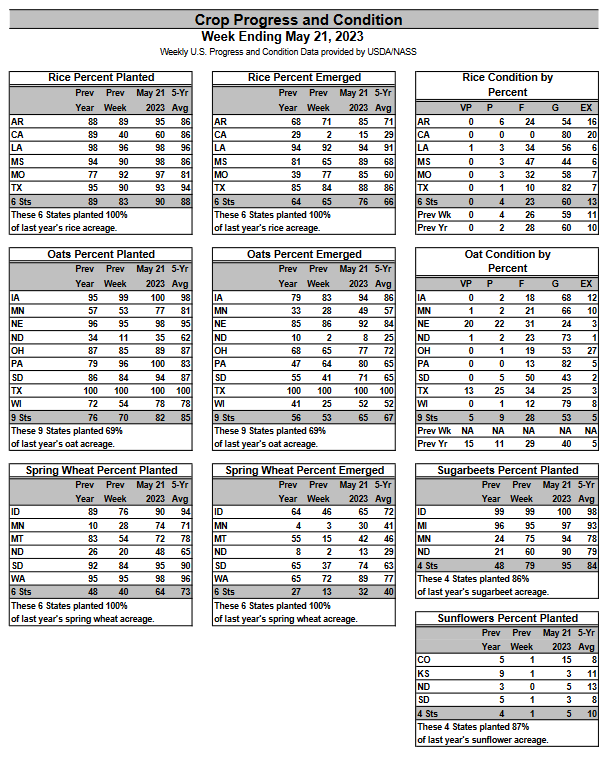
| These crops all look good. |
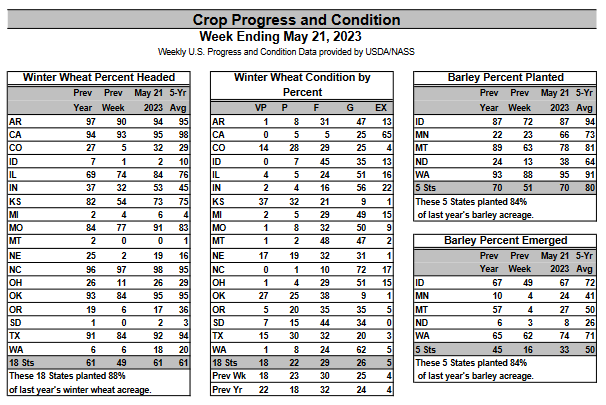
| Winter Wheat looks good here but there has been record abandonment see later in this article. |
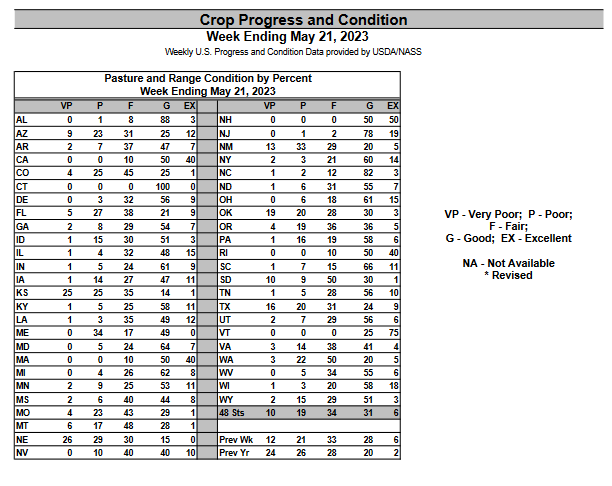
| Pasture and Range conditions are much improved over the prior year. |
Some additional detail is provided HEREIt is mostly some additional weeks of data and it is all in larger print. |
–
Weather Conditions
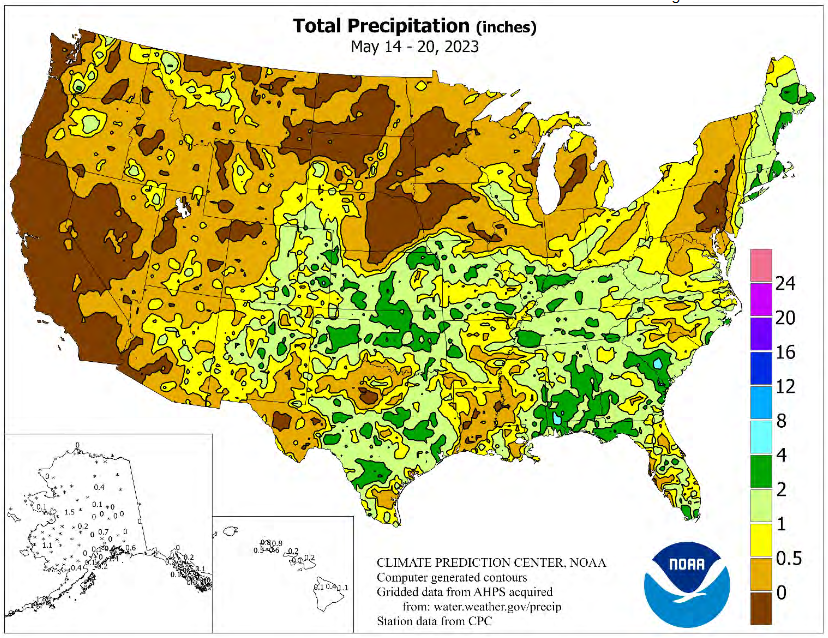
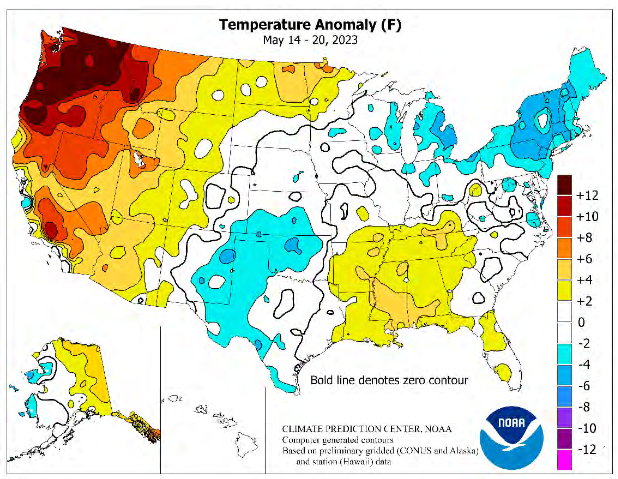
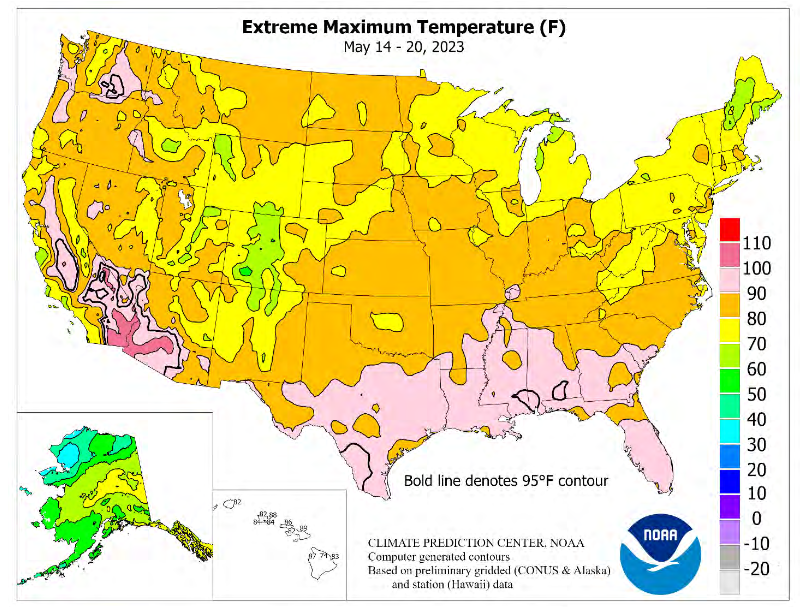
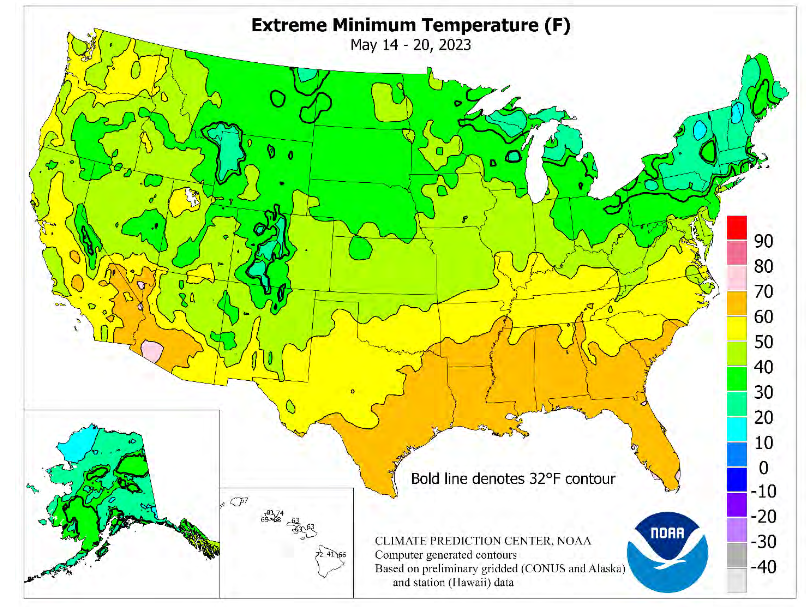
| The minimum temperatures and the cold anomalies are what is of most interest this time of the year. The above four graphics show different things so paying attention to the title of the graphic is important. The second graphic shows the anomalies. We see both warmer and cooler areas. The bottom graphic might be the most important one right now in terms of losses to overnight frosts. It looks like it would be minimal. |
Some additional information
–
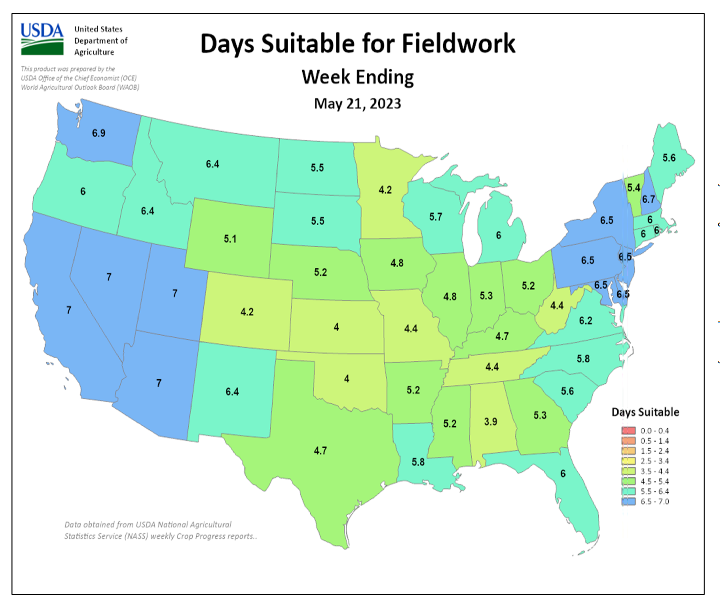
| The yellows and oranges are of interest. They show areas where the number of days suitable for fieldwork was low. There were no states in those categories this past week. |
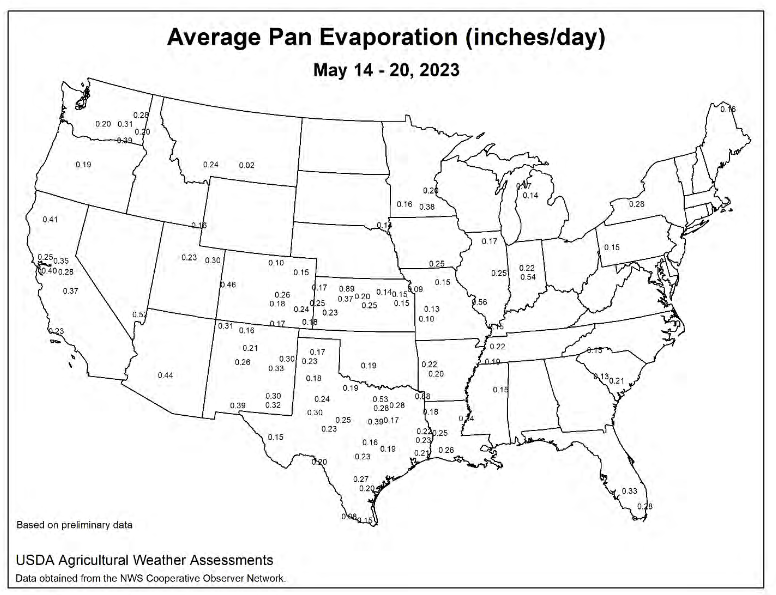
| Pan evaporation refers to the technique (water in a pan) for determining the amount of drying that took place in different areas. Sometimes satellite imagery is used instead of this old-fashioned method but it seems to be preferred in the weekly Crop Bulletin. Very high or low values might be the result of faulty measurement equipment but I did not notice any but I did not study the map carefully. The values that I see are pretty low. That is not surprising given the wet cool weather in much of the area where these readings were taken. When I see values greater than 1.0 I am concerned. |
–
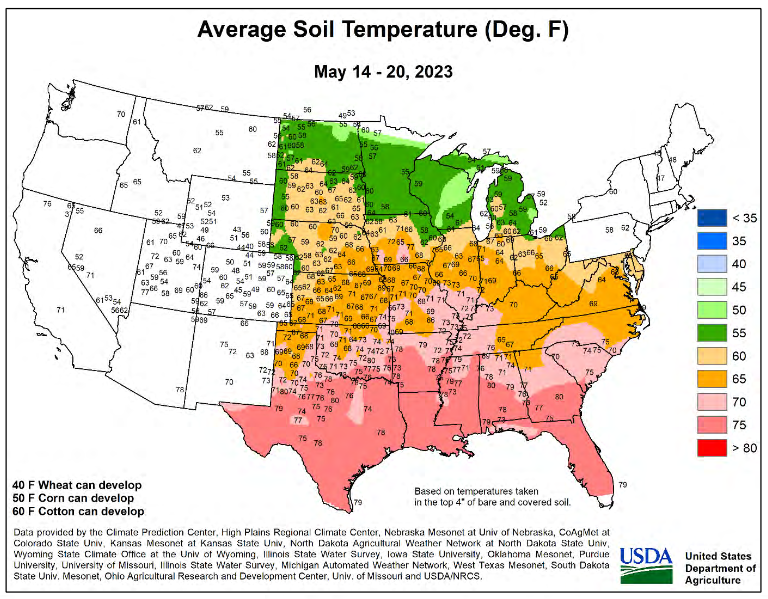
| The Northern Tier still needs to warm up a bit for corn to develop. Excess precipitation may be a problem in the Gulf States. |
What is shown below from this week’s USDA Crop Bulletin is just the highlights. Additional information on this from a media source can be accessed HERE. This is a topic worth exploring in more depth.
International
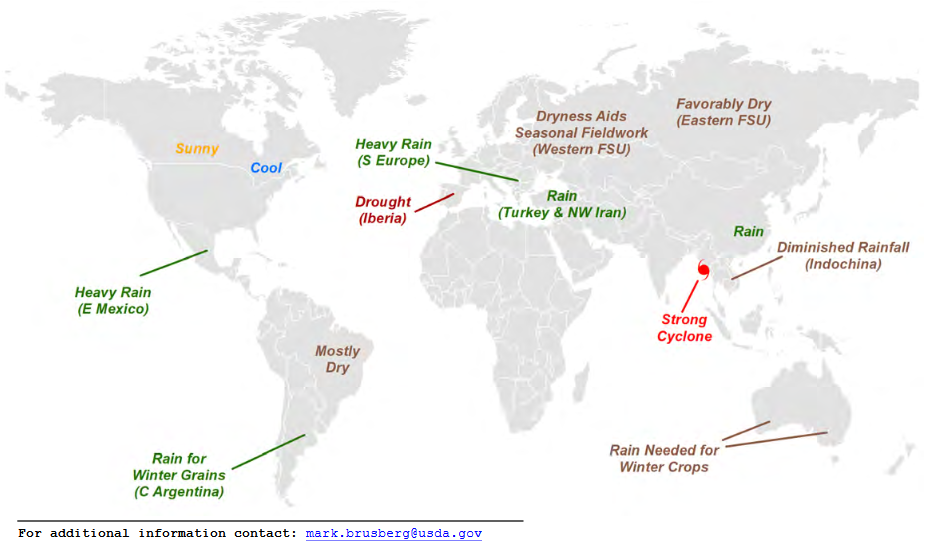
And the map
–
| This locates some of the information on a map. |
Sources of Information
Weekly Updates can be found HERE
and perhaps more directly HERE
Additional Useful Sources of Information
WASDE: World Agricultural Supply and Demand Estimates HERE
NASS Report Schedule HERE
Executive Briefings HERE
Economics and Prices HERE
| I hope you found this article interesting and useful. |
–