Updated at 4:15 a.m. EDT Monday, May 10, 2023 to include information on the Rio Grande in New Mexico
The mission of the National Weather Service Colorado Basin River Forecast Center (CBRFC) is to produce river, flood and water supply forecasts for the Colorado Basin and the Great Basin in support of saving lives and property and to enhance the region’s environment and economy.
In this article, I am providing a summary of the situation as of May 1, 2023. But I have provided links to obtain more current information. In a way, the situation is very good but not quite as good as it seemed to be on April 1 in the Southern portion of the Basin. But flood risk has increased in a few places.
I have also included information on the current reservoir storage levels including a few that are outside of the Colorado River Basin.
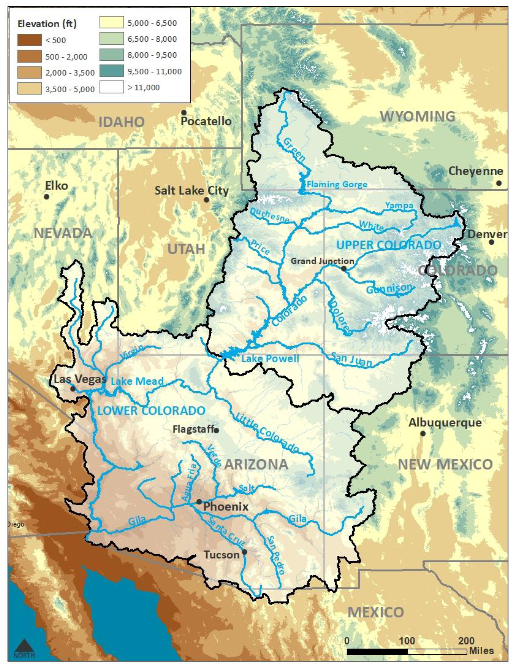
The image below shows the area covered in the CBRFC Report. But I am also providing some summary information for the Utah Basin. I might still add some information for the Rio Grande in New Mexico.
–
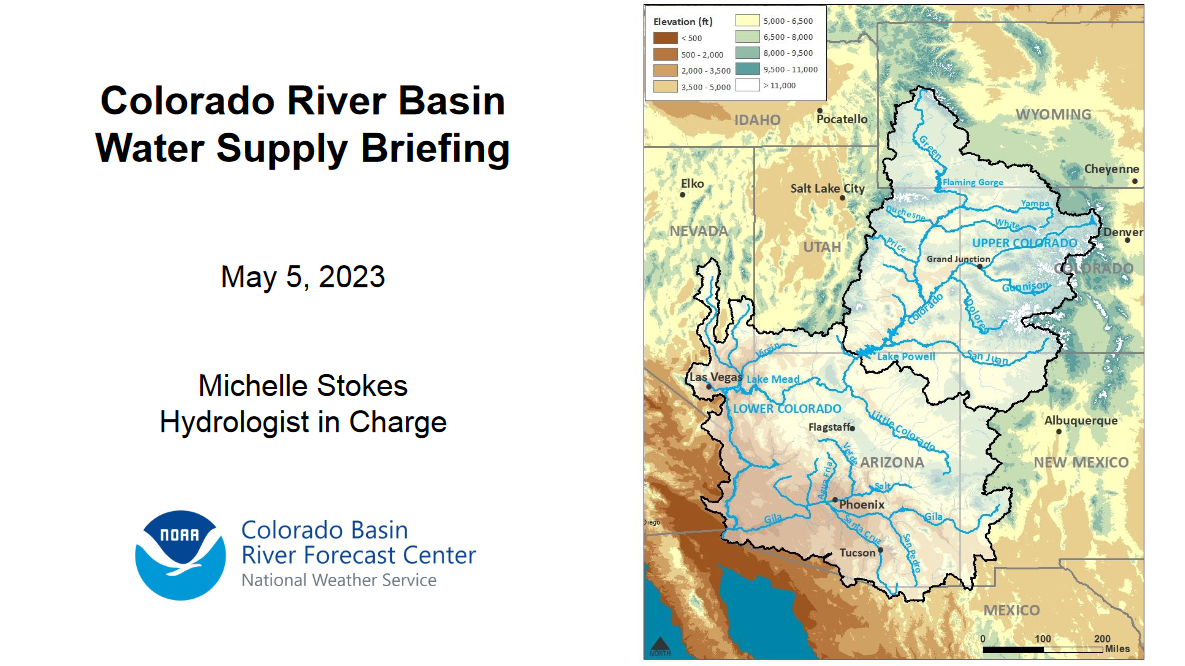
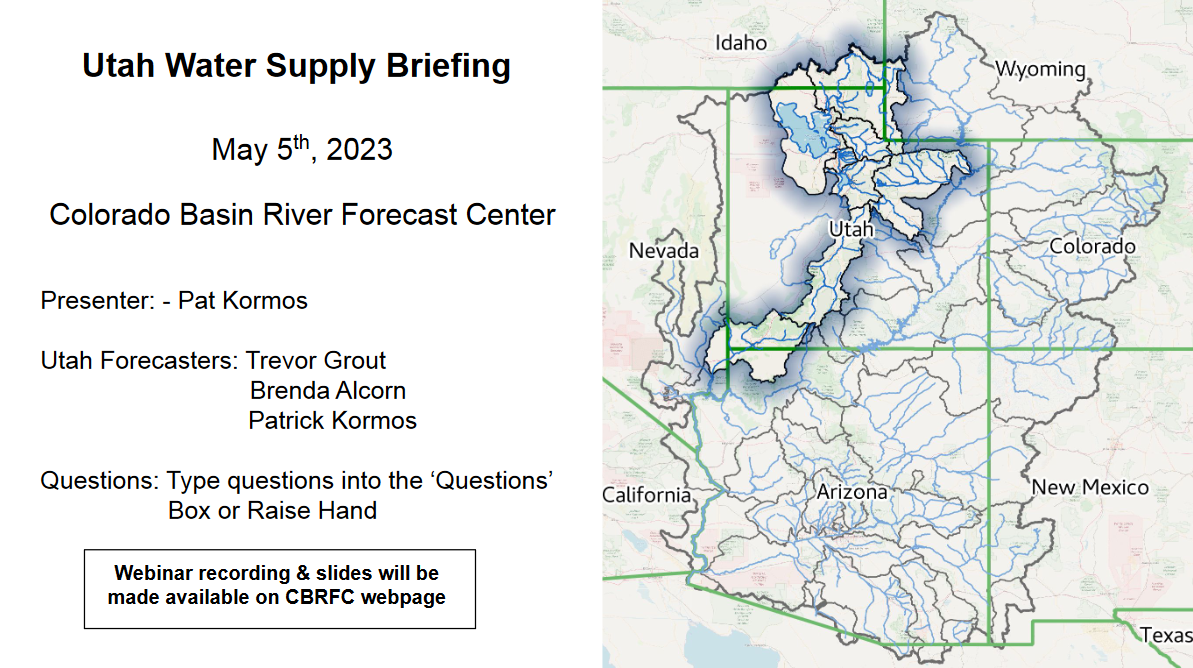
| Most of the information presented in this part of the article is from a report dated May 6, 2023. Here is a link to the Youtube of the May 6, 2023 presentation. If you just want the slides you can find them HERE. On the Colorado River Basin Forecast Center website (click HERE), there are certain graphics that update daily. You can also find your way to the Utah Basin Forecast but I provide a direct link to that later in this article.
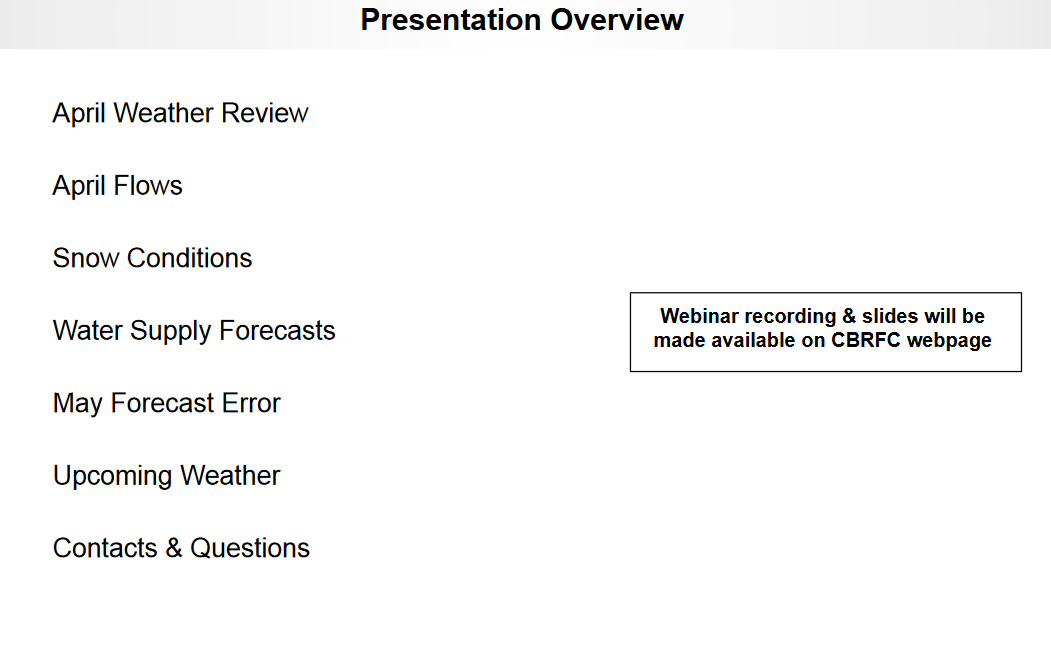
I have included more slides than usual in the article because this is such a very unusual water year (especially for a La Nina winter) but we have an unusual situation with record or near record snow and now issues related to possible too rapid melting causing flooding. So I wanted to show the different tools the CRBFC uses. This is also the last report of the season but the information will update on their site. For all practical purposes, we have switched from snow accumulation to snow melting and stream flow increasing. So I wanted to show the different parts of the region comprising the drainage for the Colorado River. It is a very large area. |
–
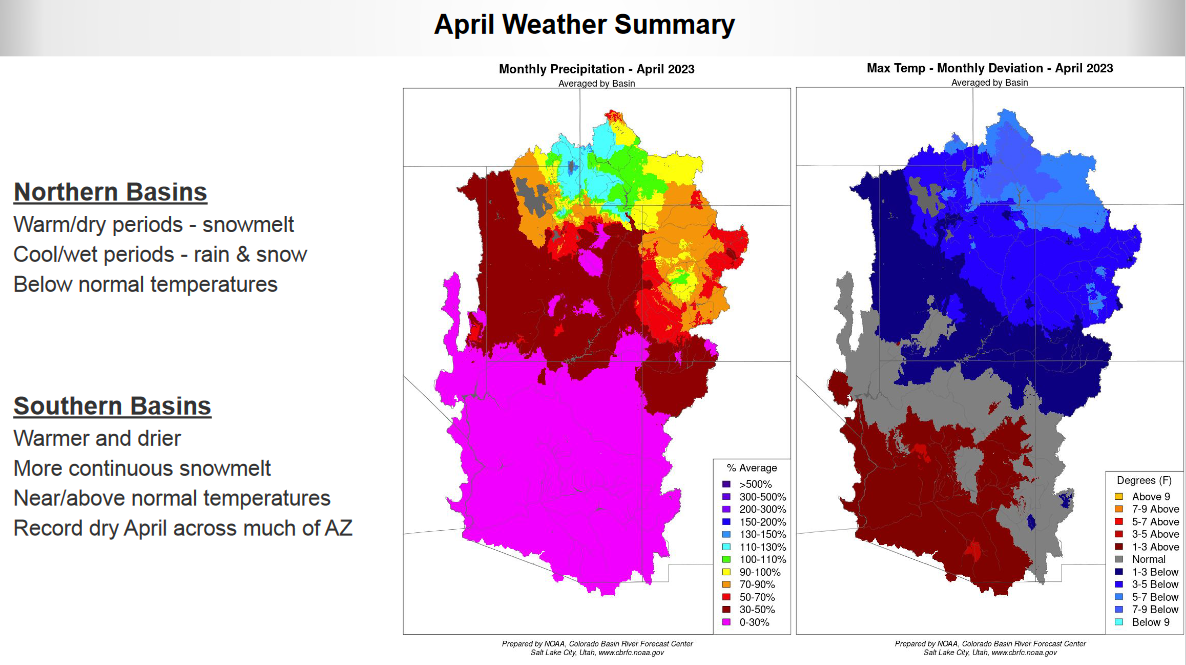
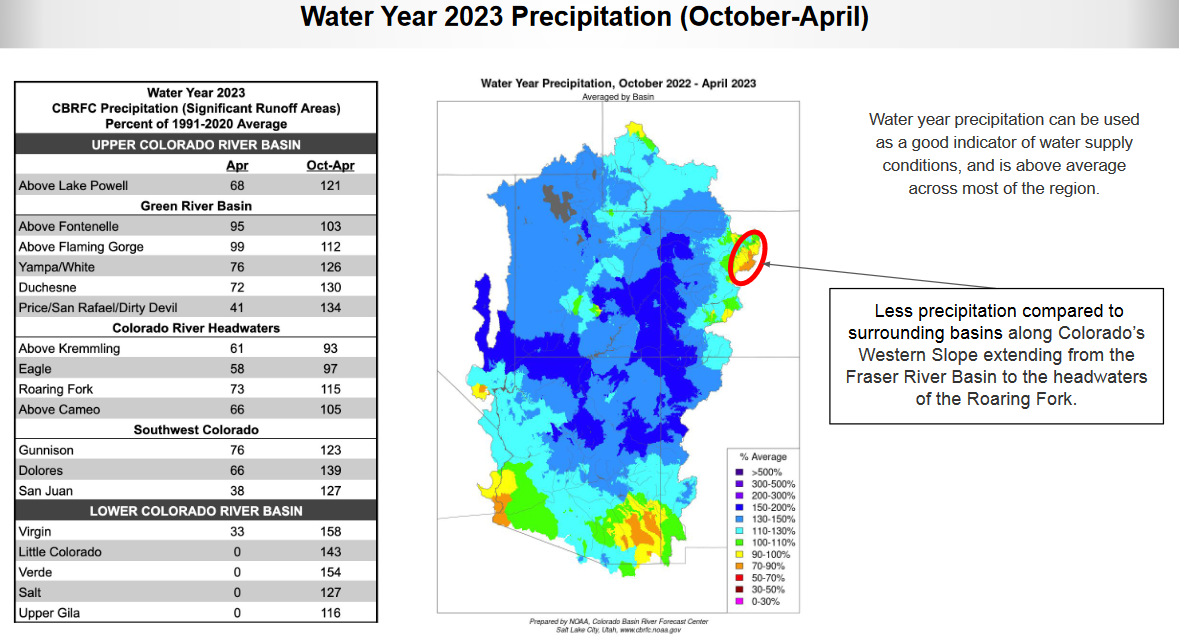
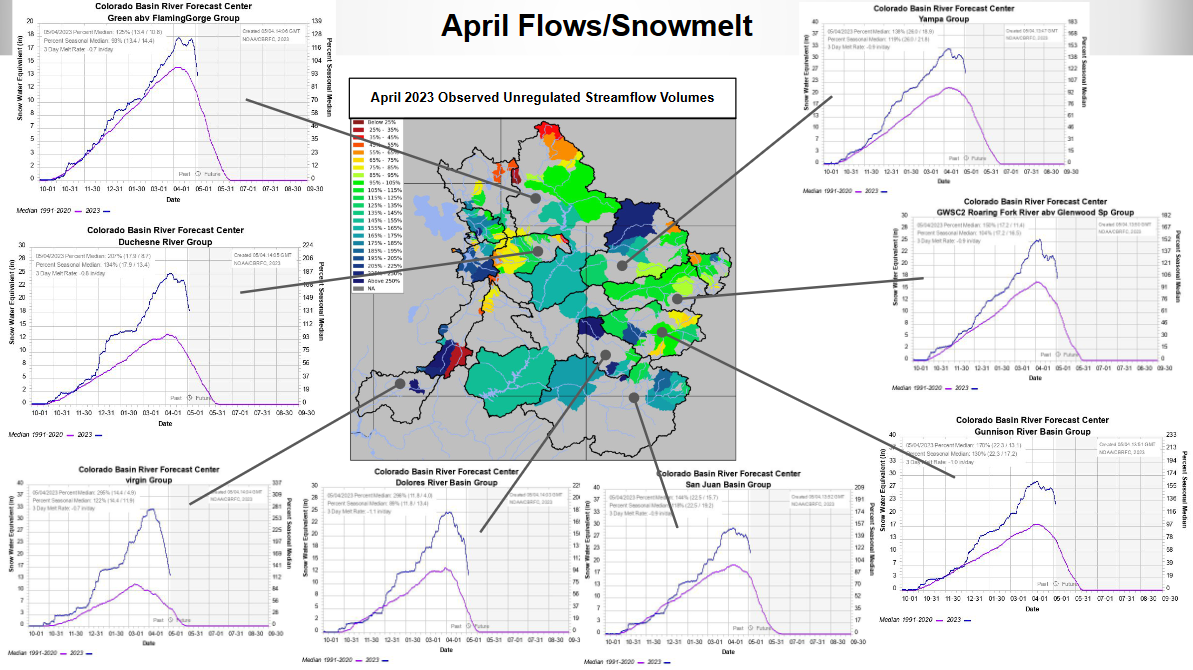
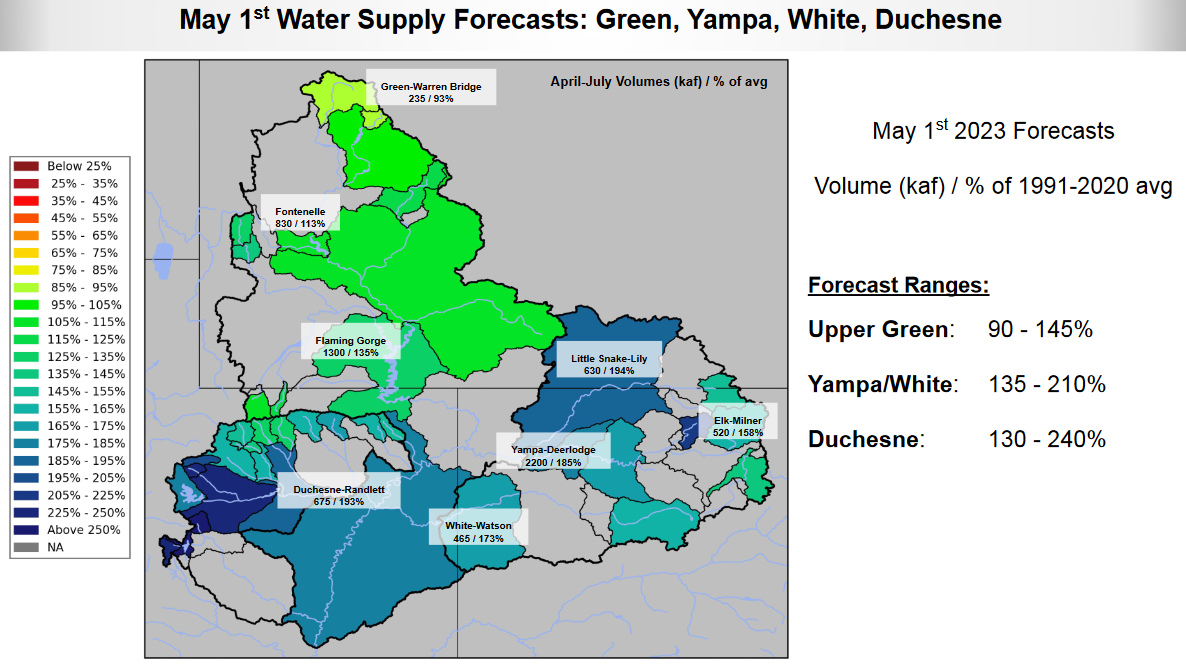
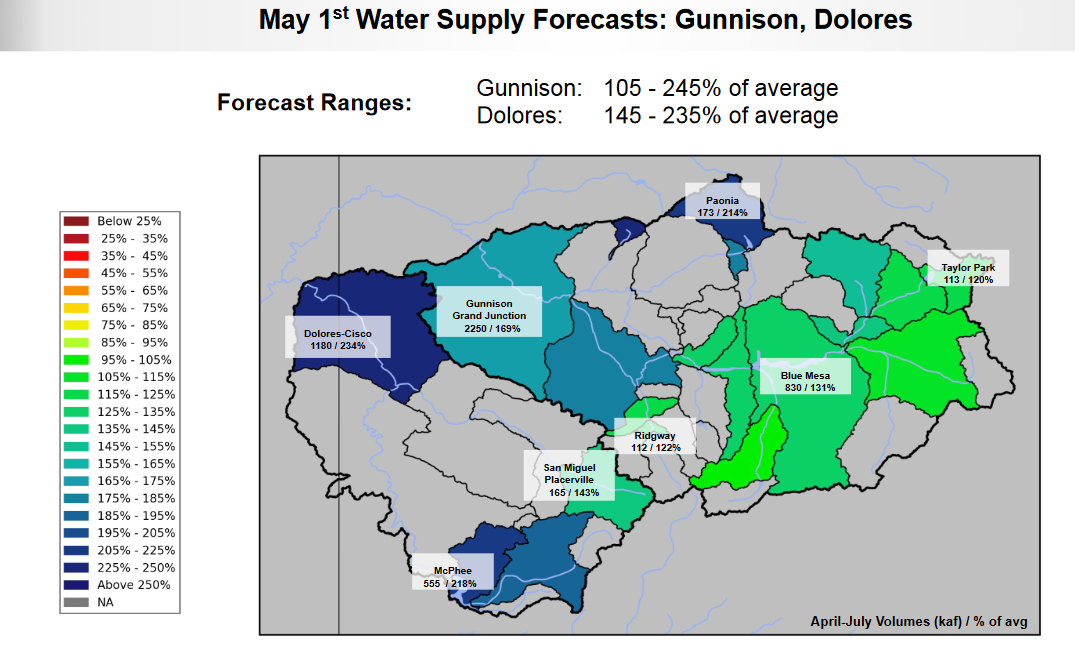
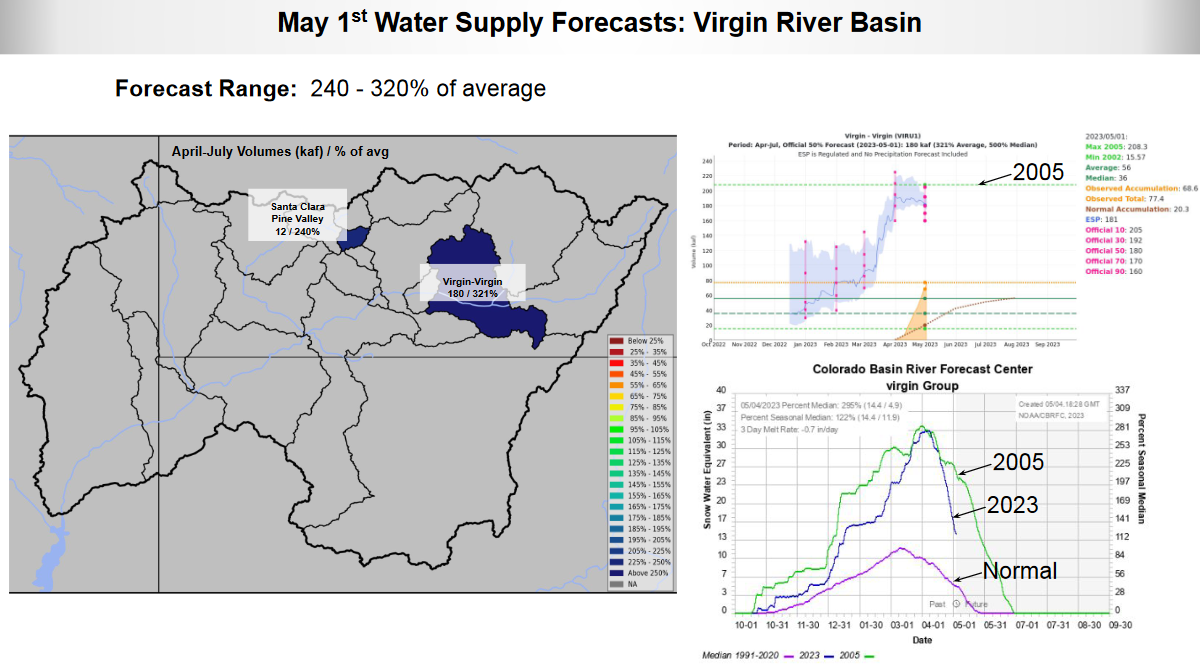
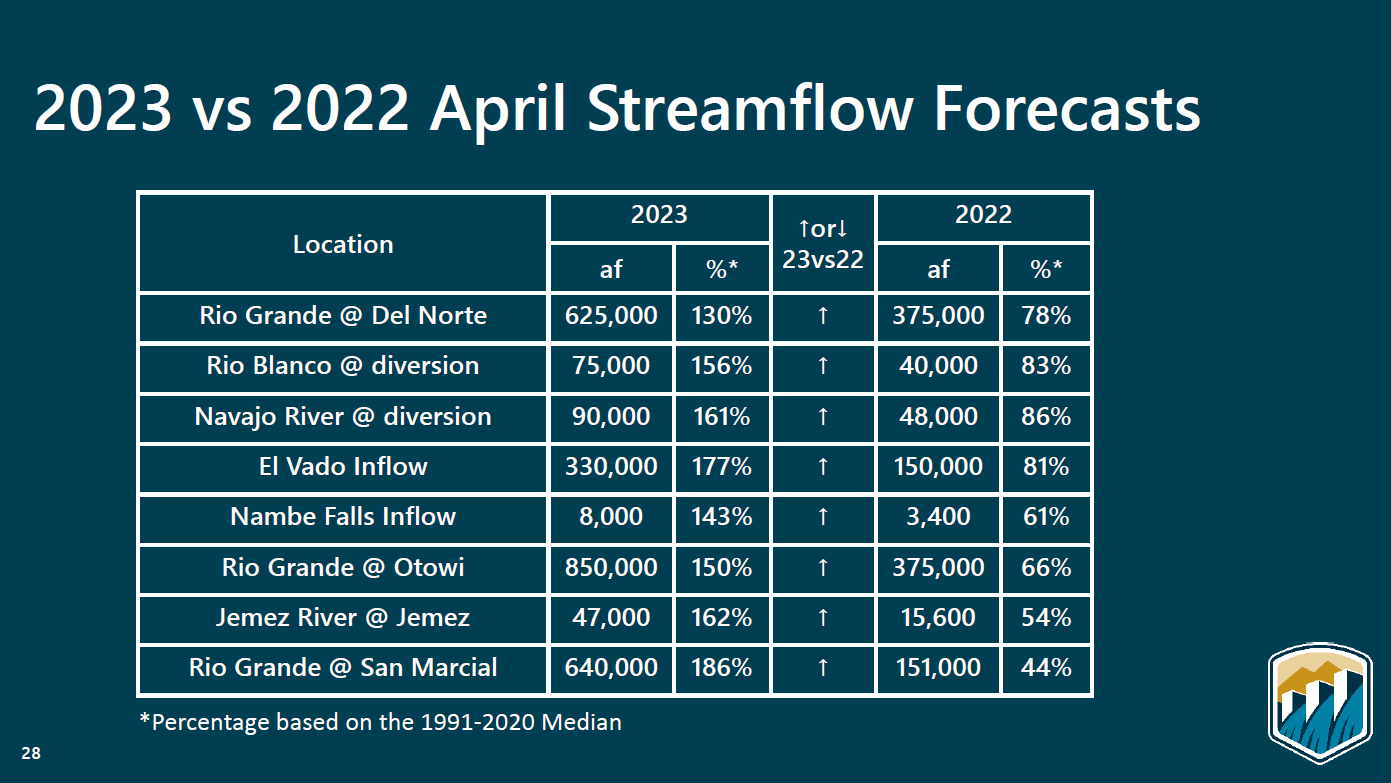
| April was not very good(notice the percentages for April are under 100) but the water year is still outstanding |
–
–
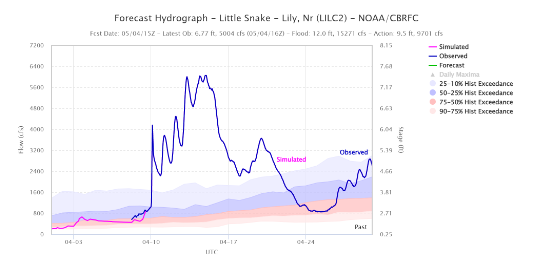
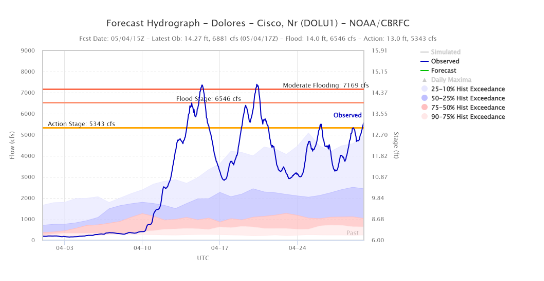
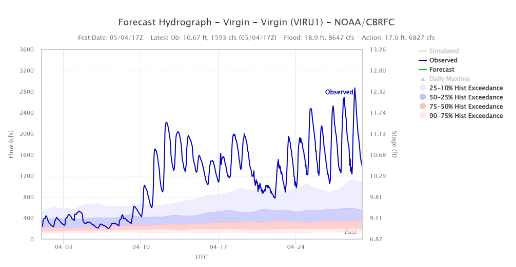
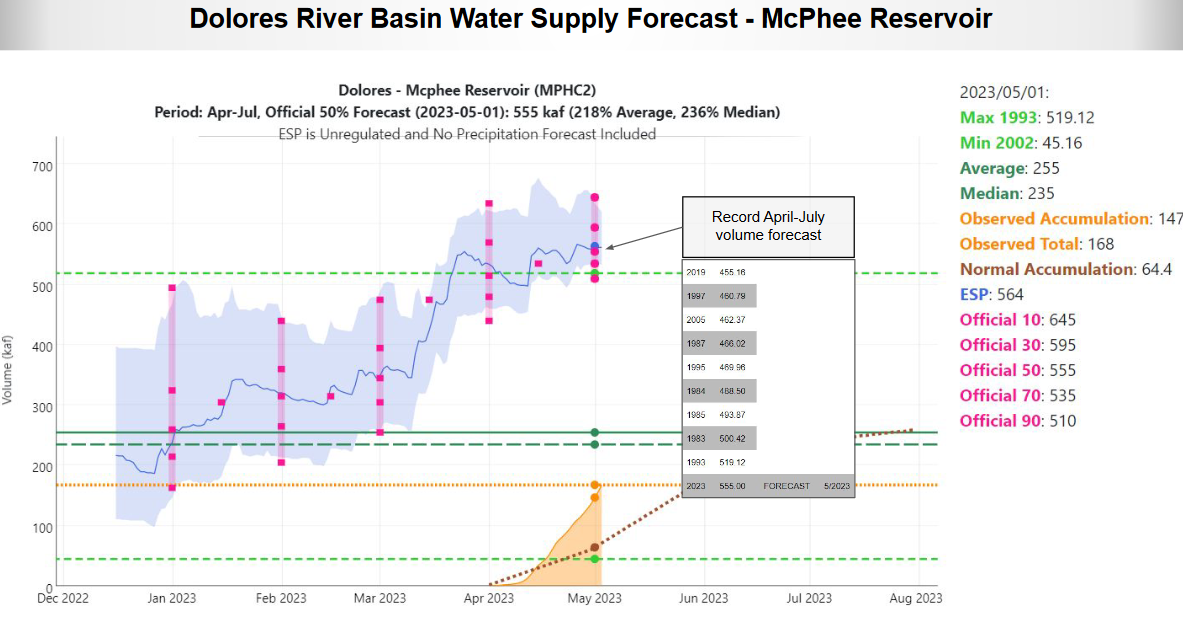
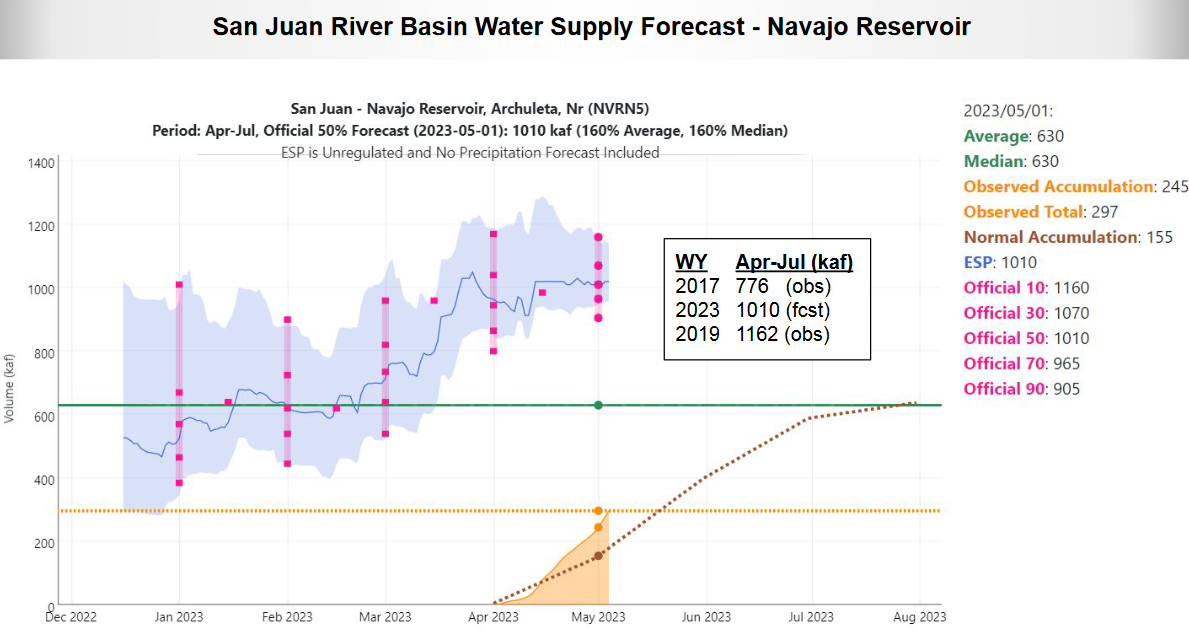
| These are larger hydrographs for three locations with very high streamflow. Along the bottom is shown the historical forecasts for April and above the actual streamflow this year. For one stream there was moderate flooding. The streamflow varies by day based on the temperature and new precipitation. The goal this year is to have warming happen gradually to avoid rapid melting. |
–
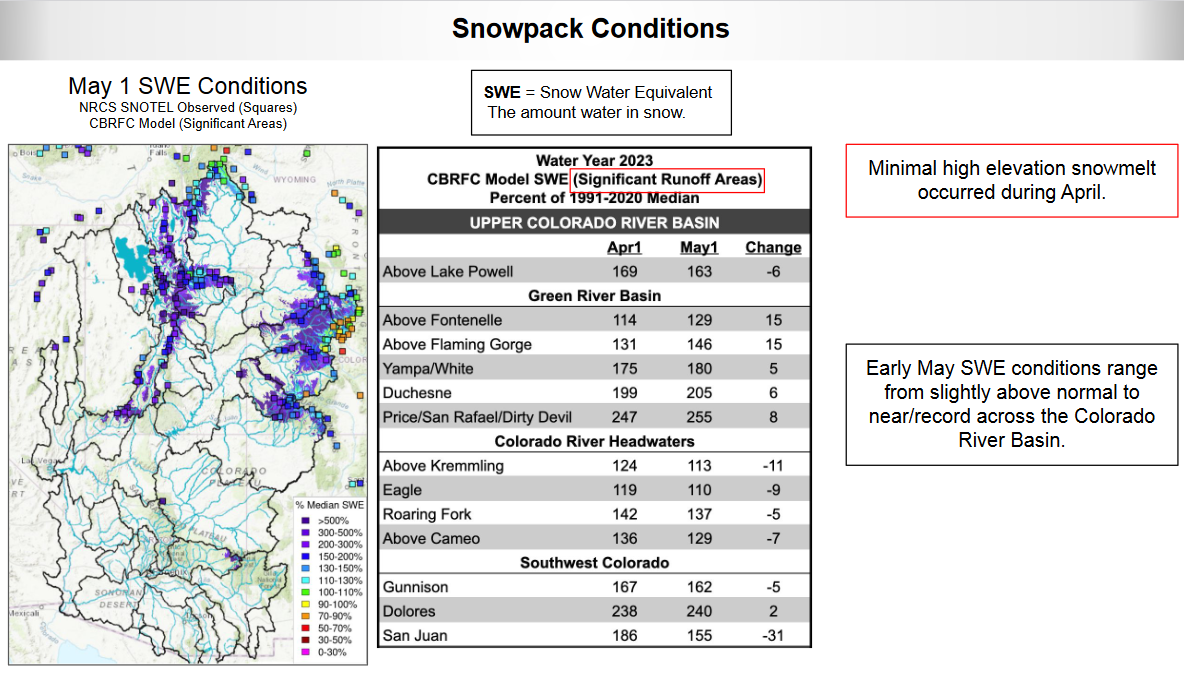
| This shows the SWE (Snow water equivalent has not changed much from the situation on April 1. But we also have to take into account that there has been some stream flow. So you would expect and actually want somewhat lower SWE at this point in time. |
–
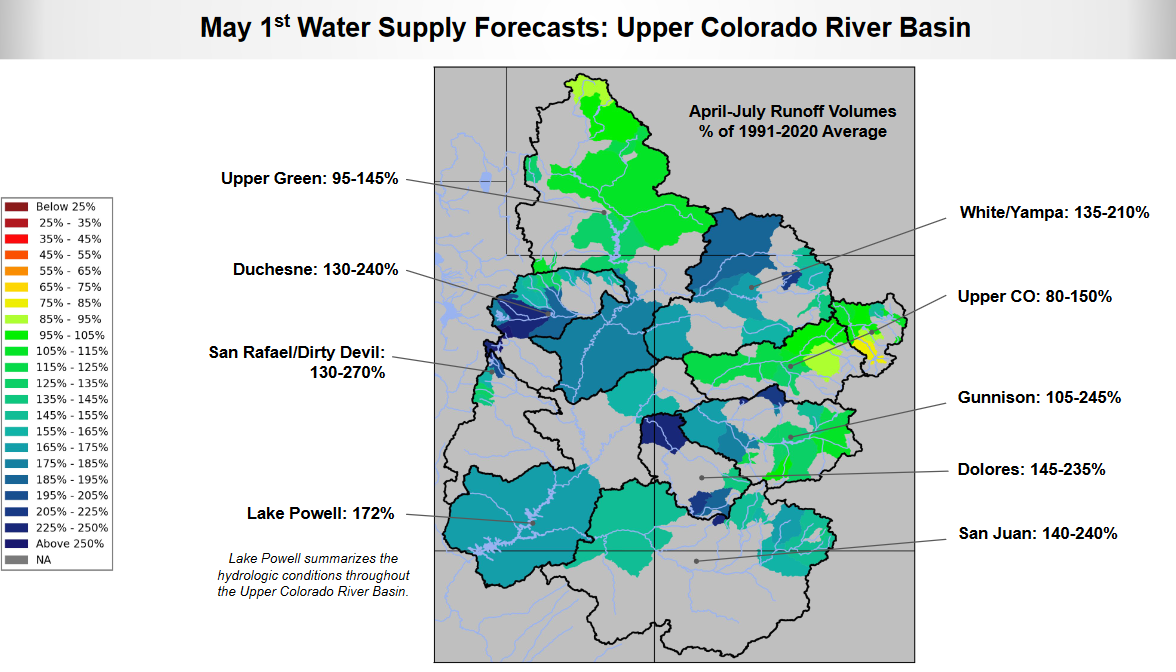
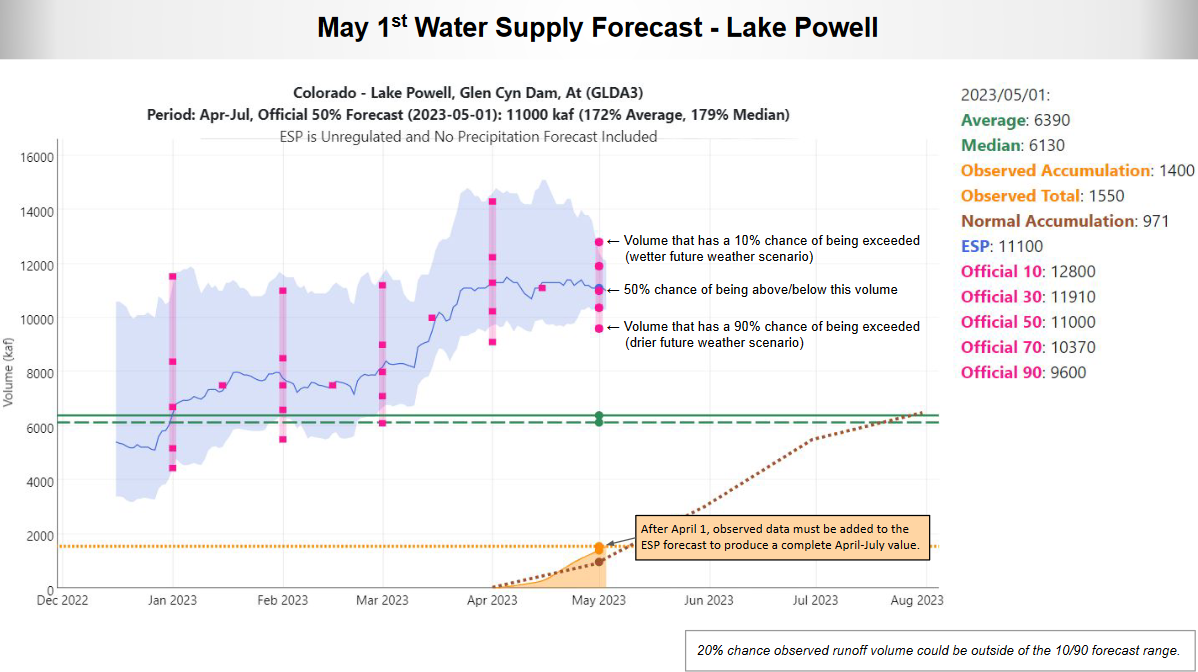
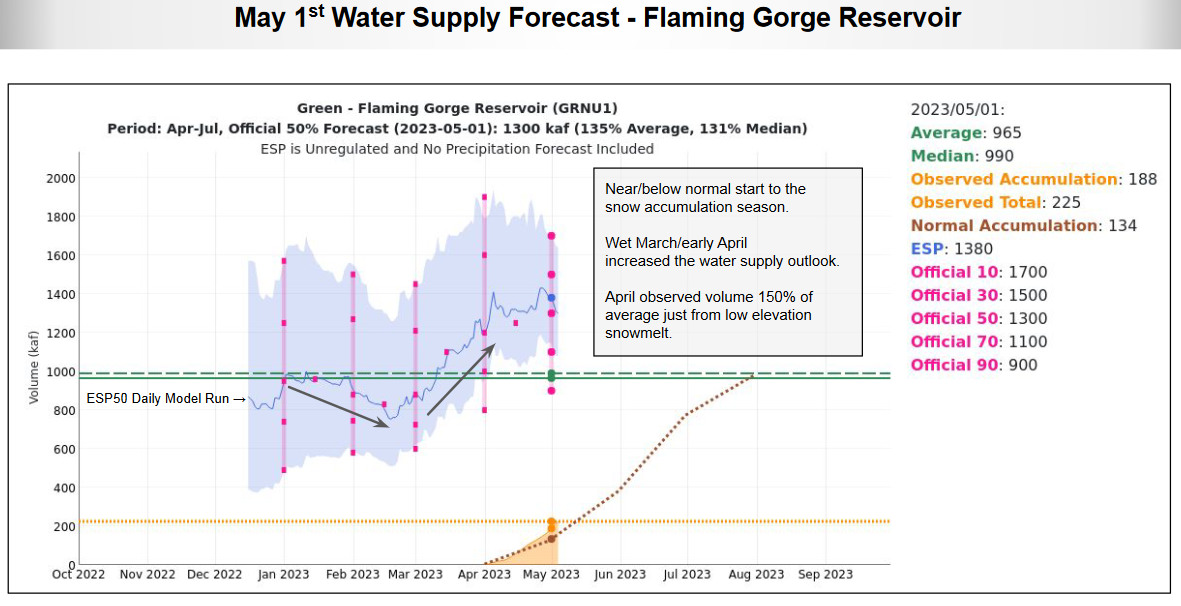
| This is called an evolution graphic. It shows how the forecasts evolve over time. There is kind of a pattern here. For many locations, the April 1 forecast improved dramatically due to a very wet March. April was relatively dry so the May 1 forecast is a bit reduced but still very good. Across the bottom, the orange area is showing the actual streamflow as it accumulates. The thirty-year average is shown and you can see if the current is above or below the thirty-year average. In the forecast, five scenarios are shown with the middle red dot being the level that has equal chances of being exceeded or not being exceeded. For Lake Powell right now it is 11,000,000 acre-feet. If that happens it would be 172% of the average and 179% of the median for the 1991 – 2020 period which is the current definition of normal. So this is badly needed and the only caveat is that the desire is that warming arrives soon rather than delayed but is not much above normal so that flooding does not occur. |
–
–
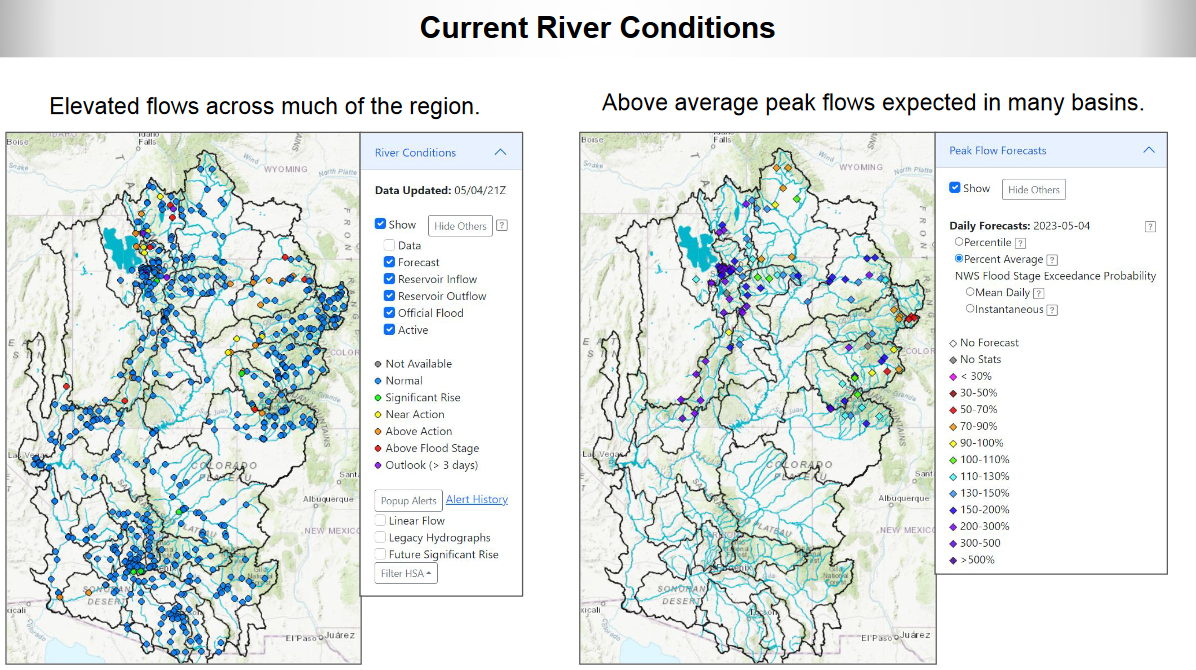
| Looks like a possible record-setting year. |
–
–
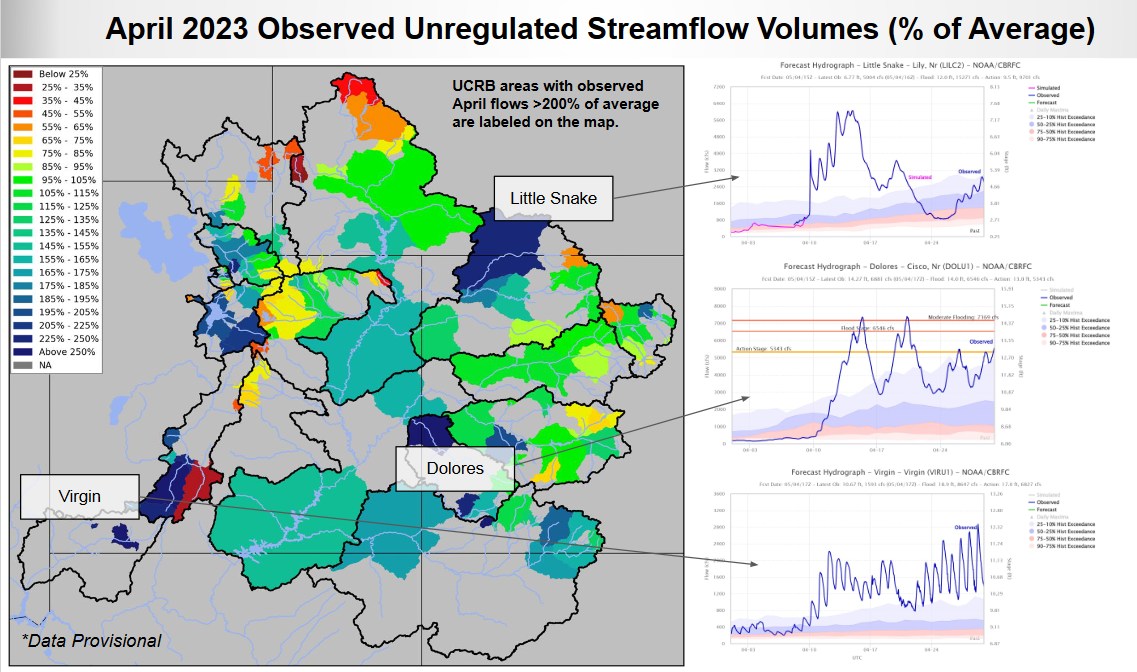
| This shows where there are already elevated flows and where high peak flows are expected. |
–
–
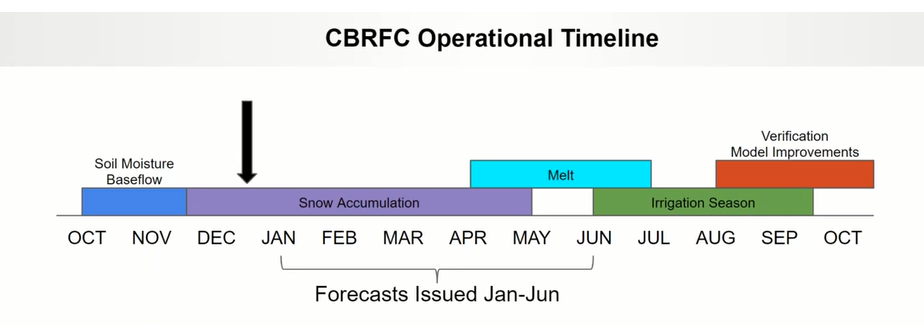
| The above is from an earlier presentation but shows the timing of events for the Operations of the Colorado Basin River Forecast Center |
–
Now we will take a look at the Utah Basin
–
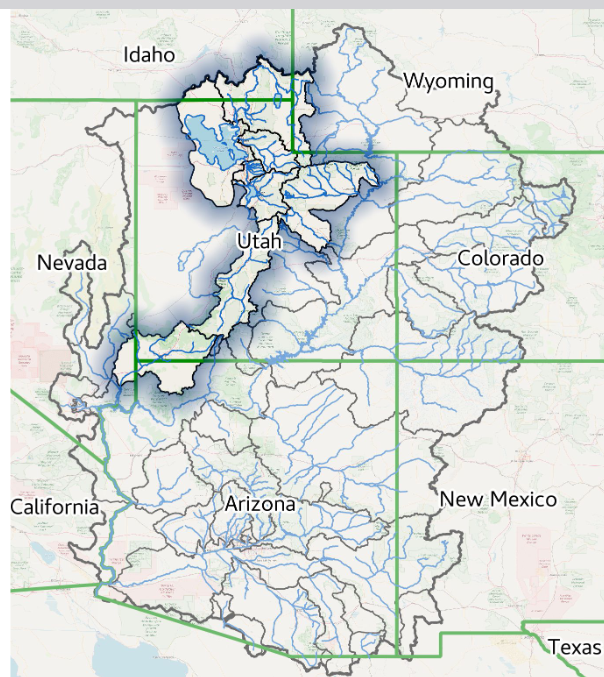
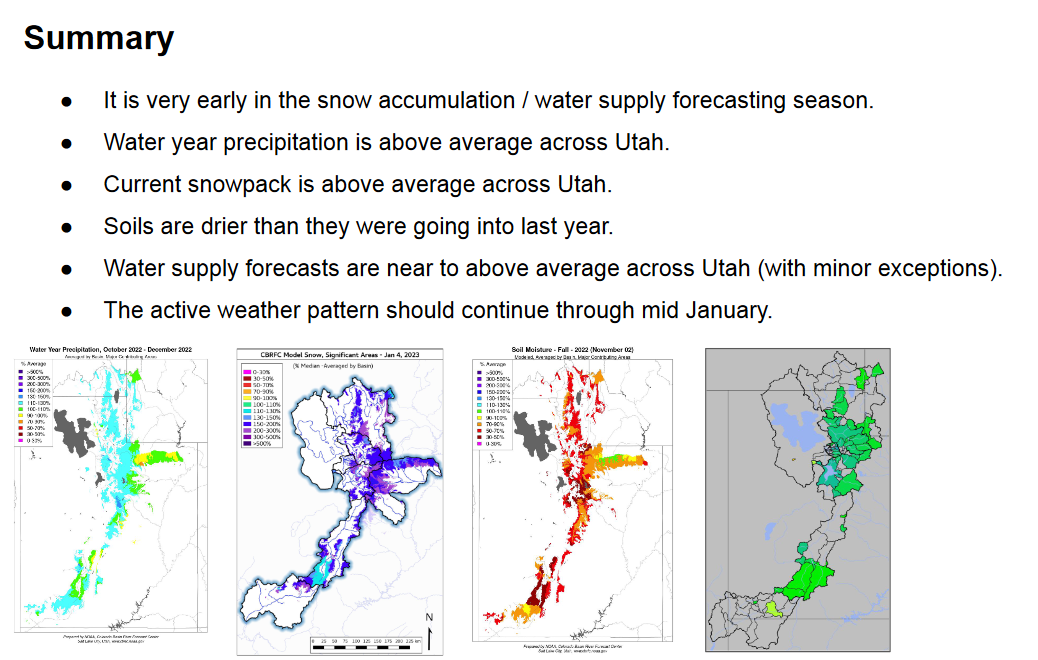
| This shows how the Utah Portion fits into the overall picture. I have included a lot of graphics. You can find the full Utah Set of Slides HERE. The format is very similar. The software used is the same. I am adding the Summary Slide. |
–
–
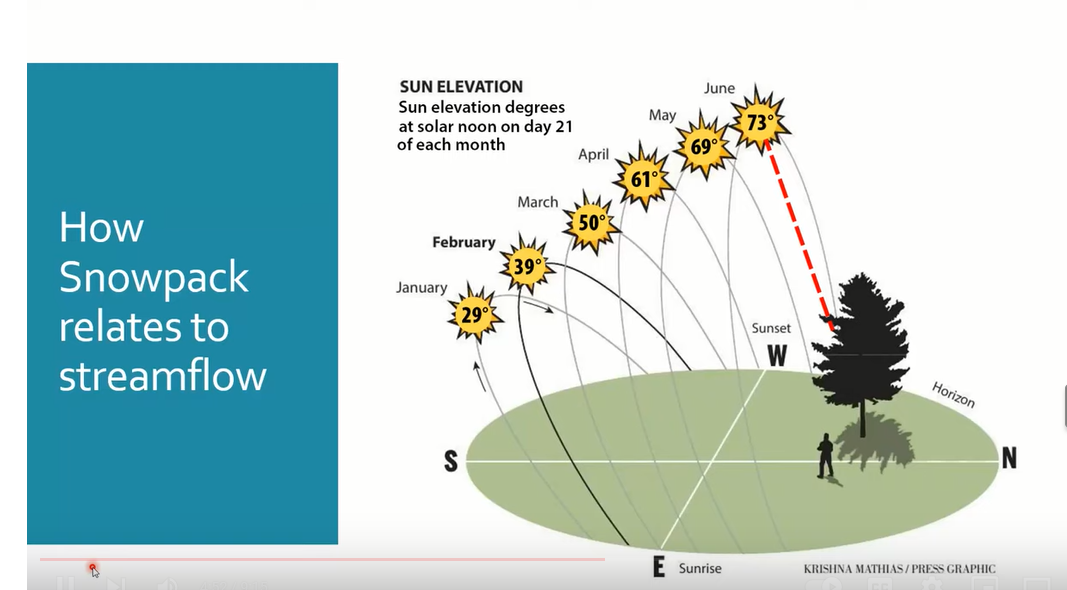
| The above is from a totally different source: Salt Lake County and it shows the sunlight elevation over time for Salt Lake County. The message is that if you have a lot of snowpack you want it to do considerable melting prior to June because in June you will get melting from many different angles and flooding is likely. |
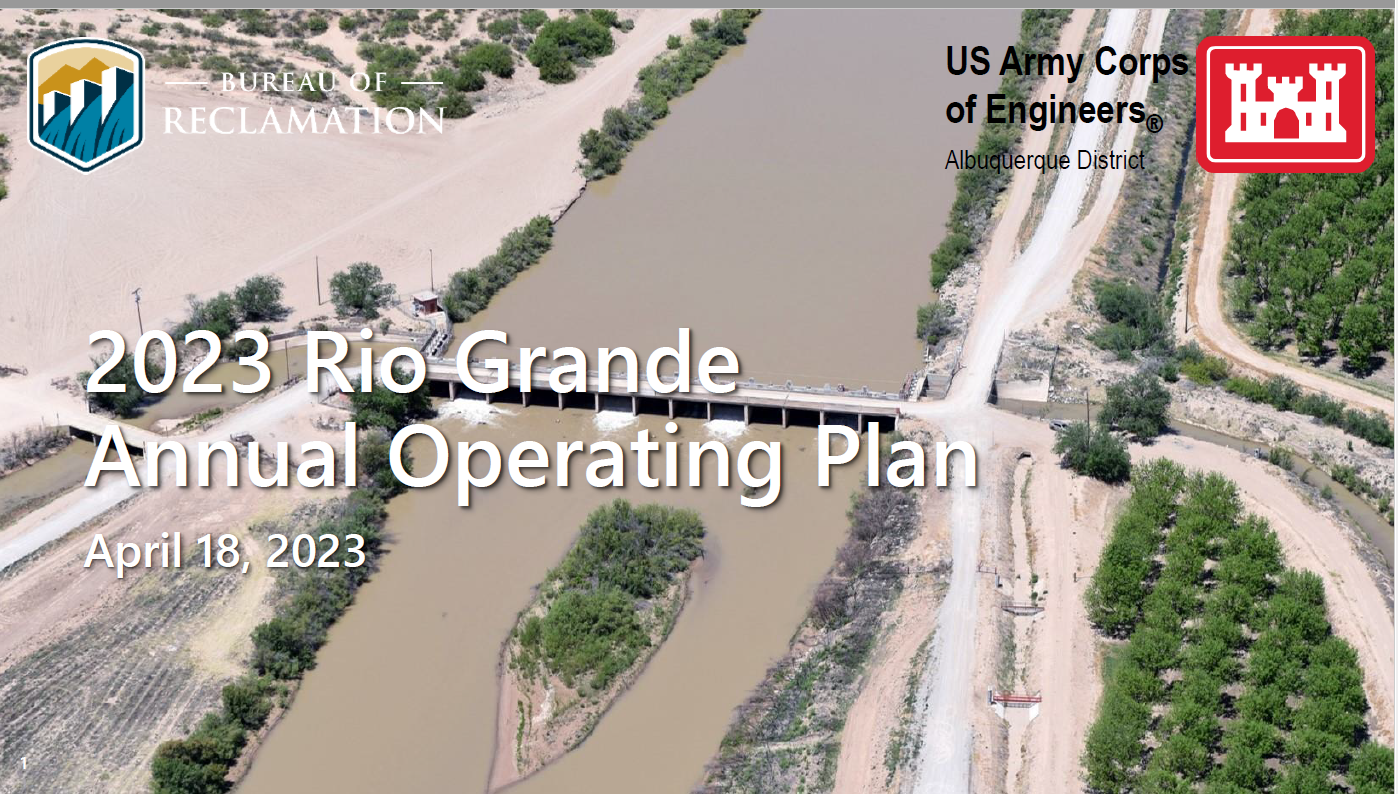
Rio Grande River selected slides from the 2023 Annual Operating Plan
| I realize that this is going to be hard to follow. It is the first time I have included information on the Rio Grande in this article. I am only showing selected slides and the presentation is a combination of meteorology, hydrology, engineering, and regulation. But I have felt that ignoring the Rio Grande in these articles was a deficiency so I am trying to fill in the gap. Please do not get too frustrated. |
–
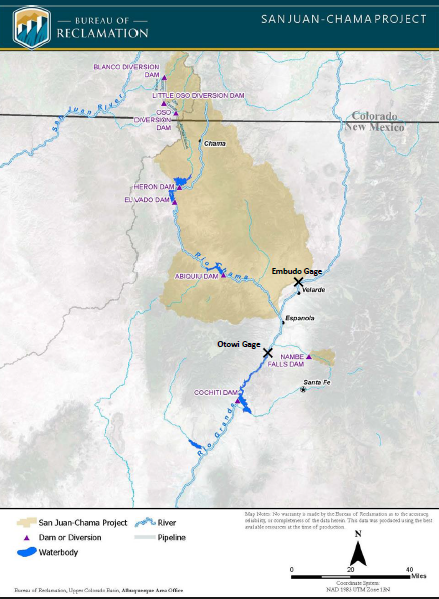
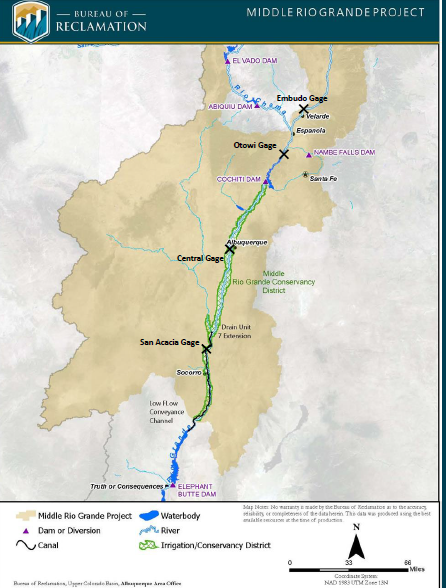
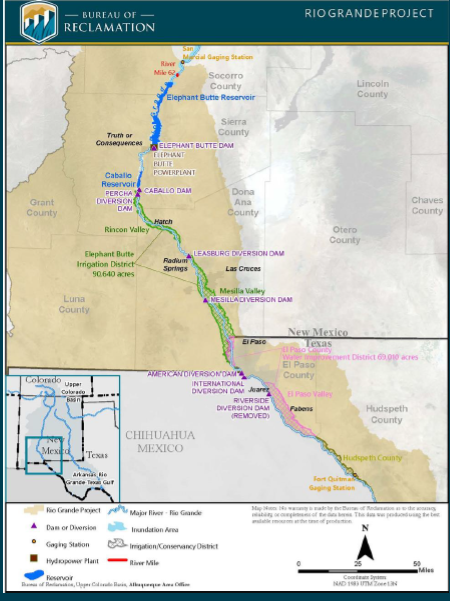
Let’s start with some maps. There is some overlap. The maps are focusing on how the USBOR manages the river. This does not cover the part of the Rio Grande beyond Fort Quitman in Texas. More information on this can be found HERE.
–
| Among other things, this shows that New Mexico does not operate it’s major river. The Federal Government does. That is true for most interstate rivers in the U.S. West. The reports I provide on the Colorado River Basin are not from the entities that manage those rivers. The U.S. Bureau of Reclamation and the U.S. Army Corps of Engineers manage most rivers in the U.S. They do a pretty good job of this and it is very challenging. The other presentations frequently refer to “unregulated flows”. In this presentation, we are talking about regulated flows. Some of the tools are the same. There is a lot of cooperation between those who analyze conditions and those who respond to those analyses. Also in prior presentations, I have not referred to Interstate Stream Compacts. I will only touch on that lightly here but it is very important. The State of New Mexico does play a role. The interactions are very complex. The purpose of this article is to report on current conditions and forecasts not to address the legal issues. I have written on that before and will again but that is not the focus of this article. |
–
–
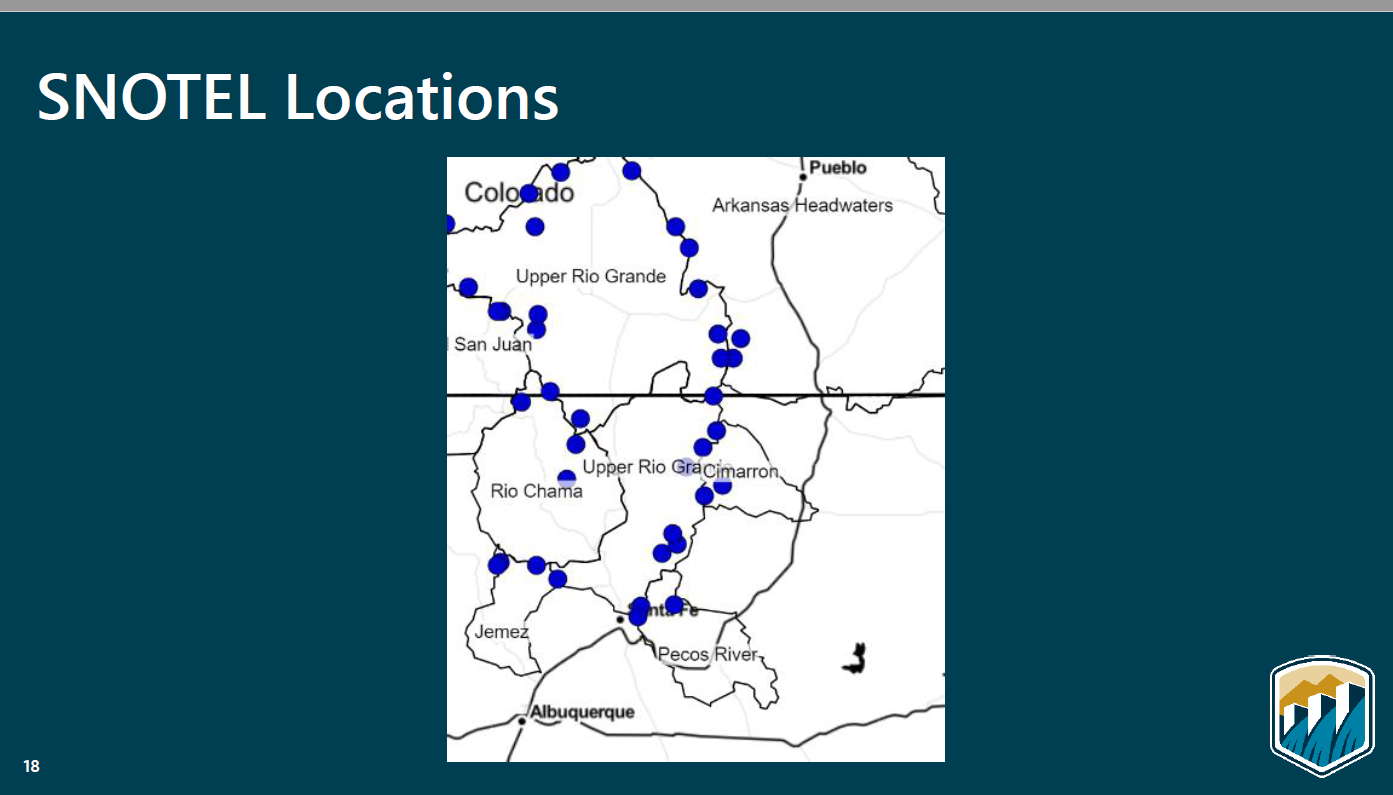
| Again the SNOTEL stations are the primary inputs into the forecast. I think the models used by the CBRFC are in some ways more advanced than what New Mexico uses but the problem is different. There are fewer sources of water for the Rio Grande. New Mexico has sophisticated tools for managing river flows. So there are similarities but also differences. |
–
–
| This is very important and somewhat similar to what I have shown for the Colorado River Basin. IT SHOWS THAT THIS YEAR IS BETTER THAN LAST YEAR JUST AS IS THE CASE FOR THE COLORADO AND UTAH RIVER BASINS. Again it is the 50% exceedance forecast. But it was made earlier than May 1 and I do not have updated data for May 1. |
–
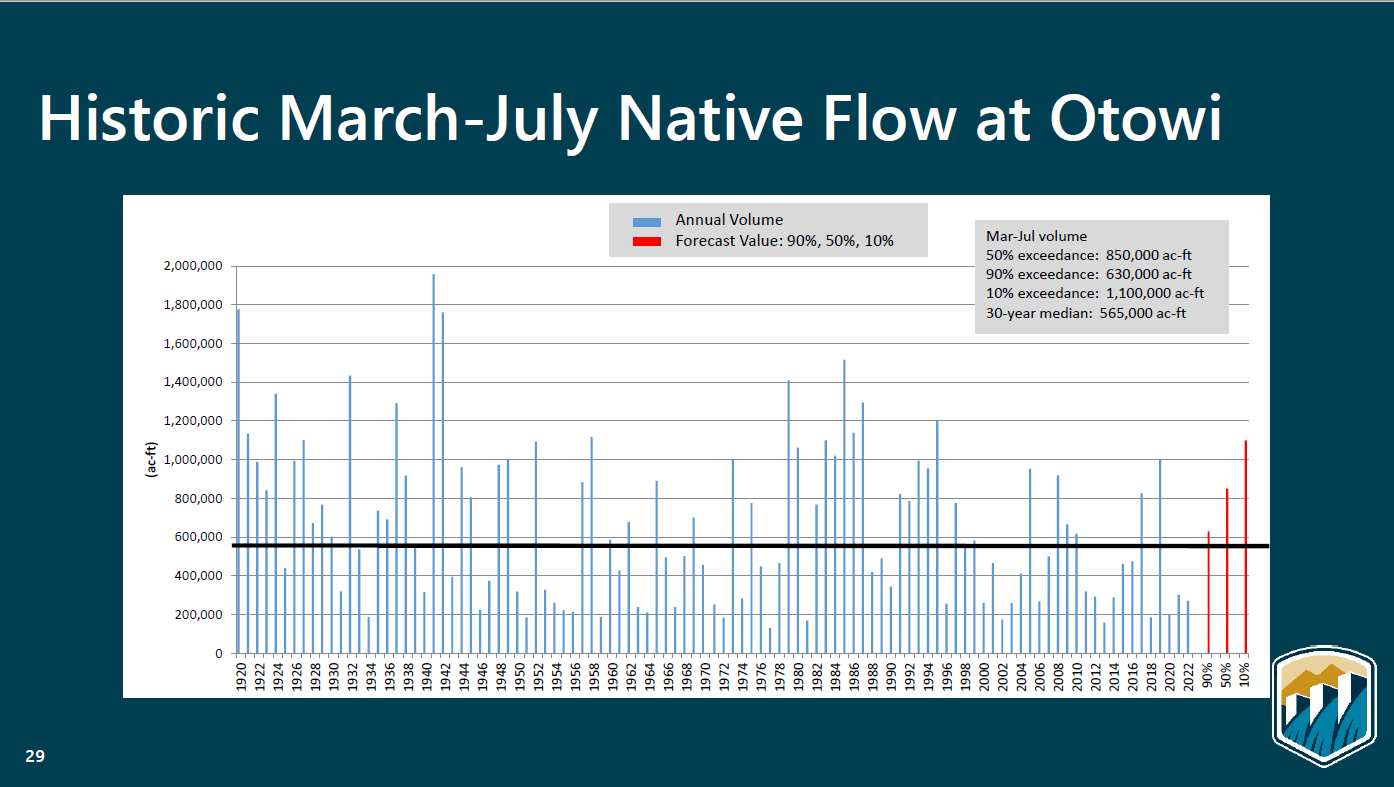
| This is very important because the flows past the Otowi Gage determines the required deliveries to Elephant Butte. For those who want to understand the Rio Grande Compact, HERE is a link. I might separate articles on some of these Interstate Agreements the main one being the Colorado River Compact but they are all important. |
–
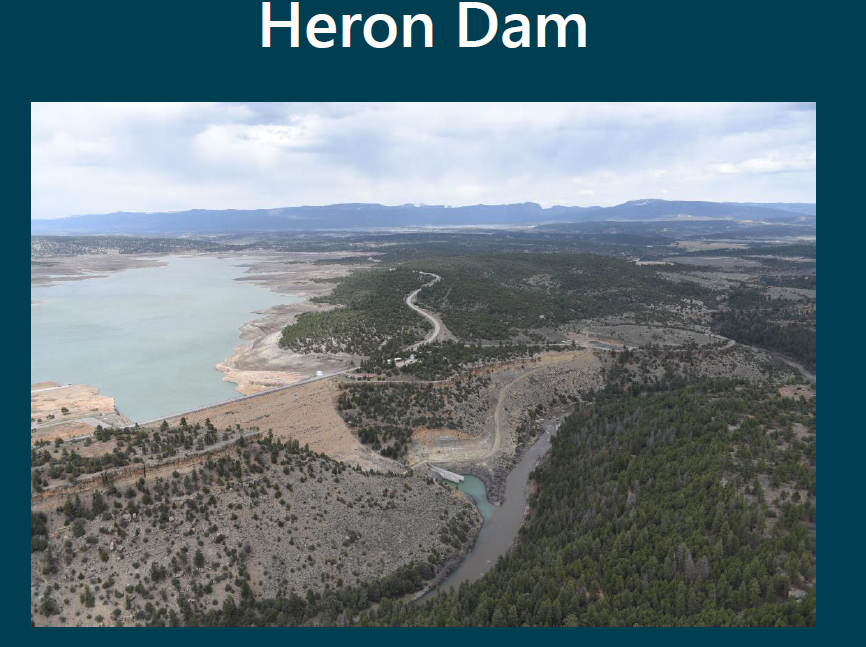
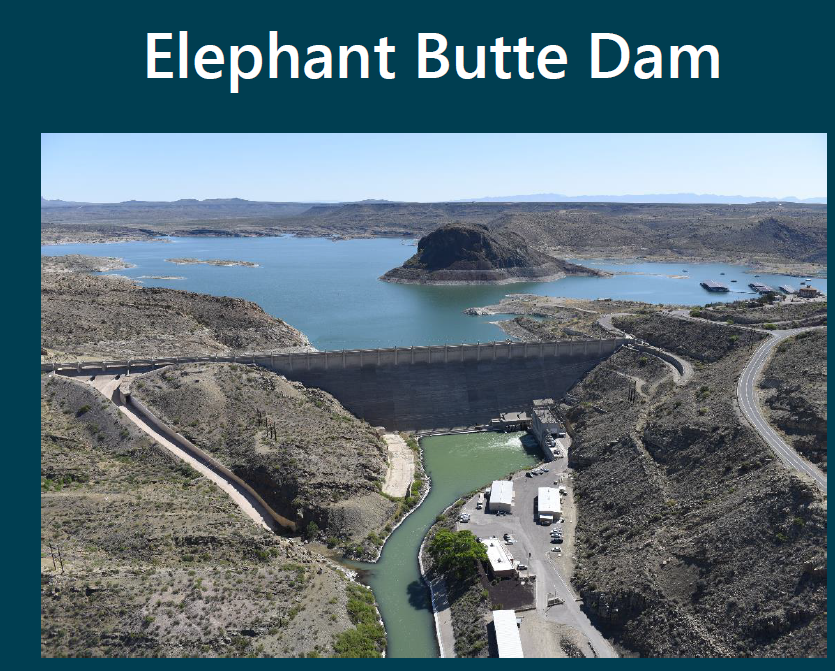
I wanted to show what some of the reservoirs look like. They are beautiful. Here is one
This discusses another key reservoir that is under construction
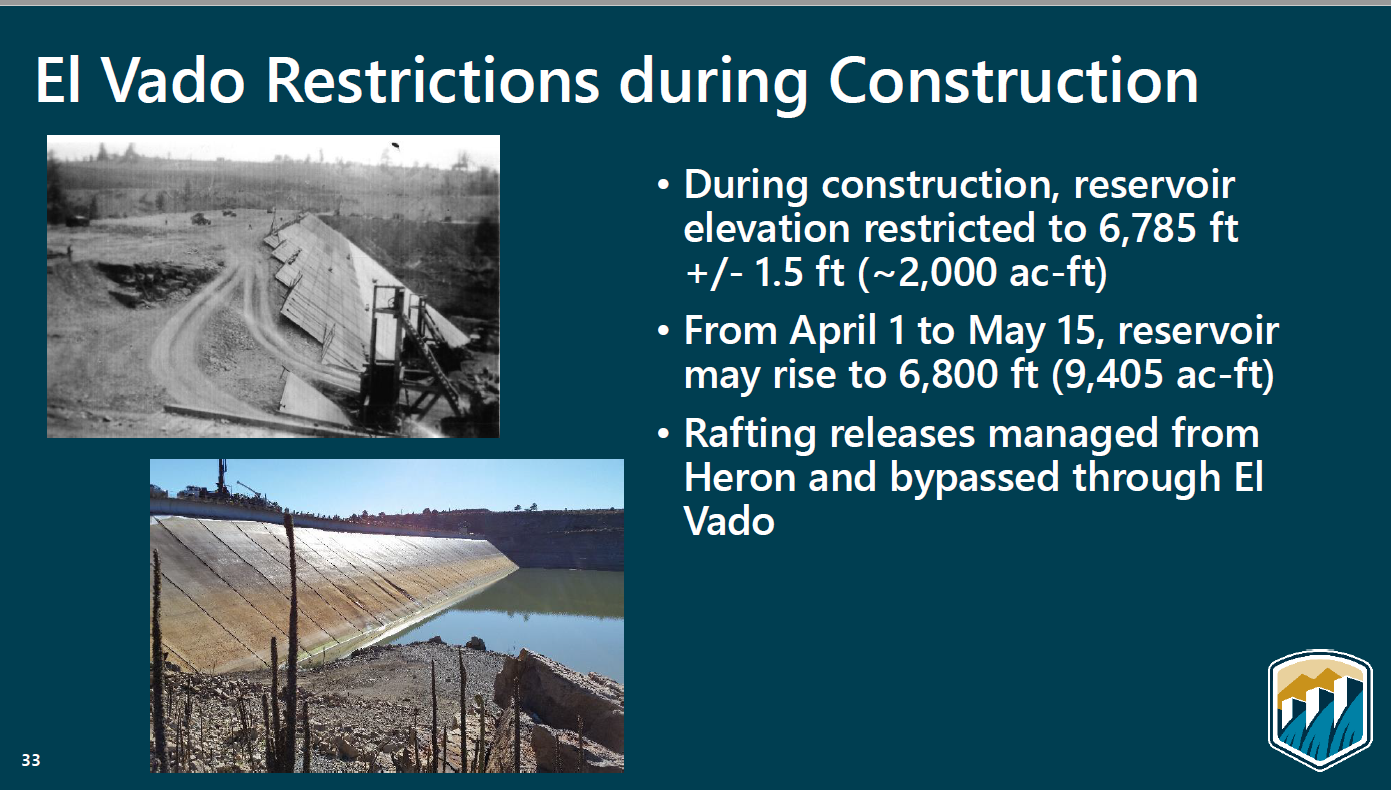
This is relevant to this dam
–
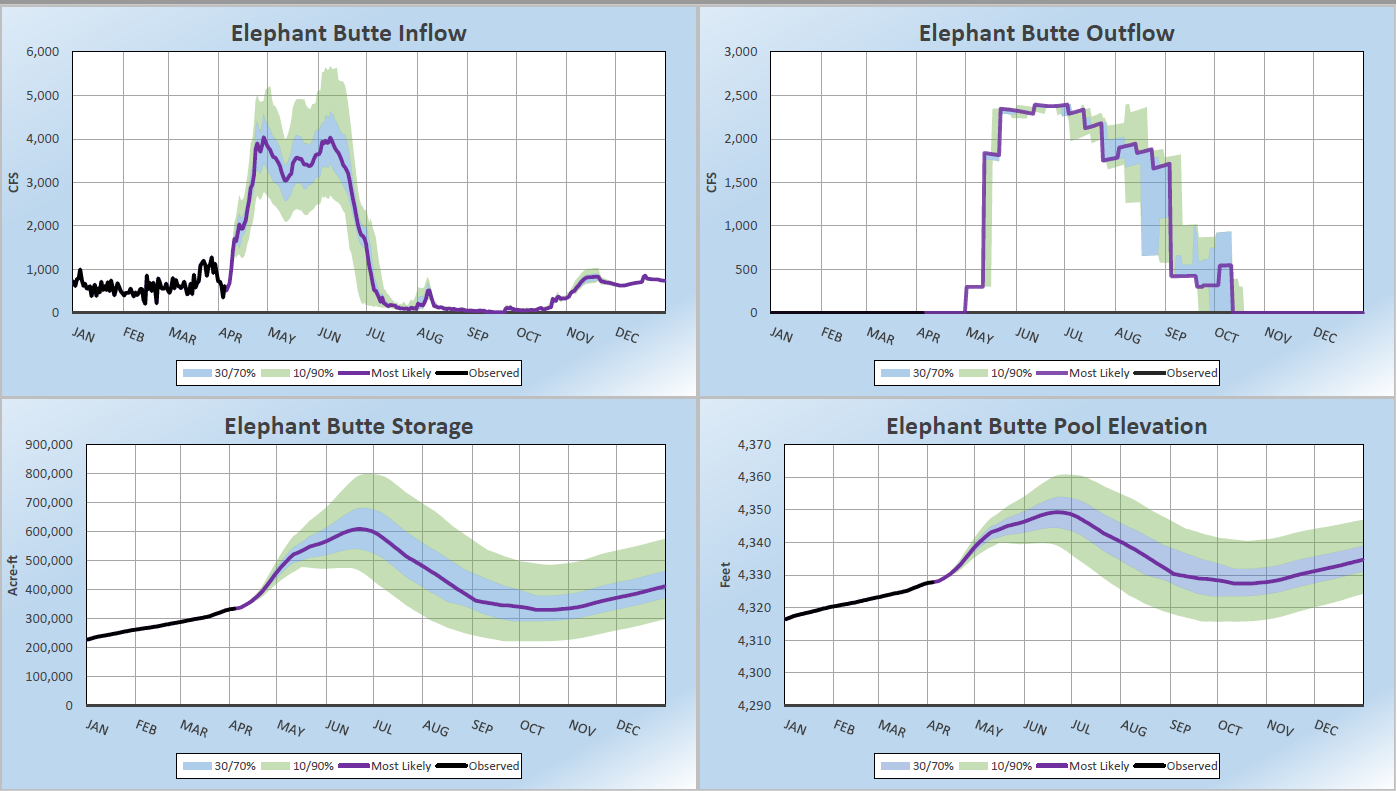
| And as with the information for the Colorado River and Utah Basins, it is showing the 10%, 30%, 50%, 70% and 90% exceedance forecasts. So there is a lot of similarity among those who work in this field. |
–
–
–
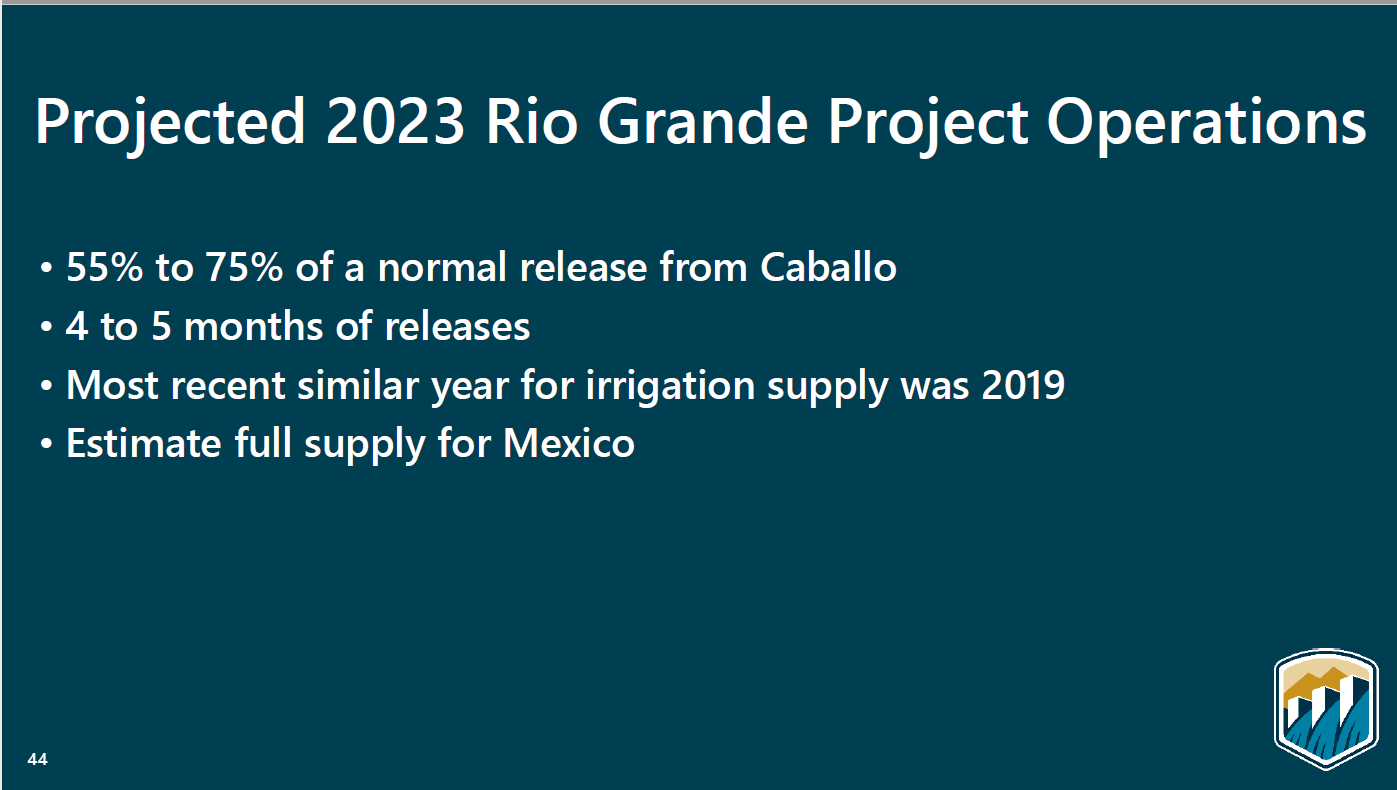
| This is important because the outflow from Elephant Butte Reservoir is the input to another administrative arrangement that impacts one irrigation district in New Mexico, One in Texas, and another in Mexico |
–
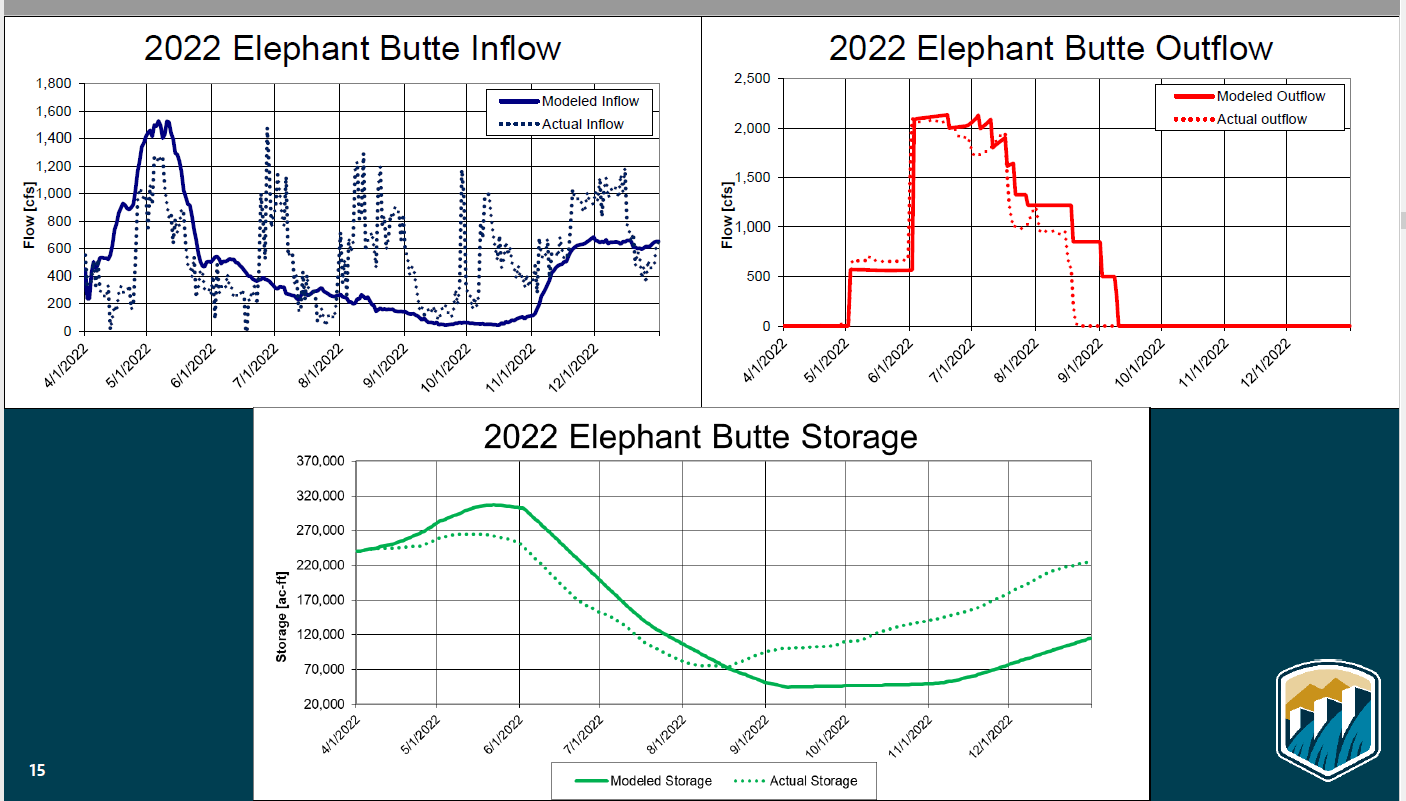
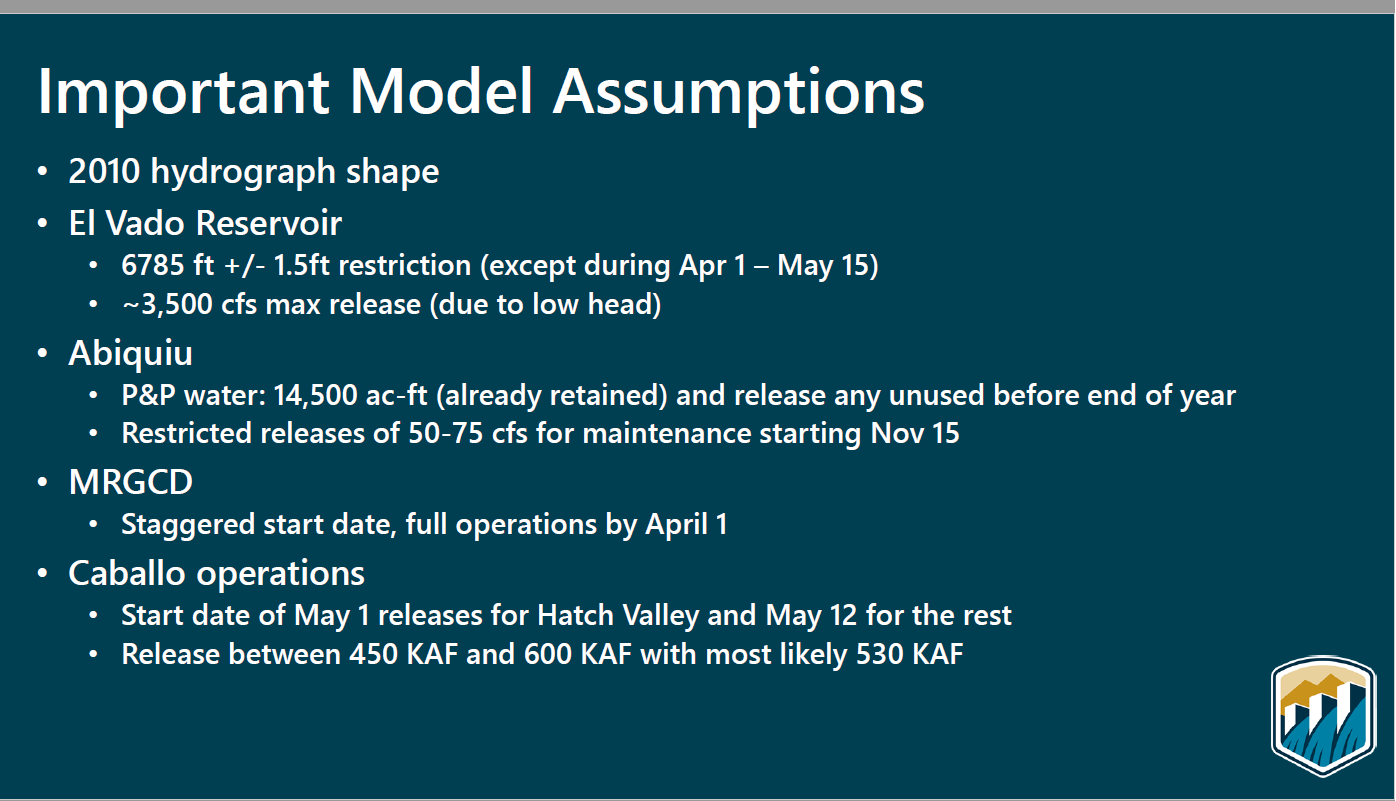
Let’s look at the key dam on the Rio Grande
–
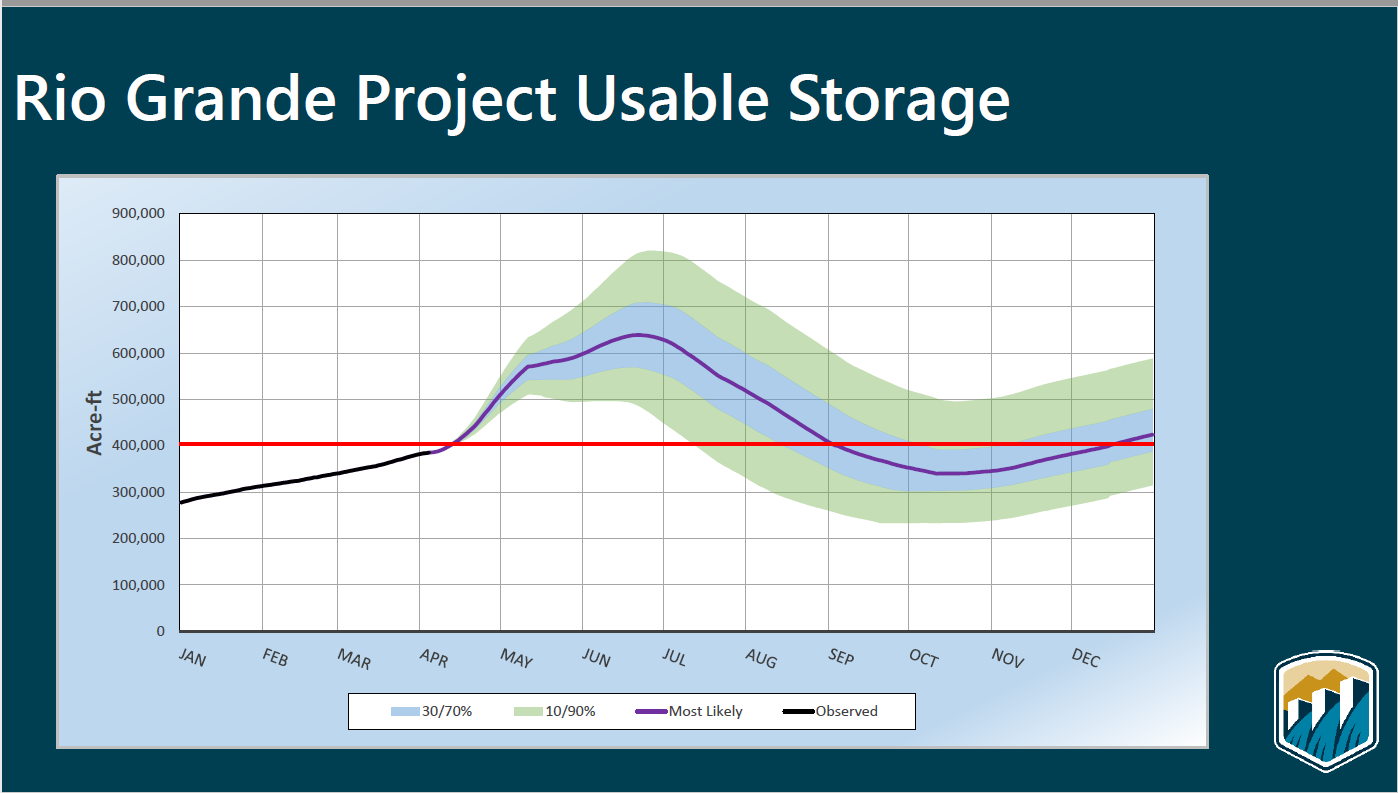
| This is important for a number of reasons but the 400,000 acre-feet storage level determines some of the rules under the Rio Grande Compact. |
–
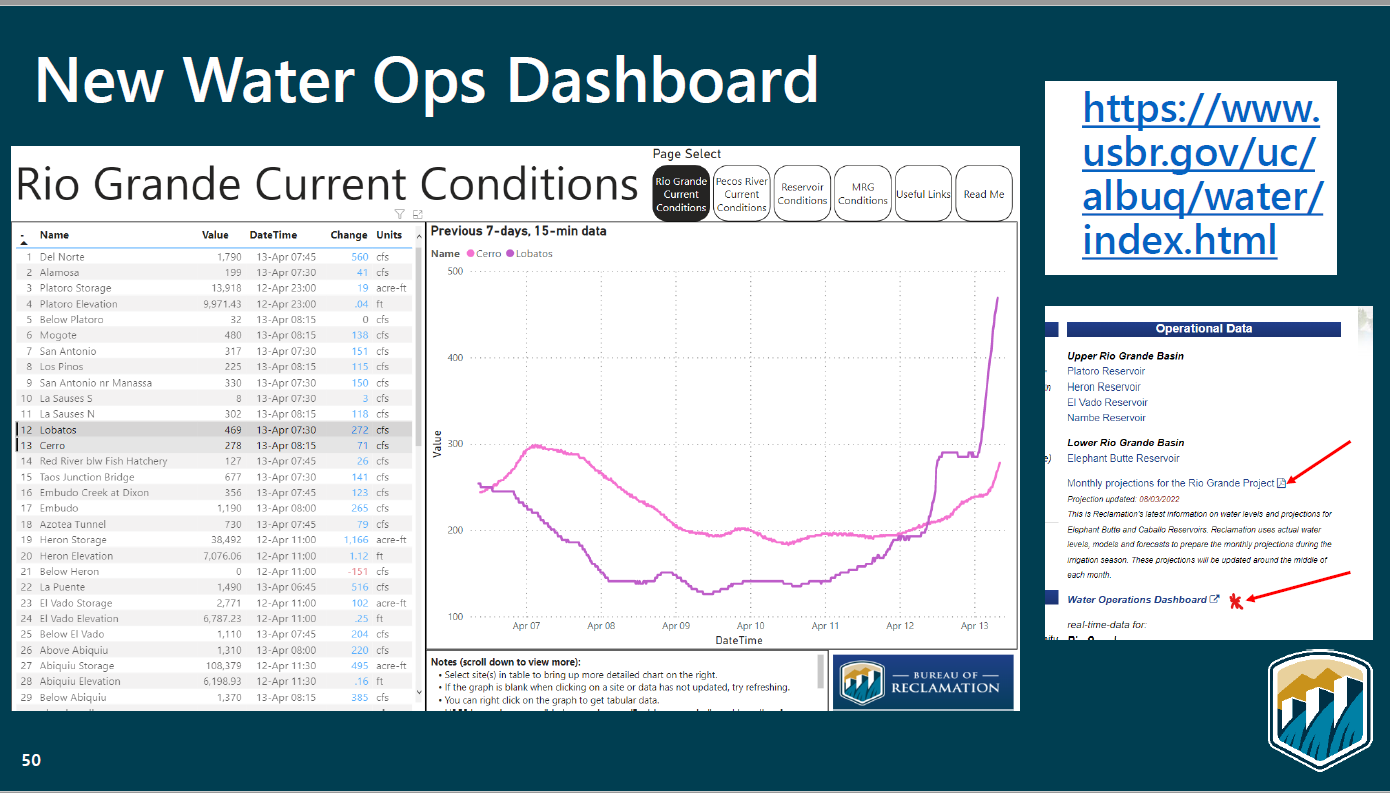
| The last slide that I am showing and it shows the link to more information. The slide below includes a link to the full presentation from which I selected a subset of slides to present in this article. |
–
From a Different Source (USBR.gov) and Covering a Larger Area and with some more recent data:

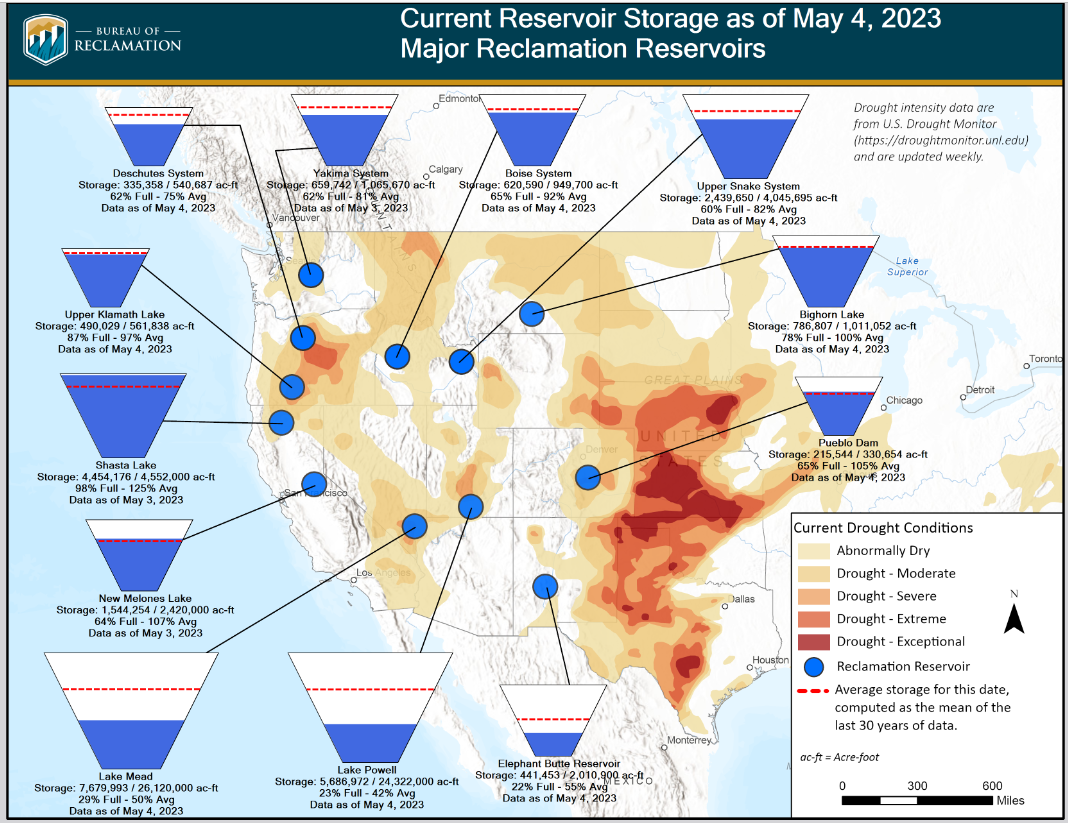
Click HERE to update this image.
–
| Many reservoirs are back to their average. Others are still below average but much above the desperate levels of last year. |
–
Explanation of Abbreviations

–
| I hope you found this article interesting and useful. |
–