At the end of every month, NOAA updates its Outlook for the following month which in this case is May of 2023. We are reporting on that tonight.
There have been some significant changes in the Outlook for May and these are addressed in the NOAA Discussion so it is well worth reading. We highlighted some of the important changes within the NOAA Discussion. We also provided the prior Mid-Month Outlook for May for comparison. From the NOAA Discussion:
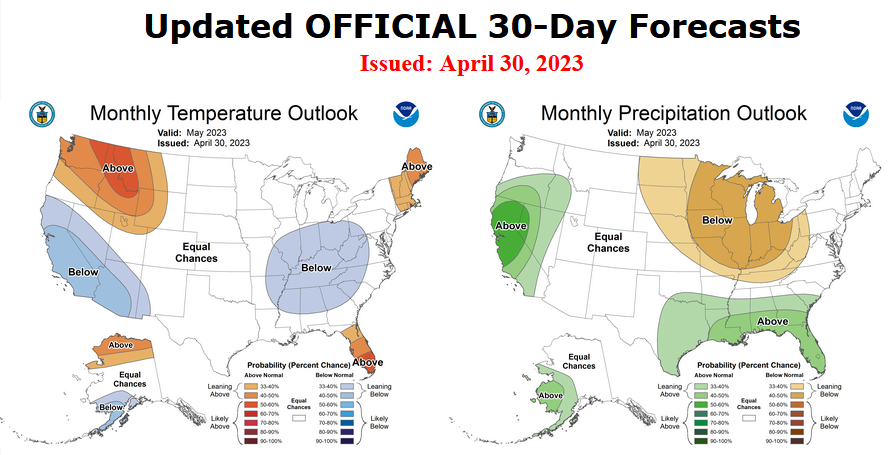
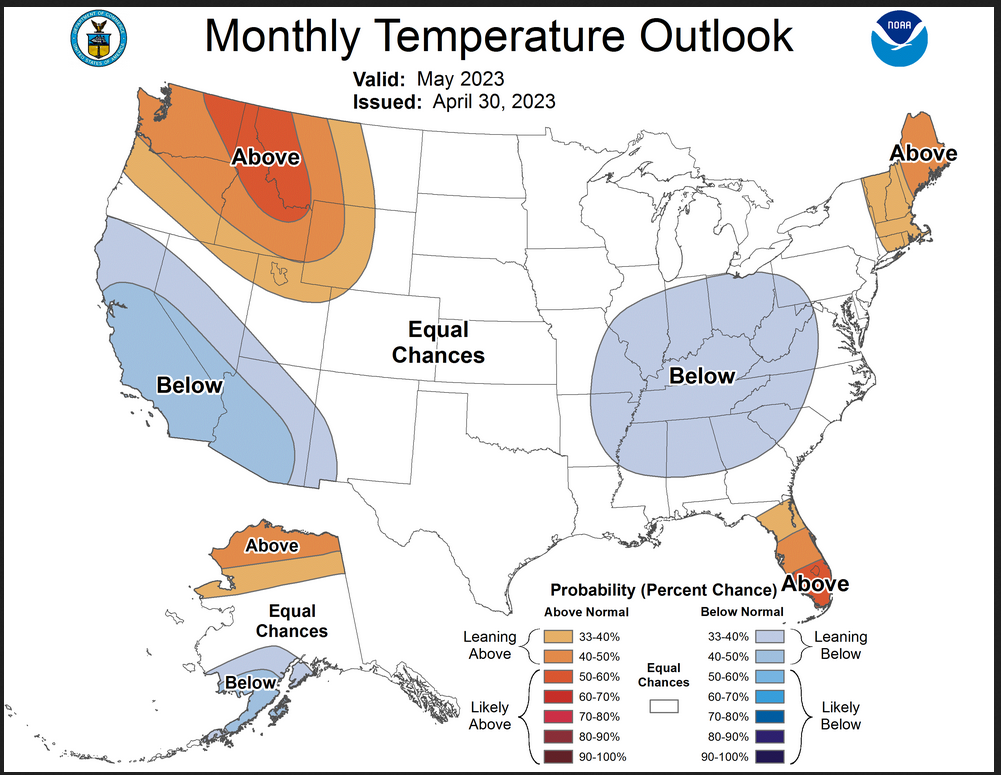
- A weak tilt toward below normal temperatures is indicated over the interior eastern CONUS beneath the persistent early-May trough
- Enhanced probabilities of above normal temperatures remain over New England and Florida
- The area of above normal [temperature] probabilities over the Pacific Northwest is expanded into the western Northern Plains
- The region of below normal [temperature] probabilities is maintained and expanded over the West Coast into the Southwest
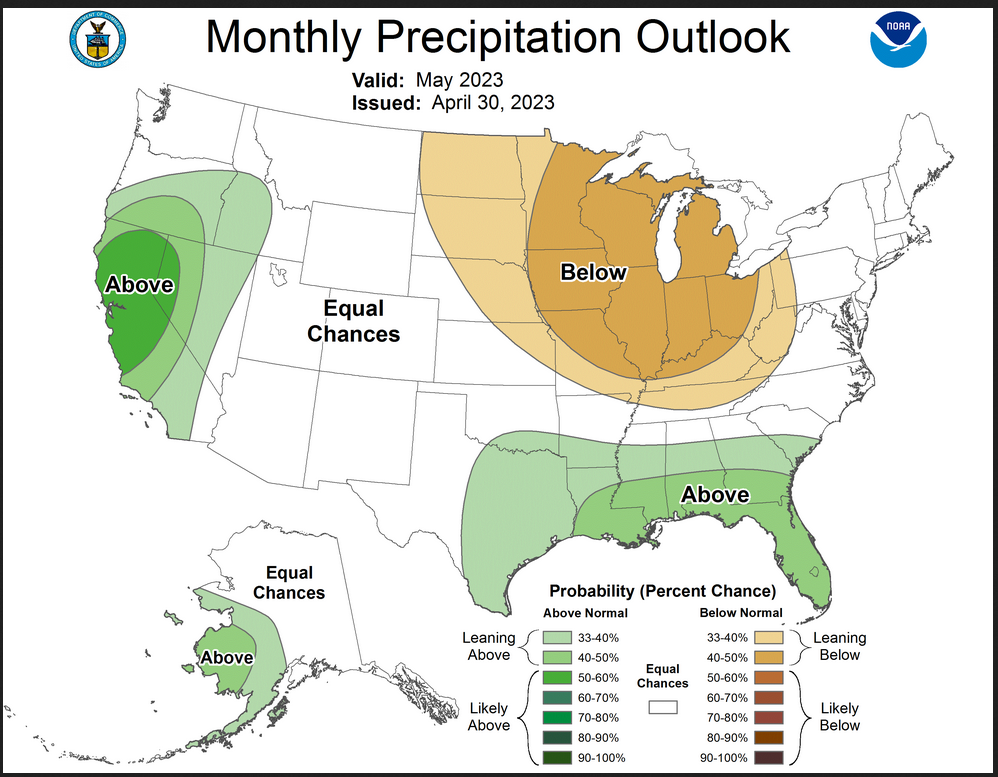
- Enhanced probabilities of below normal precipitation over the Great Lakes are expanded into the Upper and Middle Mississippi, Ohio, and Tennessee Valley regions
- The tilt towards above normal precipitation is maintained over the Gulf States and expanded into parts of eastern Texas
- A tilt toward above normal precipitation is now indicated over the western CONUS
The article includes the Drought Outlook for May. We have also included the current fire incidents (starting to increase) and four months of Wildland Fire Potential Outlooks and also a map showing the current snowpack in the West and the streamflow forecast. We also provide the Week 2/3 Tropical Outlook for the World. We also provide an interesting Podcast that reviews the Winter and looks ahead to the Spring.
| Our regular Daily Weather article can be found HERE. In addition to the short-term forecast it also provides the 6 – 10 day, 8 – 14 day and Week 3 – 4 Outlooks. That is not a full month but close to it. So it is helpful if one wants to understand how the full-month forecast is expected to vary through the month. And the maps in the Daily article update throughout the month. |
Here is the updated Outlook for May, 2023
For Comparison Purposes, Here is the Mid-Month Outlook for April
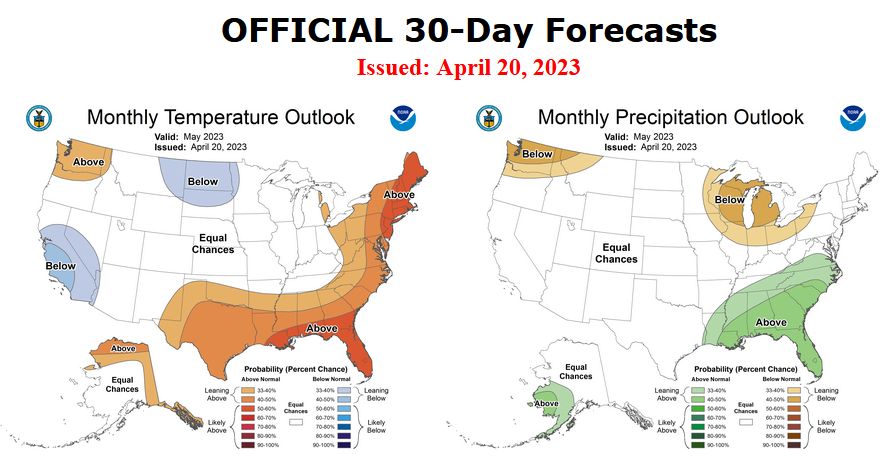
| There has been a fairly substantial change. Remember, it is the top set of maps that are the current outlook for May. |
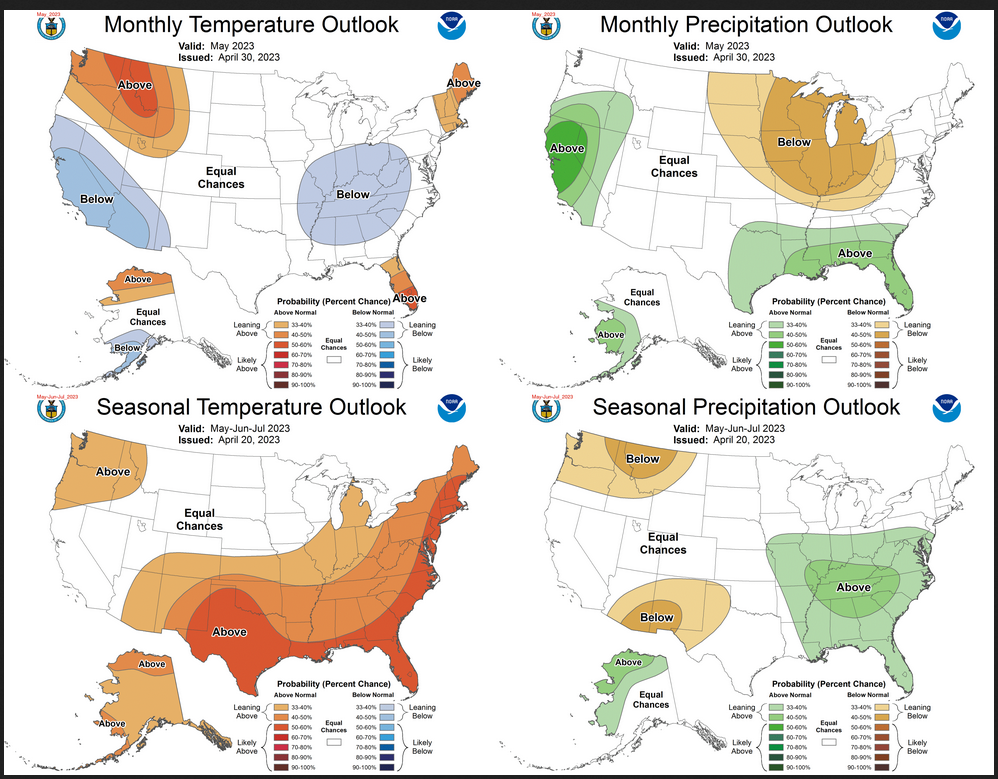
Combination of the Updated Outlook for May and the Three-Month Outlook
ANALYSIS
| For both temperature and precipitation, if you assume the colors in the maps are assigned correctly, it is a simple algebra equation to solve the month two/three anomaly probability for a given location = (3XThree-Month Probability – Month One Probability)/2*. So you can derive the month two/three outlook this way. You can do that calculation easily for where you live or for the entire map. |
It is important to remember that the Outlook for next month was updated on the last day of the current month and the three-month Outlook was issued on the third Thursday. So the period of time between the Mid-Month and End of Month Update varies from month to month from 10 days to 16 days. So there sometimes is a substantial change in the Next Month’s Outlook from the Mid-Month prediction. In such cases, we wonder if a change in the one-month outlook suggests that the three-month outlook would need to also be adjusted. I think that in this case, the answer is that it might be wise to review that but it will not happen until the third Thursday in the coming month. We will get a hint of that a week earlier when the ENSO Update is issued on the Second Thursday of this coming month which is not far from now.
Here are larger versions of the Temperature and Precipitation Outlook maps
NOAA (Really the National Weather Service Climate Prediction Division CPC) Discussion (I have shown certain important points in bold type. My comments if any are in brackets [ ])
30-DAY OUTLOOK DISCUSSION FOR MAY 2023
The May 2023 Temperature and Precipitation Outlooks are updated considering current Weather Prediction Center (WPC) Outlooks for week 1, Climate Prediction Center (CPC) Extended Range and Subseasonal Outlooks, dynamical model guidance for week 2 and weeks 3-4, current soil moisture conditions, background climate states, and recent Climate Forecast System version 2 (CFSv2) monthly forecasts of temperature and precipitation. Sea surface temperature (SST) anomalies are near-to-above average across most of the Pacific Ocean and recent weekly SST departures in the NINO1+2 region reached 2.5 degrees Celsius above normal. El Niño Southern Oscillation (ENSO) neutral conditions are observed in the Equatorial Pacific, and as such, ENSO did not play a significant role in the updated May 2023 Outlooks. Well organized Madden Julian Oscillation (MJO) activity has continued during the latter parts of April and recent forecasts of the Realtime Multivariate MJO (RMM) index indicate potential continuation through at least mid-May. As the atmospheric response to the La Nina continues to wane, MJO is expected to be the dominant driver of tropical convective anomalies, however, extratropical linkages become less clear during boreal spring. Though the extratropical influence from the MJO may be weak during spring, it is considered in the updated Outlooks.
A largely persistent pattern is forecast in the 6-10 and 8-14 day periods (early May) depicting troughing over the West Coast, ridging over the Rockies, and troughing over the East Coast. The troughing over the East Coast is forecast to progress over the North Atlantic by mid-May, while the trough over the West Coast has been and is expected to remain more stationary. Given the persistent early May pattern, the updated May 2023 Temperature Outlook has a few changes from the Mid-Month Outlook, particularly over the eastern contiguous United States (CONUS) where troughing is expected to lead to cooler temperatures to start the month.
A weak tilt toward below normal temperatures is indicated over the interior eastern CONUS beneath the persistent early-May trough, and where equal-chances (EC) of above and below normal temperatures were indicated in the prior May 2023 Temperature Outlook. Though we expect cooler temperatures in early May, the expected influence from continued MJO activity is above normal temperatures over the central and eastern CONUS, and longer lead forecasts (Week 3-4) tilt weakly warm as the troughing progresses over the North Atlantic. As such, probabilities are low for below normal temperatures. The region of above normal temperatures along the east coast in the initial May 2023 Outlook is significantly smaller, and EC is indicated along the coast considering the strong model agreement from earlier North American Multi-Model Ensemble (NMME) and Copernicus model suite (C3S) guidance on above normal probabilities, both of which are at odds with updated guidance favoring a cooler start to May. More recent forecasts show conflicting signals over TX where probabilities of above normal temperatures were originally indicated, with some short term and Week 3-4 guidance favoring above normal temperatures, and CFSv2 monthly forecasts favoring below normal temperatures. As such, EC is favored over Texas. Enhanced probabilities of above normal temperatures remain over New England and Florida where dynamical models consistently forecast above normal temperatures throughout May. The area of above normal probabilities over the Pacific Northwest is expanded into the western Northern Plains given the persistent ridging and consistent model forecasts. The region of below normal probabilities is maintained and expanded over the West Coast into the Southwest under and ahead of persistent troughing and given earlier model solutions which favored cooler temperatures over parts of the West Coast. EC is now favored over the eastern Northern Plains and Upper Mississippi Valley where CFSv2 indicates EC, and other model solutions show weak or conflicting forecasts throughout the month. Probabilities of above normal temperatures are maintained over the North Slope of Alaska, and a small area of below normal probabilities is introduced over the south coast given the transition to troughing over the western CONUS and cooler SST anomalies off the west coast of Alaska.
Enhanced probabilities of below normal precipitation over the Great Lakes in the mid-month Outlook are expanded into the Upper and Middle Mississippi, Ohio, and Tennessee Valley regions in the updated Precipitation Outlook, ahead of the anticipated early May central CONUS ridging. The tilt towards above normal precipitation is maintained over the Gulf States and expanded into parts of eastern Texas given recent monthly CFSv2 forecasts and short term forecasts that favor above normal precipitation in the region; however, most models show a sharp transition from below normal to above normal precipitation over the Gulf States. Given West Coast troughing, a tilt toward above normal precipitation is now indicated over the western CONUS, with probabilities reaching 50 to 60 percent where dynamical models agree and probabilities are strongest. The area of below normal precipitation is removed over the Pacific Northwest consistent with updated model forecasts and EC of above and below normal precipitation is now indicated. Probabilities for above normal precipitation remain confident in models over western Alaska.
Drought Outlook
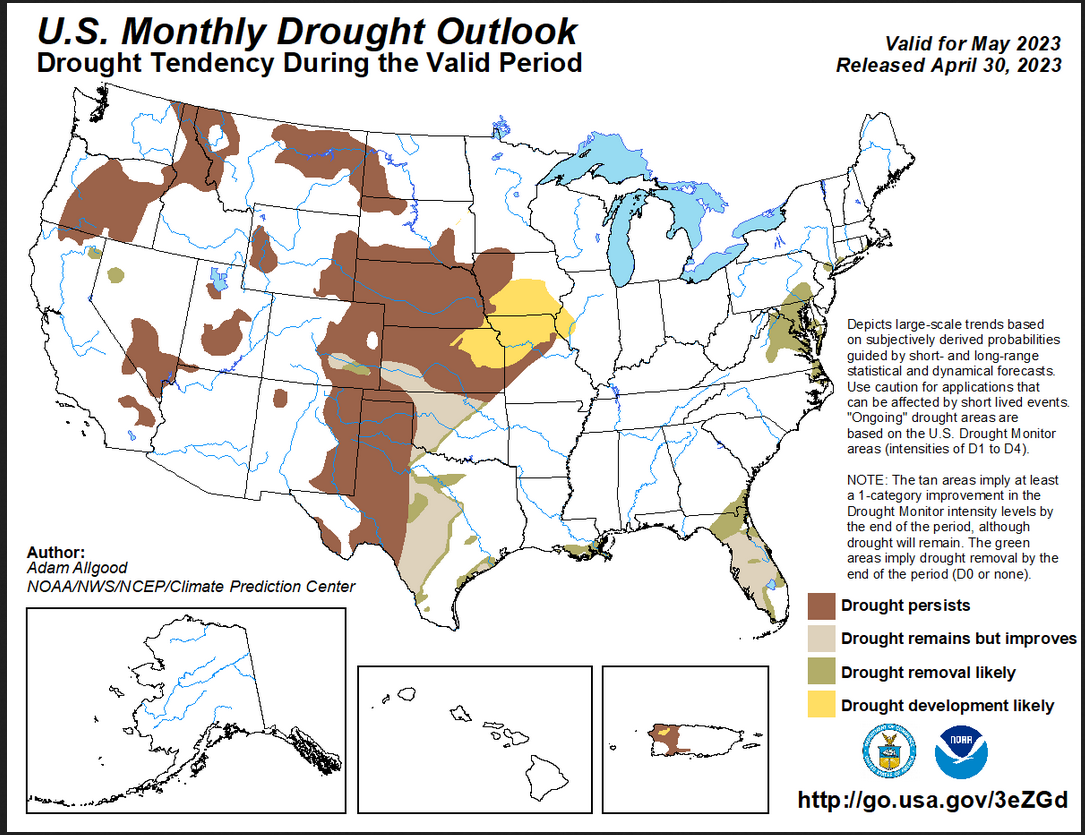
Here is the newly issued Drought Outlook for next month.
–
| You can see where drought development or reduction is likely. There is a significant reduction in the area that is forecast to be in drought. The summary and detailed discussions that accompany this graphic can be accessed HERE |
Here is the short version of the drought summary
Latest Monthly Assessment – During the past month, snowmelt and a continued wet pattern across much of the West led to further drought reduction, with less than 8 percent of California now in drought after nearly the entire state was experiencing drought at the start of the year. Across the Northern Plains, a rapid melting of a deep snowpack eased drought conditions while causing widespread flooding of rivers and streams. Further south across the central Plains, extreme to exceptional drought persisted under mostly dry conditions, and drought slowly expanded across portions of the western Corn Belt. A marked increase in convection eased drought across southern and eastern Texas and parts of Florida, while abnormal dryness coupled with an early green-up promoted some drought development across the mid-Atlantic and Northeast.
The initial conditions for the May 2023 drought outlook are based on the U.S. Drought Monitor valid on April 25th. A series of storms in the near term are bringing widespread soaking rains to the mid-Atlantic and Northeast, which should ease drought conditions fairly quickly. Further south, an early jump on widespread convection across Florida should also ease drought. Widespread heavy rainfall fell across portions of the central to southern Plains and Texas subsequent to April 25th, and as this moisture works into the soils and streams, some drought relief is favored. In contrast, drier conditions are favored for portions of the Corn Belt and Great Lakes region during May, which may lead to slow drought expansion across southern Iowa, northern Missouri, and western Illinois. Across the West, undercutting storm systems south of a favored ridge over central Canada are favored to bring late season moisture to the West, including California. This moisture in addition to continued snowmelt may promote some further relief to portions of California and Nevada. Drought relief is less likely across the Desert Southwest until the monsoon season ramps up. Additionally, the anticipated precipitation is unlikely to be sufficient to substantially change the drought conditions across the Northwest, which experienced a below-average winter wet season.
No drought is currently in place or forecast to develop across Alaska and Hawaii. Moderate drought in western Puerto Rico is favored to persist, but uncertainty is too high to indicate any areas of further expansion.
Worldwide Tropical Forecast
 –
–
| To update this forecast (which updates on Tuesdays) click HERE |
Month-to-date Temperature as the current month evolves can be found at https://hprcc.unl.edu/products/maps/acis/MonthTDeptUS.png
Month-to-date Precipitation as the current month evolves can be found at https://hprcc.unl.edu/products/maps/acis/MonthPNormUS.png
CLIMAS Podcast
You can access the podcast HERE or just click on the graphic above. In both cases, you will have to click on the start arrow to have the podcast begin.
Water-Year to Date SWE and Stream Flow
Water year-to-date SWE can be found by clicking HERE I provided a map that was current as of the day before this article was published.
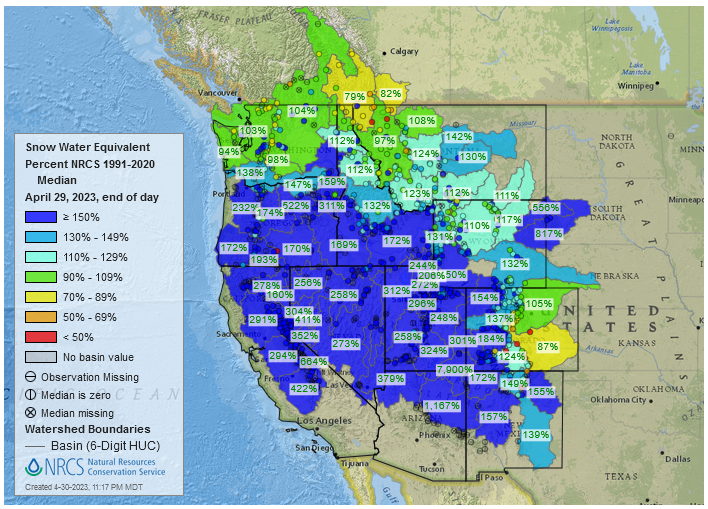
| This map shows a good situation. Most basins are way above to slightly above the median with just a few below. |
I am showing the stream flow. But I was only able to generate the April 1 graphic tonight. I have seen more up to date maps for part of the West so others can do things I can not do. But I think I will be able to replace the below with a more up-to-date map very soon. It is the same link as for the current snowpack with a different choice of the desired graphic.
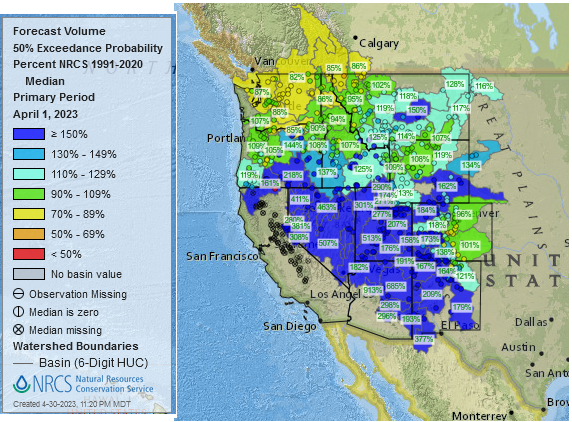
| In almost all cases the projected streamflow above normal and in many cases it is substantially above normal. What is shown is the 50% probability of streamflow exceeding the level shown. So there is a distribution of higher and lower levels. |
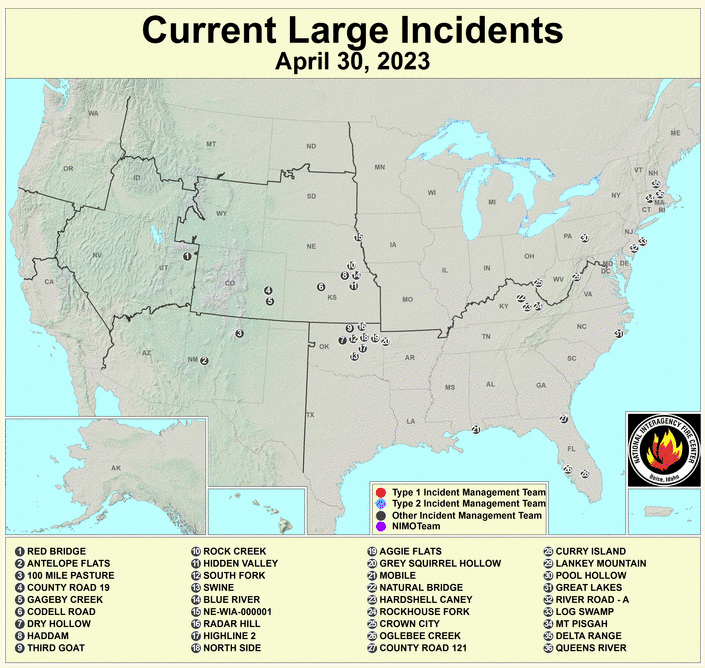
Fire Outlook: Current and Forecast
Updates to the major fire situation can be found by clicking here https://fsapps.n wcggov/afm/index.php
| The number of wildfires has continued to increase. |
Now looking at the wildland fire potential Outlooks. (Normally these maps will update in the afternoon of the first day of the month).
Since they are set to auto-update, if you look at a prior version of this article, these four maps will not be the original maps but the updated maps.
May Wildfire Risks
June Wildfire Risks 
July Wildfire Risks
August Wildfire Risks
If you read this article a month from now and if the maps did not auto-update, you can update these graphics by clicking here https://www.ni fc.gov
| I hope you found this article interesting and useful |