Some additional light editing at 5:03 p.m EDT Sunday April 23, 2023 to explain a difference in the way the two agencies present information.
The JAMSTEC forecast is of interest partly because both Japan and the US. have weather that is mostly based on the Pacific Ocean.


We start with a short summary of the NOAA Four-Season Outlook. |
On the third Thursday of the month right on schedule NOAA issued what I describe as their Four-Season Outlook. The information released also included the Mid-Month Outlook for the single month of May plus the weather and drought outlook for the next three months. I present the information issued and try to add context to it. It is quite a challenge for NOAA to address the subsequent month, the subsequent three-month period as well as successive three-month periods for a year or a bit more.
It is very useful to read the excellent discussion that NOAA issues with this Seasonal Outlook. It is best to read the full discussion but here are some of the highlights:
- ENSO-neutral conditions are expected to continue through the Northern Hemisphere spring, followed by a 62% chance of El Niño developing during May-July 2023. An El Niño Watch has been issued, and the range of possibilities toward the end of the year includes a strong El Niño (4 in 10 chance of Niño-3.4 ≥ 1.5°C) to no El Niño (1 in 10 chance)
- The combination of elevated snowpack and high soil moisture across much of the West coupled with below normal SSTs currently observed in the Gulf of California and the Pacific off the west Coast of the Baja California Peninsula would favor a slower evolution of monsoonal circulation.
- El Niño is expected to become more of a factor and the pattern begins to increasingly reflect El Niño conditions during the cold months. As a result, enhanced probabilities of above normal temperatures indicated for the Southern CONUS late summer/early fall are reduced by the winter. Conversely, chances of above normal temperatures increase across the Northern Tier by the winter months.
- As we enter the fall and winter months, the pattern begins to increasingly reflect an El Niño signature. Increased probabilities for above normal precipitation depicted across the Ohio and Mississippi Valleys during late summer and early fall transitions to the East and Gulf Coasts during the winter months, consistent with El Niño. Conversely, an increasingly dry signal is evident across the northwestern CONUS by the winter with probabilities of below normal precipitation exceeding 40 percent across the Pacific Northwest from November-December-January (NDJ) 2023-24 through JFM 2024. A tilt toward below normal precipitation is also indicated for the Great Lakes Region westward toward the Northern Plains during the cold months, consistent with El Niño.
Let’s Take a Look at the Mid-Month Outlook for May. There will be an End of Month Update.
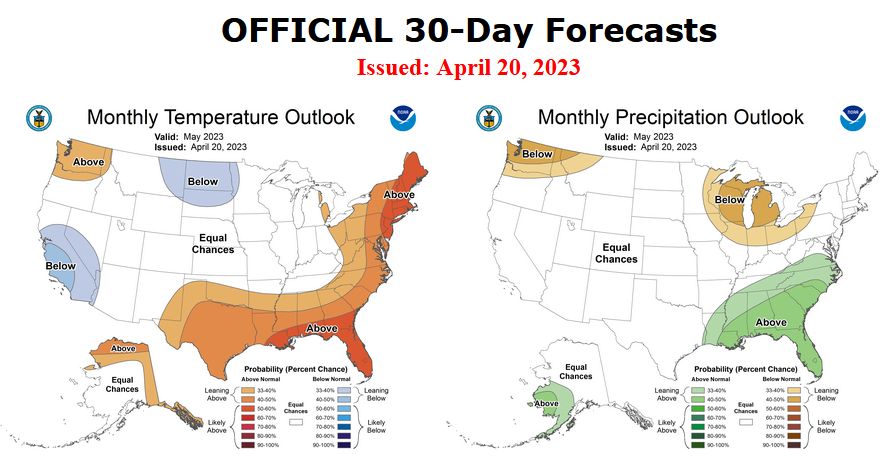
Combination Mid-Month Outlook for May and the Three-Month Outlook
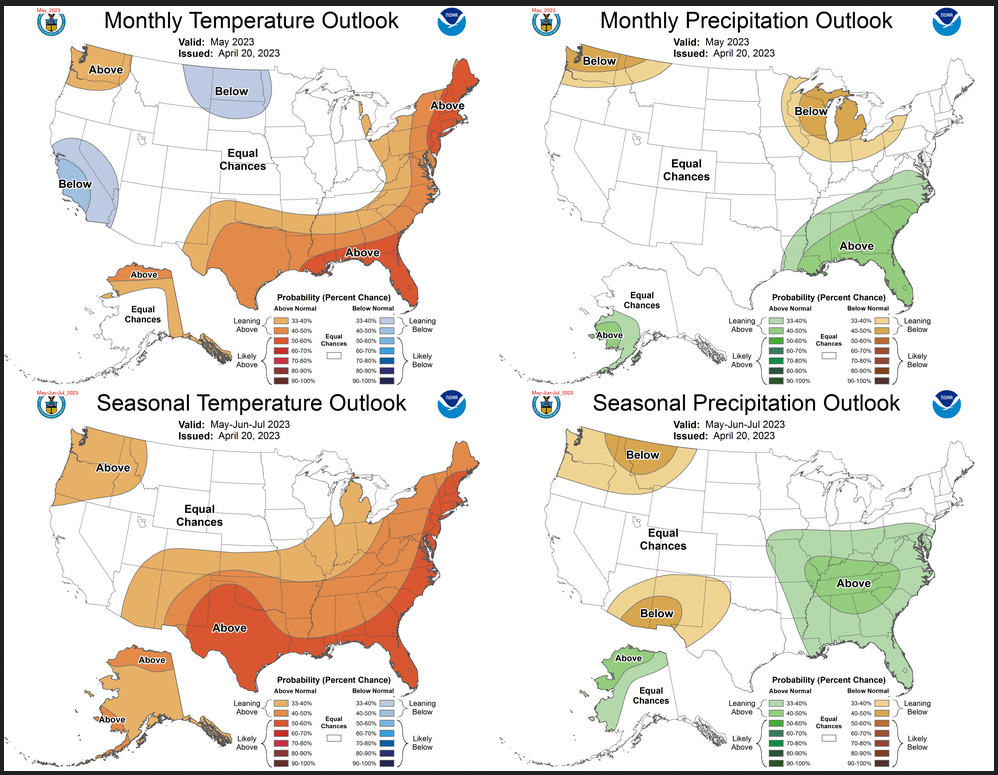
The top row is what is now called the Mid-Month Outlook for May which will be updated at the end of April. There is a temperature map and a precipitation map. The second row is a three-month outlook that includes May. I think the outlook maps are self-explanatory. What is important to remember is that they show deviations from the current definition of normal which is the period 1991 through 2020. So this is not a forecast of the absolute value of temperature or precipitation but the change from what is defined as normal or to use the technical term “climatology”.
| The full NOAA Four-Season Outlook can be accessed HERE |
–
Now we provide the JAMSTEC FORECAST. They work with meteorological seasons. This means that sometimes it is a three-season forecast and sometimes it is a two-season plus one or two months forecast. You see that in this article because it shows maps for MJJ and JJA. They only differ by one month. Also, I should mention that NOAA forecasts probabilities of deviating from Normal (climatology) and JAMSTEC attempts to forecast the magnitude of the deviation. It pays to read the legend of all graphics carefully. But I am not sure this difference makes a real difference since more certainty is usually associated with thinking the deviation will be larger but not always. Some differences in how information is presented are not very meaningful when compared with the overall level of uncertainty in all weather forecasts. |
–
JAMSTEC
The Japan Agency for Marine-Earth Science and Technology, or JAMSTEC, is a Japanese national research institute for marine-earth science and technology
From the JAMSTEC Discussion:
Observation shows that the La Niña decayed and a La Niña Modoki-like state has appeared. The SINTEX-F ensemble mean predicts that an El Niño will occur in May. However, there is a large uncertainty in the predictions of the amplitude, and the ensemble mean of the SINTEX-F2-3DVAR version predicts a relatively weak El Niño.
Although it is a World forecast, it includes a forecast for North America since North America is part of the World.
First, we take a look at the forecasted sea surface temperature anomalies (SSTA). JAMSTEC starts by forecasting the SSTA and Nino 3.4 Index on the first day of the month and from there it takes their models about two weeks to produce their seasonal forecast. I received it from JAMSTEC on April 11, 2023.
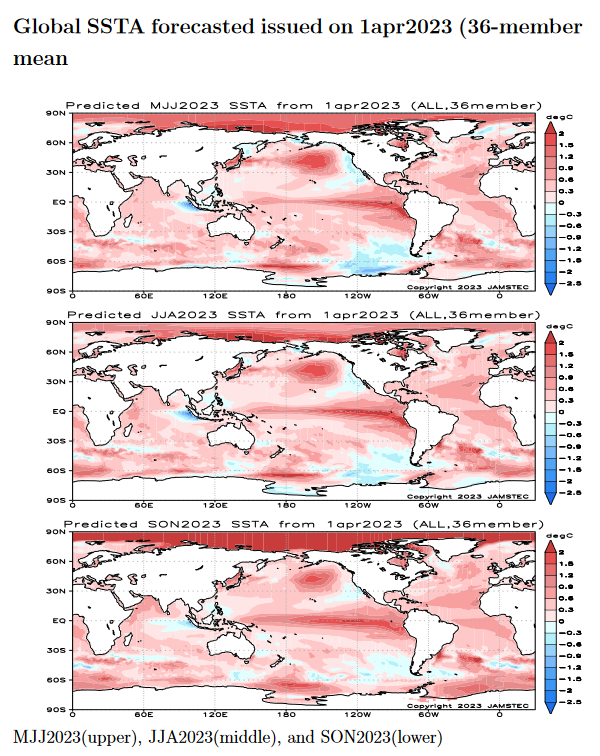
| This shows their forecast of sea surface temperature anomalies at three points in time. Notice the water along the Equator in the Pacific. Blue is cool (as an anomaly) and is associated with La Nina. Red is warm and is associated with El Nino. You can see the El Nino in all three time periods. It seems to be stronger in the 2nd and 3rd time periods. I have similar information from NOAA. I do not include it in the article I write on the NOAA Seasonal Outlook because they do not seem to focus on it. It is hard to find any blue in this set of forecasts. JAMSTEC uses the same definition of Normal (climatology as NOAA). The western extension of the warm anomaly explains the comment in the JAMSTEC commentary. They do a better job at characterizing La Ninas and El Ninos than does NOAA. JAMSTEC provides me with a lot of other information that I do not include in my articles to keep them to a manageable size for readers. |
Then we look at three seasonal forecasts. JAMSTEC works with meteorological seasons and this month it does not line up perfectly. They handle that by showing three maps: April-May-June, then June-July-August, then September-October-November. So the three maps cover an eight-month duration with a slight overlap between the first two maps. This works pretty well.
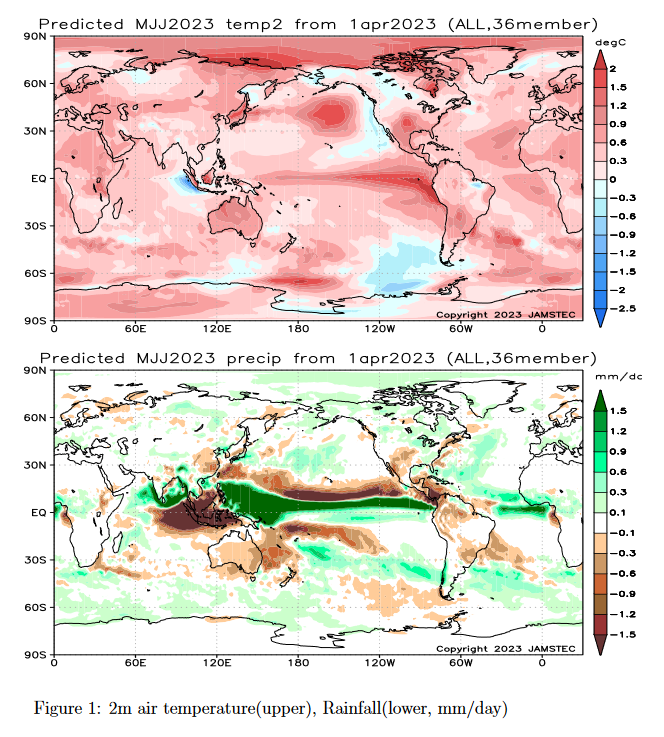
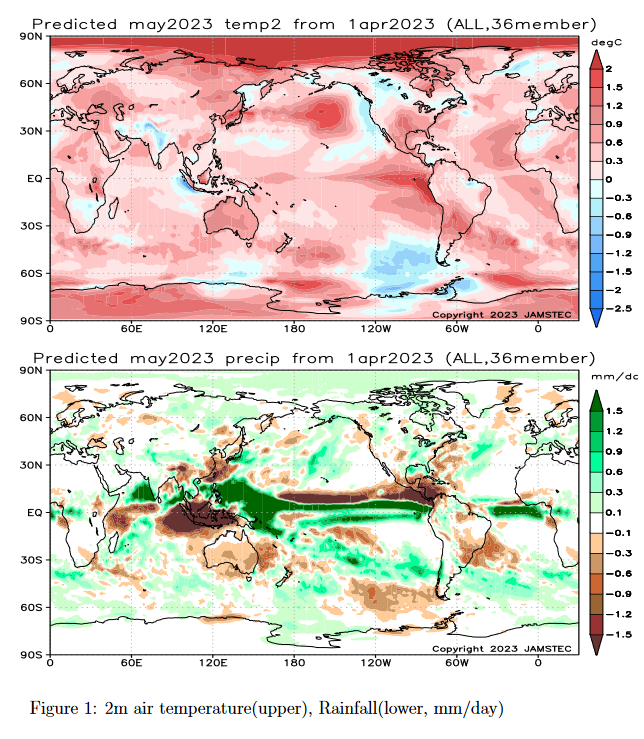
| The top map is the temperature forecast for May/June/July (MJJ) 2023. The bottom map is the corresponding precipitation forecast.
“The SINTEX-F predicts that most parts of the globe will experience a warmer-than-normal condition in May–July average, except for Alaska, western Canada, some parts of Brazil, some parts of South Asia, and some parts of Russia.” “As regards the average rainfall from May through July, a drier-than-normal condition is predicted for the southwestern U.S.A., California, northern Mexico, Central America, the northern part of the South American Continent, La Plata, Australia, some parts of East Africa, Indonesia, the Philippines, Indochina, some parts of India, eastern China, and some parts of Eurasia. In contrast, Alaska, some parts of Canada, and the eastern U.S.A., Venezuela, Chile, central and western Africa, some parts of Indochina, and some parts of Eurasia, will experience a wetter-than-normal condition. In particular, we notice that Indonesia and Australia may experience extremely drier than normal conditions, owing to the combination of the positive Indian Ocean Dipole and the El Niño.” “The model predicts that most of Japan will be hotter and wetter than normal in May–July average (except for Tohoku and Okinawa, which will be warmer and drier than normal).” |
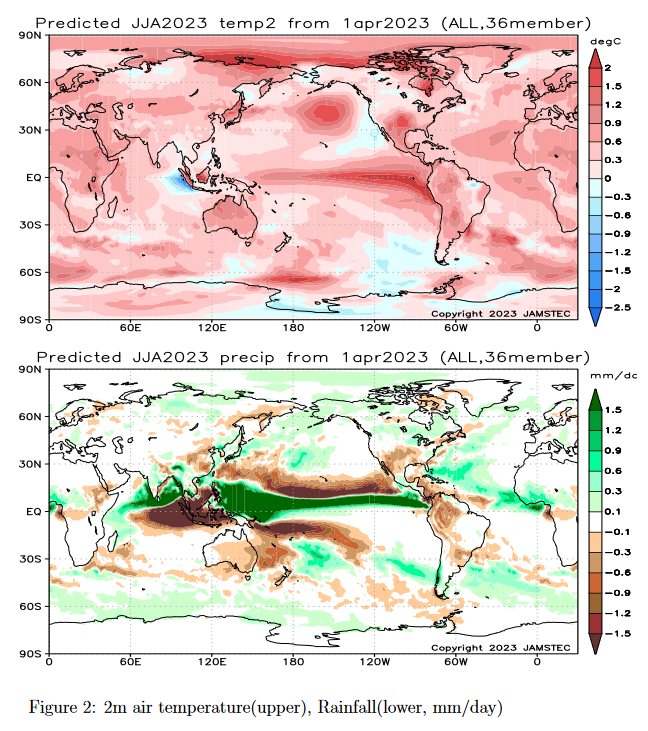
| This covers June/July/August (JJA 2023) which is meteorological Summer. Notice the slight overlap as JAMSTEC prefers to forecast meteorological seasons.
Here is the interpretation from the JAMSTEC Discussion shown below: “In boreal summer (austral winter), the model also predicts that almost all of the globe will experience a warmer-than-normal condition, except for western Alaska, some parts of Canada, some parts of Brazil, some parts of Myanmar, and some parts of Russia. In particular, the southern U.S.A., the western part of the South American Continent, Australia, eastern Africa, and the Arctic region will experience extremely hotter-than-normal conditions.” “In boreal summer (austral winter), the model also predicts the persistence of a similar condition, except for Central America and India. The northern (most of) India will be drier (wetter) than normal condition.” [Editors Note: I assume that has to do with the IOD] “In summer, the model also predicts that most of Japan will be hotter and wetter than normal (except for Okinawa, which will be hotter and drier than normal).” |
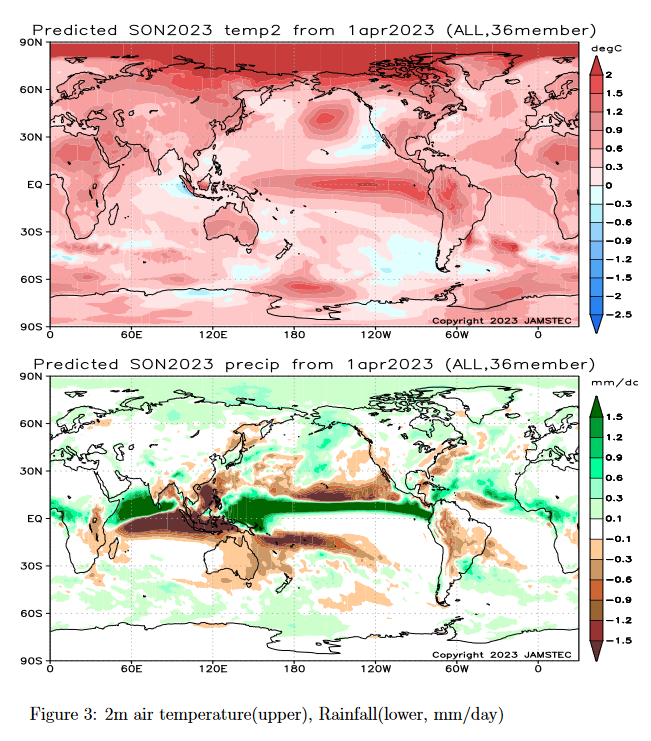
| And above, September/October/November (SON) 2023 which is meteorological Fall. JAMSTEC does not provide its interpretation of its third season but one can observe it on the maps. |
Now I am going to provide their single-month forecasts for May, June, and July.
| The above is the single month of May 2023 |
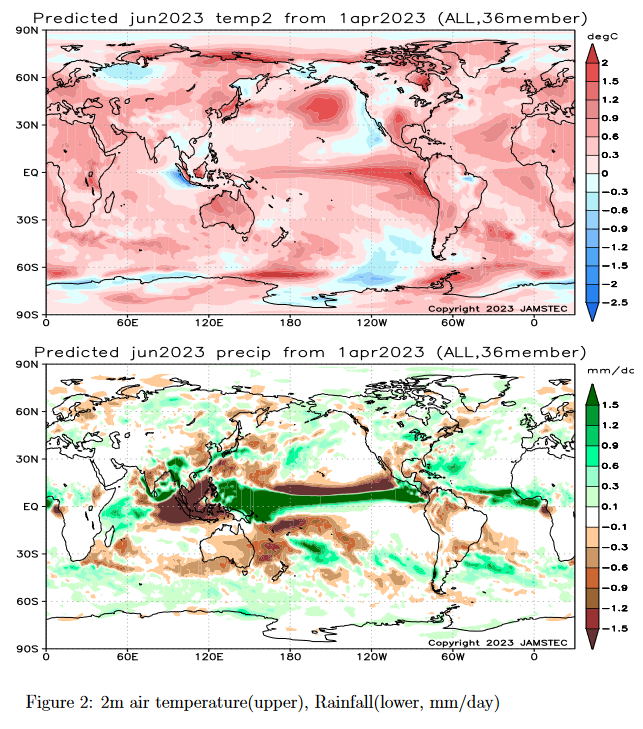
| The above is the single month of June 2023 |
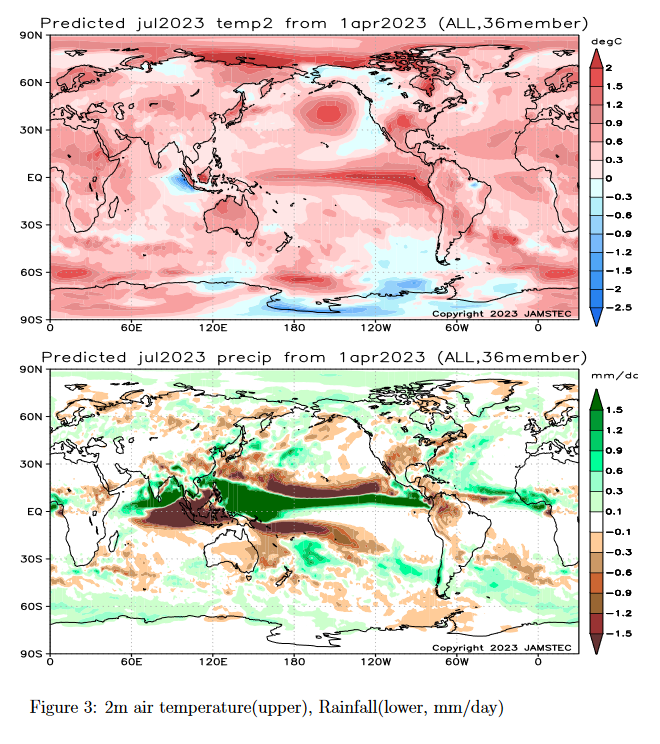
| The above is the single month of July 2023 |
Now we look at the key indices used by JAMSTEC in making their forecast. Perhaps I should have presented these first.
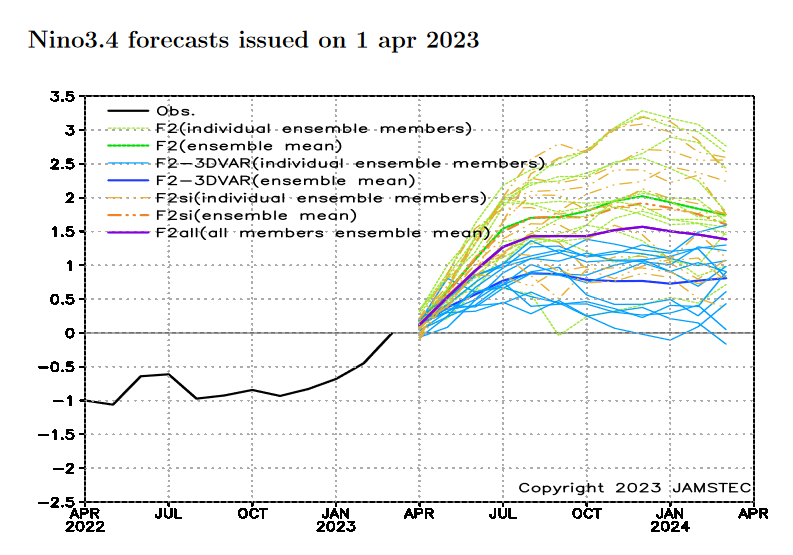
| It goes above +0.5C in May which means El Nino at least from the perspective of Sea Surface Temperature Anomalies. The JAMSTEC discussion now refers to the severity of the El Nino as difficult to predict but probably relatively weak. JAMSTEC now has a number of variations of their models. The blue line seems to be their preferred version. In this graph it shows below 1.0C. We are still impacted by the Spring Prediction Barrier (SPB). HERE is a reference to better understand the SPB. |
And here is the short JAMSTEC Discussion
ENSO forecast:
Observation shows that the La Niña Modoki-like state persists. The SINTEX-F ensemble mean predicts that an El Niño will occur in May. However, there is a large uncertainty in the predictions of the amplitude, and the ensemble mean of the SINTEX-F2-3DVAR version predicts a relatively weak El Niño.
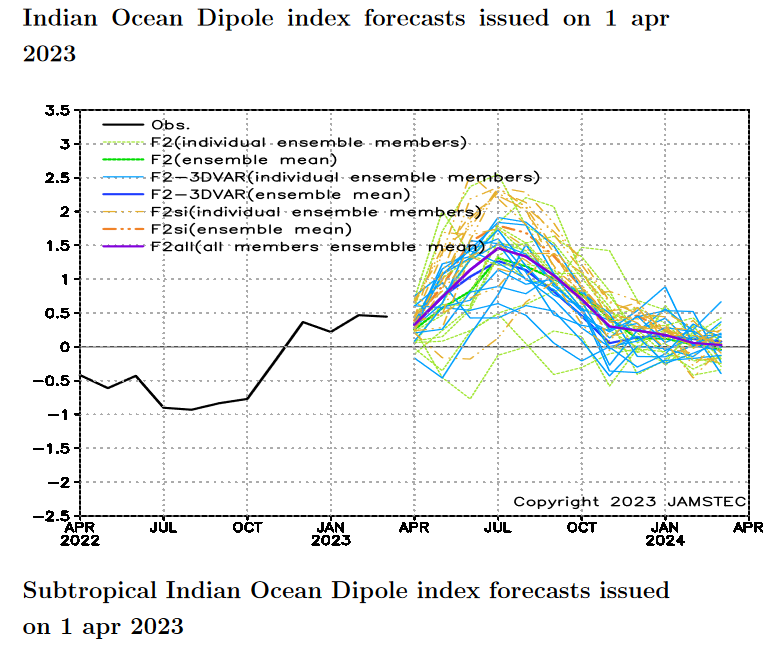
Indian Ocean forecast:
The SINTEX-F ensemble mean predicts that a positive Indian Ocean Dipole event will occur in May. However, there is a large uncertainty in the predictions of the amplitude.
Regional forecast:
The SINTEX-F predicts that most parts of the globe will experience a warmer-than-normal condition in May–July average, except for Alaska, western Canada, some parts of Brazil, some parts of South Asia, and some parts of Russia. In boreal summer (austral winter), the model also predicts that almost all of the globe will experience a warmer-than-normal condition, except for western Alaska, some parts of Canada, some parts of Brazil, some parts of Myanmar, and some parts of Russia. In particular, the southern U.S.A., the western part of the South American Continent, Australia, eastern Africa, and the Arctic region will experience extremely hotter-than-normal conditions.
As regards the average rainfall from May through July, a drier-than-normal condition is predicted for the southwestern U.S.A., California, northern Mexico, Central America, the northern part of the South American Continent, La Plata, Australia, some parts of East Africa, Indonesia, the Philippines, Indochina, some parts of India, eastern China, and some parts of Eurasia. In contrast, Alaska, some parts of Canada, and the eastern U.S.A., Venezuela, Chile, central and western Africa, some parts of Indochina, and some parts of Eurasia, will experience a wetter-than-normal condition. In particular, we notice that Indonesia and Australia may experience extremely drier than normal conditions, owing to the combination of the positive Indian Ocean Dipole and the El Niño. In boreal summer (austral winter), the model also predicts the persistence of a similar condition, except for Central America and India. The northern (most of) India will be a drier (wetter) than normal condition.
The model predicts that most of Japan will be hotter and wetter than normal in May–July average (except for Tohoku and Okinawa, which will be warmer and drier than normal). In summer, the model also predicts that most of Japan will be hotter and wetter than normal (except for Okinawa, which will be hotter and drier than normal).
–
| I hope you found this article interesting and useful |