Updated to include additional information. Final update was at 1:23 a.m. Monday April 17, 2023
The mission of the National Weather Service Colorado Basin River Forecast Center (CBRFC) is to produce river, flood and water supply forecasts for the Colorado Basin and the Great Basin in support of saving lives and property and to enhance the region’s environment and economy.
In this article, I am providing a summary of the situation as of April 1, 2023. But I have provided links to obtain more current information. In a way, the situation is better than it seemed to be on April 1 but flood risk has increased in a few places. I have also included some of the graphics from the April 7, 2023 presentation. So some of the information is a bit more current than the rest of it.
I have also included information on the current reservoir storage levels including a few that are outside of the Colorado River Basin.
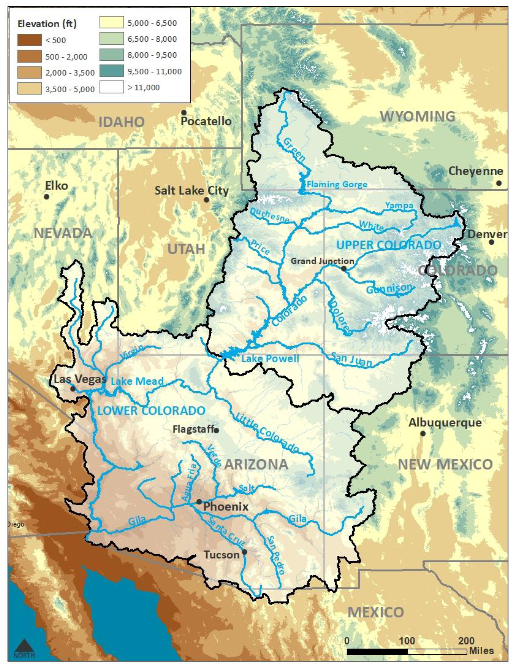
The image below shows the area covered in the CBRFC Report.
–
| Most of the information presented in this article is from a report dated April 1, 2026. HERE is a link to an April 7.2023 presentation. Some of these slides are six days more current. There is a lot more information in that presentation.
On their website (click HERE) there are certain graphics that update daily. I tried to incorporate the later information into this article and I got overwhelmed which is why I did not get this article published sooner. So I decided to publish the April 1, 2023 information. as that provides a good analysis of the situation. The situation is better now than April 1 and you can find the details in the two links I have provided above. I think the weather pattern is changing in a way that the enormous improvement in the water situation in the Colorado River Basin will not improve significantly from this amazingly wet situation as the near-term precipitation forecast is close to normal for this time of the year. In fact, the cool weather could result in a loss of some snowpack to sublimation. We will read about how April worked out in a few weeks. |
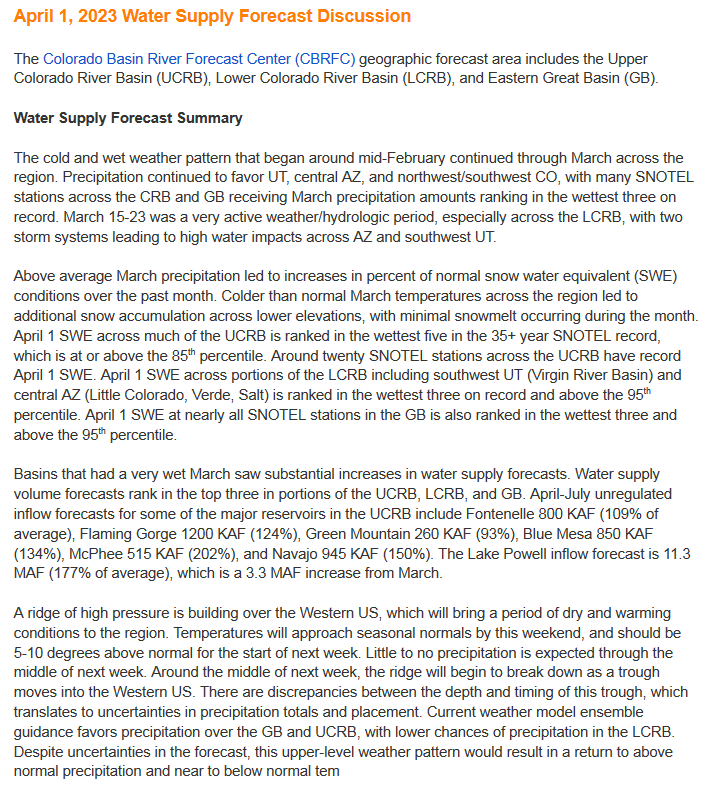
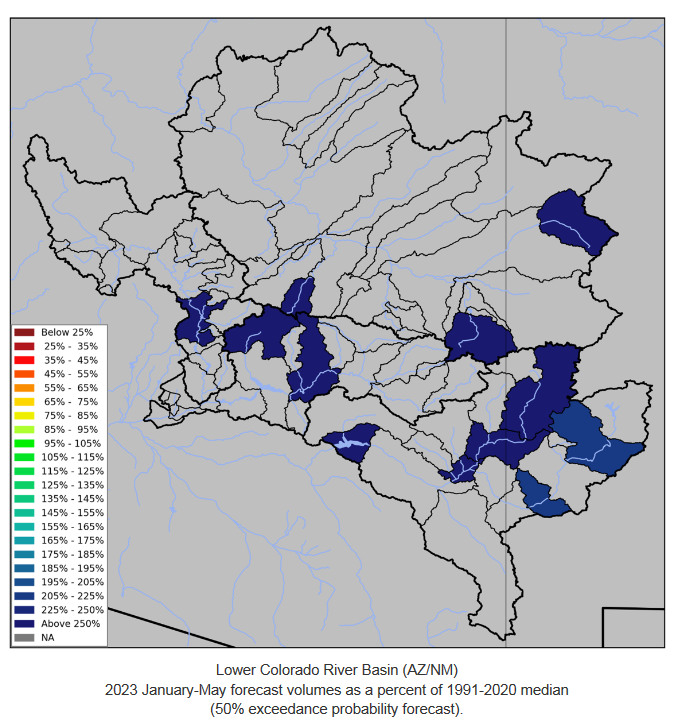
April 1, 2023 Water Supply Forecast Discussion
The Colorado Basin River Forecast Center (CBRFC) geographic forecast area includes the Upper Colorado River Basin (UCRB), Lower Colorado River Basin (LCRB), and Eastern Great Basin (GB).
xx
 Water Supply Discussion
–
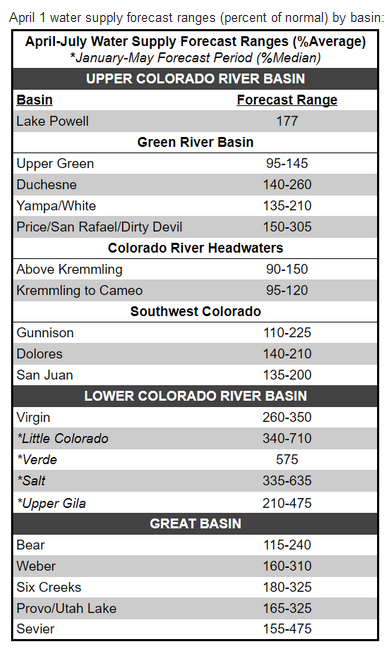
| March was the ideal combination of above-average precipitation and below-average temperatures. Note the southern part of the basin did not share in the above-average precipitation. |
–
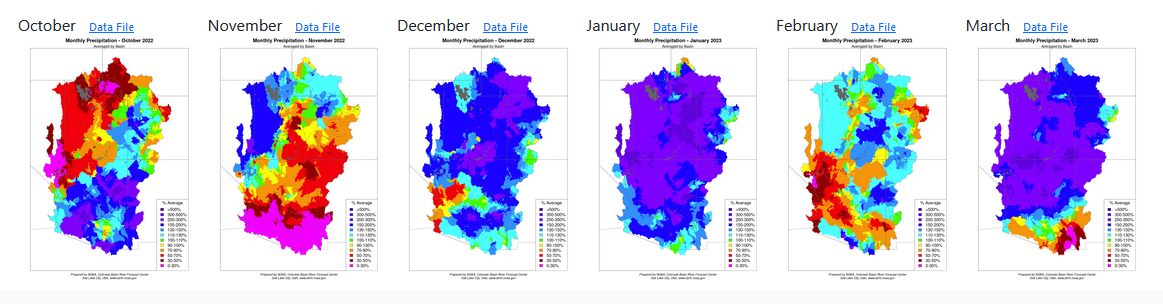
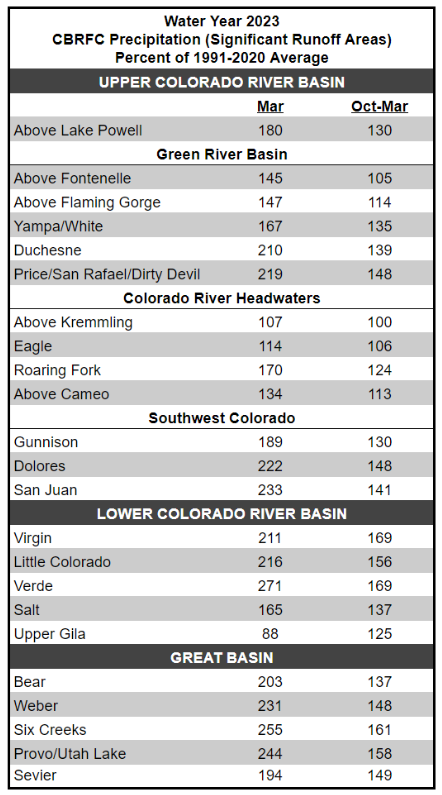
Precipitation History
–
| I thought this was interesting. Not all the months were very wet. But December, January, and March were. April is not shown but continues to be wet |
–
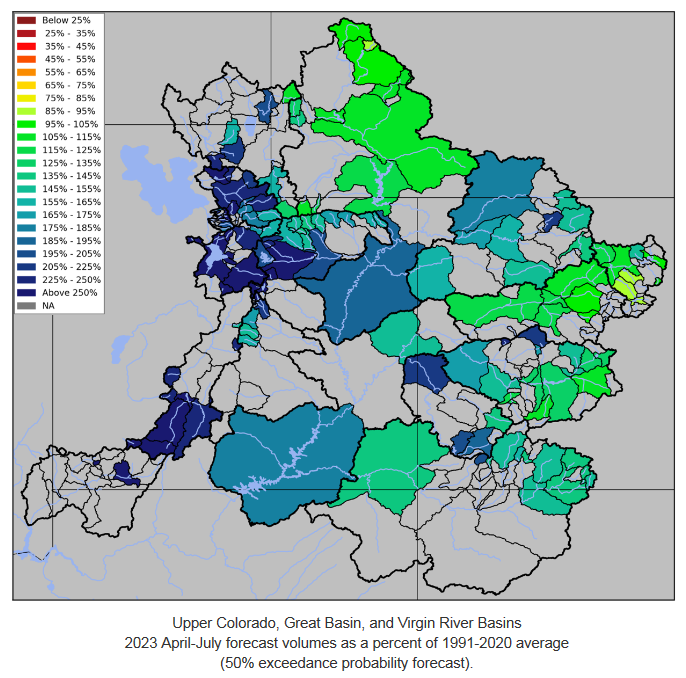
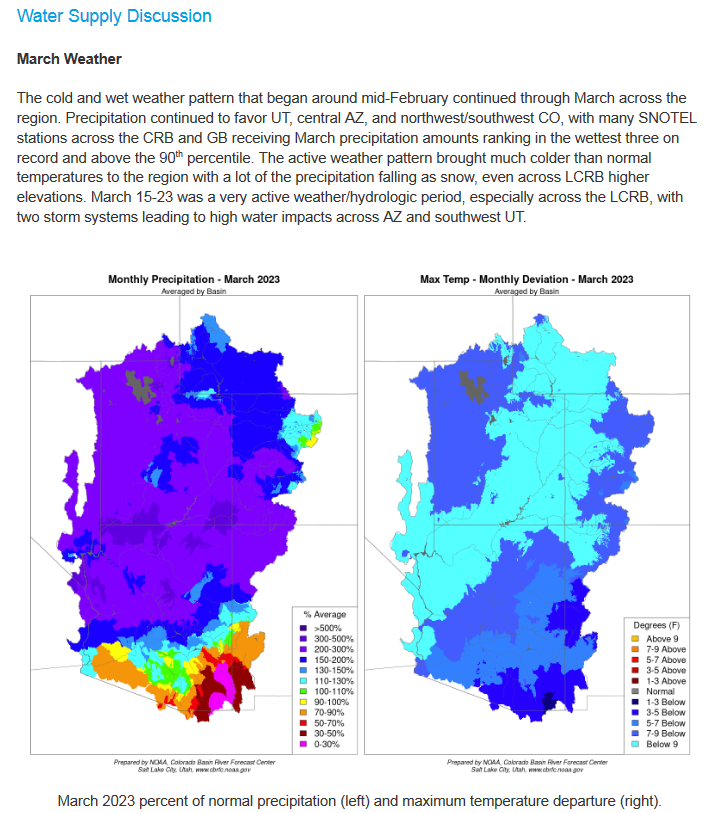
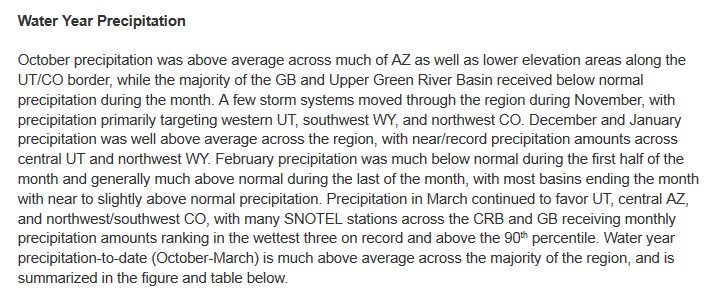
Water Year 2023 Weather/Precipitation
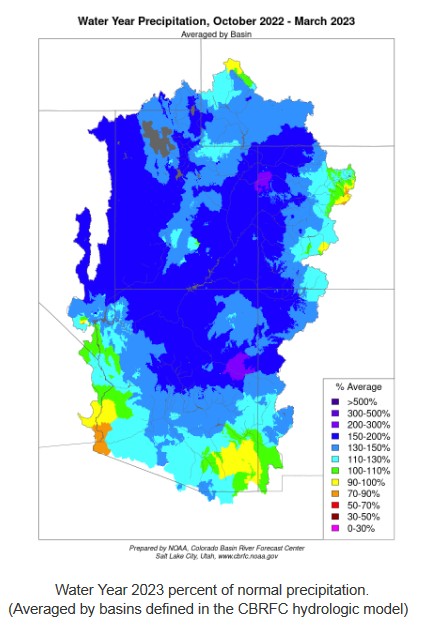
Showing this in map format
–
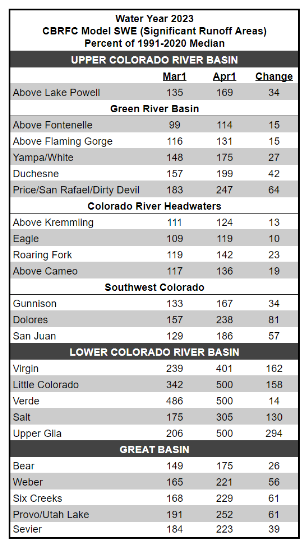
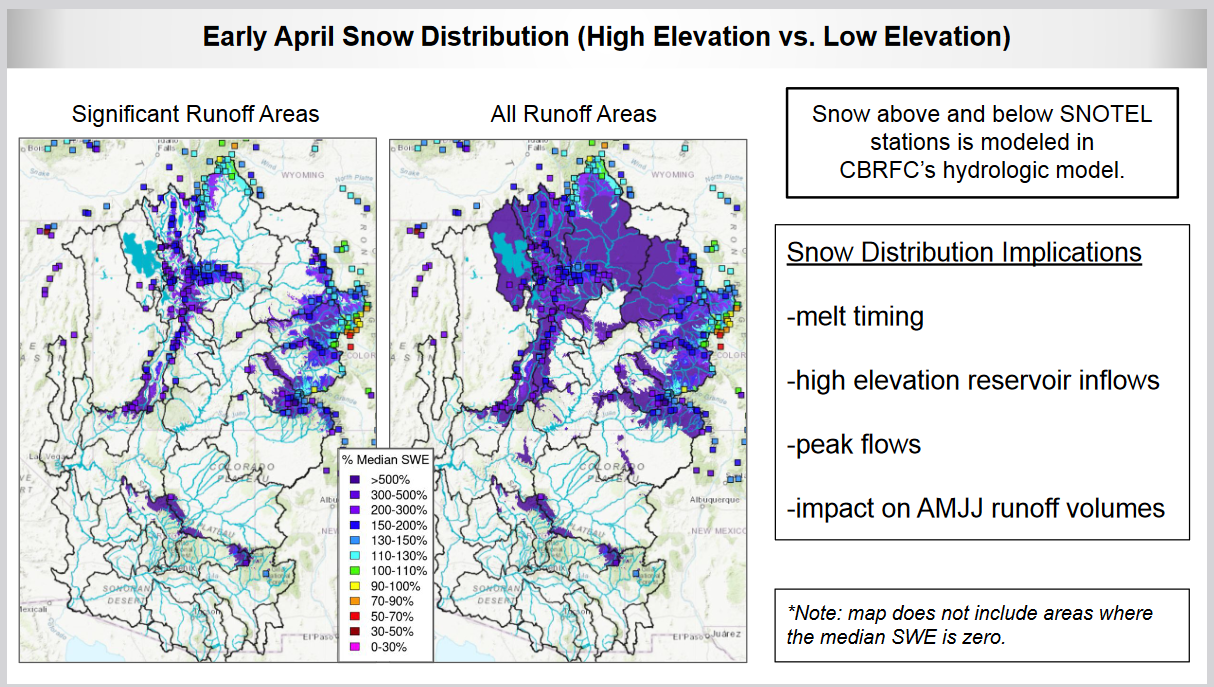
| The legend explains this well. The left-hand map shows the SNOTEL readings. The right-hand map translates to project lower elevation snowpack where there are no measurements. You can also see the flexibility of the computer system as other options are shown for when you are on the CBRFC website. |
–
Runoff Estimates
Example for Lake Powell
–
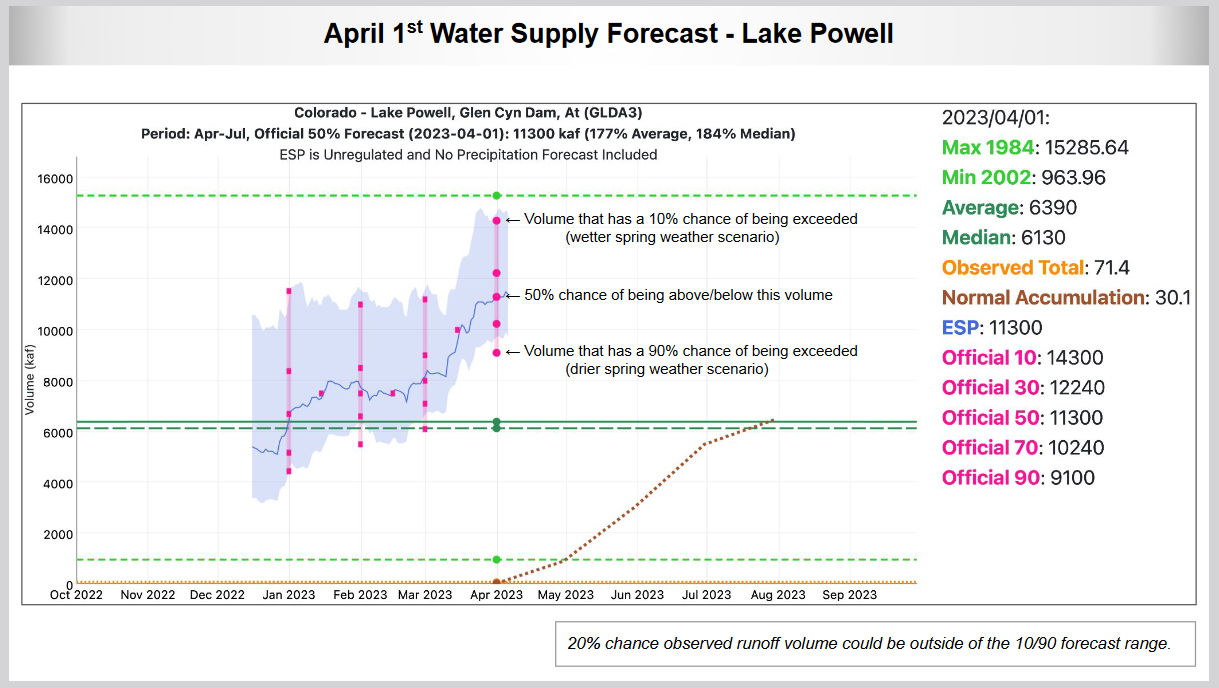
| This is a complicated but very useful graphic. If is available for many locations. You can see that his article would have been unrealistically long if I included everything that was available. On the upper left you see four horizontal lines. These are the standard way to show runoff forecasts. There are five data points on each line. The center point which is the most important shows the value that has a 50% chance of being exceeded (or the actual being less that this estimate). It looks like they actually forecast this daily which is the green line shown. Also shown are the 10%, 30%, 70%, and 90% forecasts. You can read the values off the Y Axis or in the legend on the right. The four horizontal lines are the historical max, min, ave and medial values. The orange line along the bottom is how they see the runoff happening during the Spring Summer run-off period in an average year. You can see that the January forecast was for an average year which was good considering the La Nina forecast. February and March looked a lot better. The March forecast soared. Notice the 90% exceedance forecast is not projected to lead to a record being broken. But for some locations, the 90% forecast would set a record. So all of this is very strange. I have provided the links to certain things but not the recording of the April 7 presentation. I will look for that and add it. The image quality is better in the images I have presented but the voice explanation is missing. |
–
Peak Flow Forecasts
–
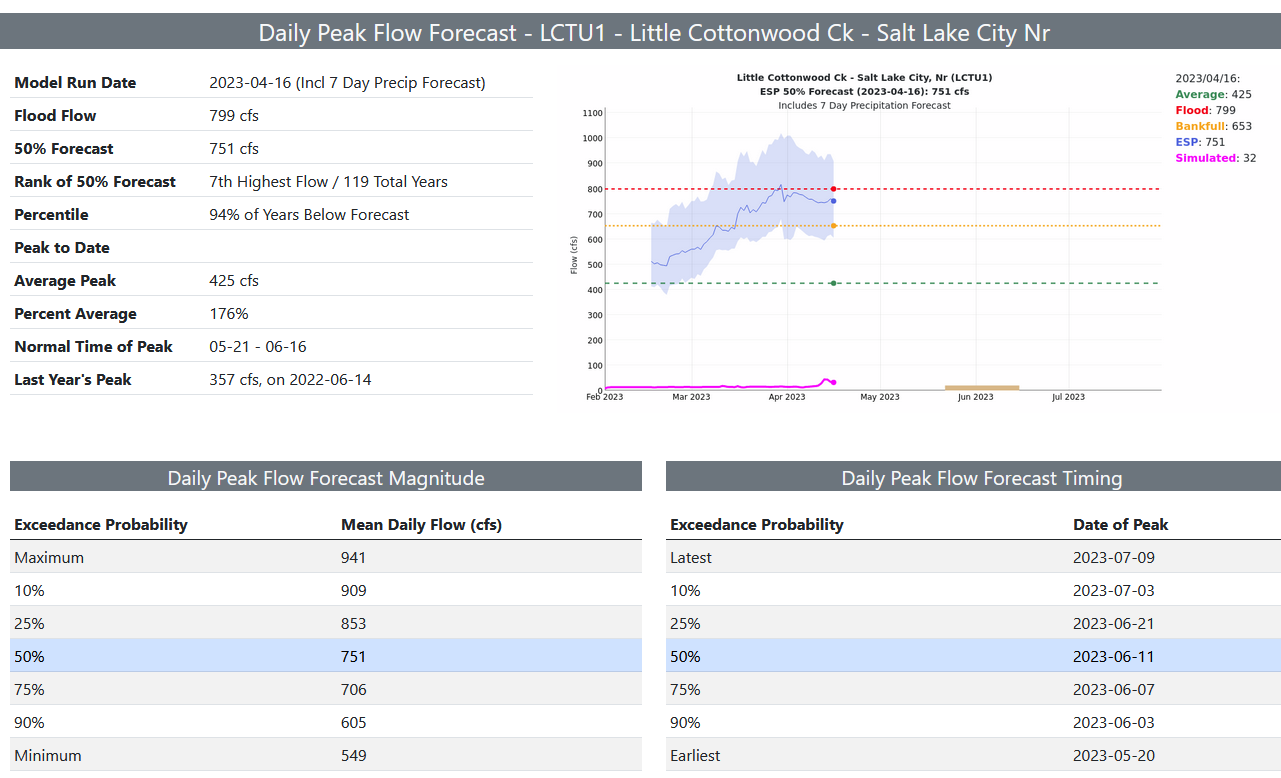
| There are other simpler formats for this kind of information but clearly, this format is more detailed. I selected Little Cottonwood Canyon since I used to ski there when I lived in Salt Lake City. As you can see, flood flow is 799 cubic feet per second (cfs). The 50% exceedance is currently 751 so it is right on the edge. There is a second creek in SLC that seems like a problem: City Creek. Not to worry they know how to deal with this in SLC, Utah. I have seen how they do it. Everyone fills sandbags and the creek runs through the city. City Creek may be more of a problem. |
–
Special Forecasts
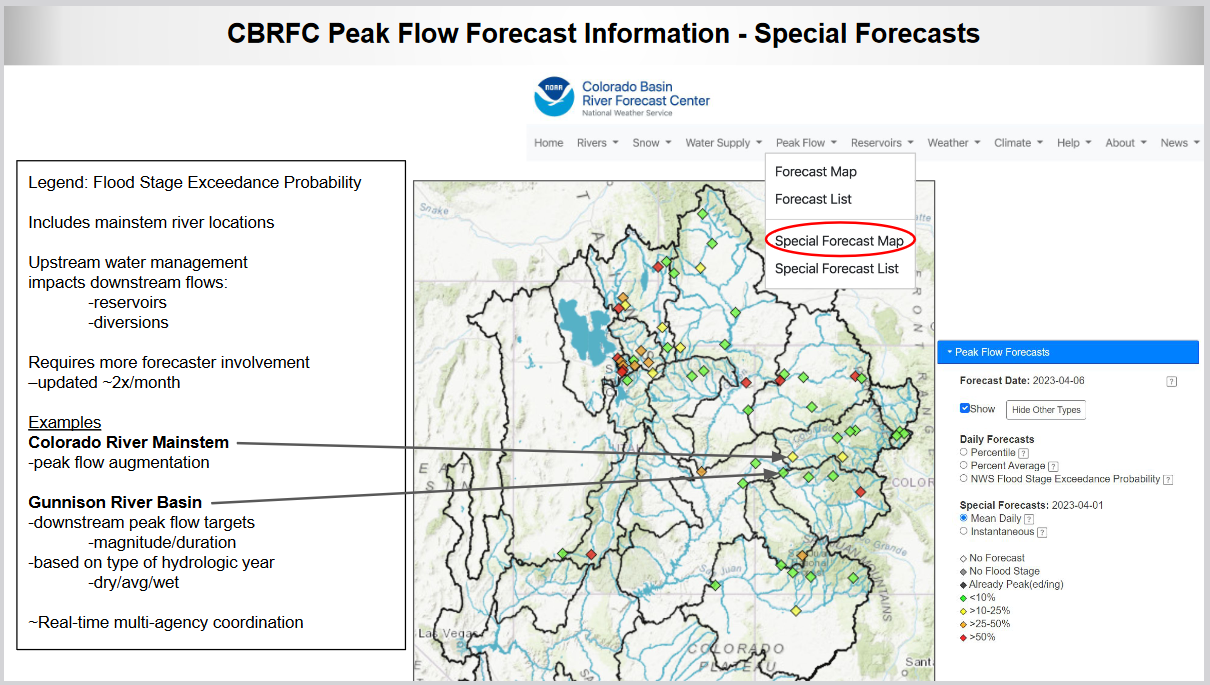
–
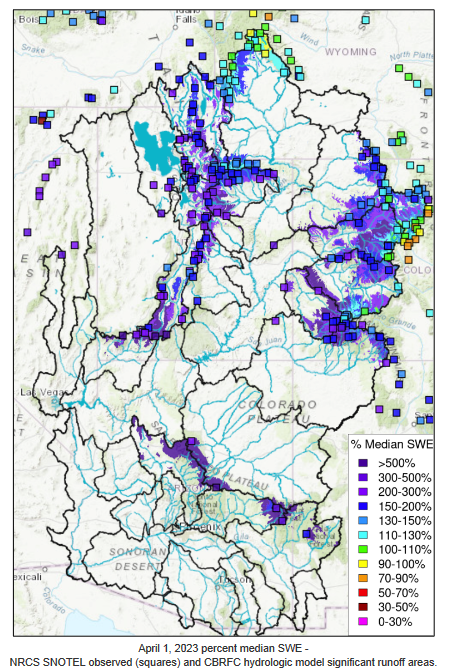
| This one shows the areas where the risk of flooding is high. I think this map gets updated daily but I am not sure of that. |
–
From a Different Source (USBR.gov) and Covering a Larger Area and with some more recent data:


Click HERE to update this image.
–
| Many reservoirs are back to their average. Others are still below average but much above the desperate levels of last year. |
–
Explanation of Abbreviations

–
| I hope you found this article interesting and useful. |
–