Additional editing at 11:01 p.m. EDT April 14, 2023. I noticed that a map had dropped out of the article so I replaced it and I expanded the discussion blocks. I moved some graphics around. It will be easier to read now. While preparing the article I had not realized the extent of the changes. So I have better highlighted those changes now.
On the second Thursday of every month, NOAA issues its analysis of the status of ENSO. This includes determining the Alert System Status. NOAA describes their Report as “ENSO Alert System Status: El Nino Watch”
If you read the fine print you can see that
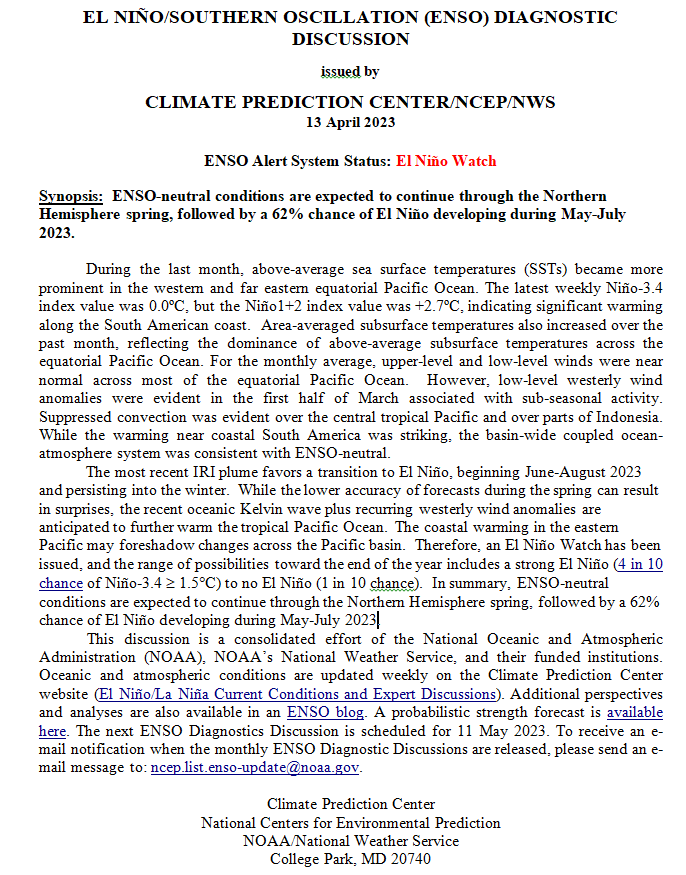
“While the lower accuracy of forecasts during the spring can result in surprises, the recent oceanic Kelvin wave plus recurring westerly wind anomalies are anticipated to further warm the tropical Pacific Ocean. The coastal warming in the eastern Pacific may foreshadow changes across the Pacific basin. Therefore, an El Niño Watch has been issued, and the range of possibilities toward the end of the year includes a strong El Niño (4 in 10 chance of Niño-3.4 ³ 1.5°C) to no El Niño (1 in 10 chance). In summary, ENSO-neutral conditions are expected to continue through the Northern Hemisphere spring, followed by a 62% chance of El Niño developing during May-July 2023.”
The article includes two very interesting posts from the ENSO Blog. They are worth reading.
| Announcement: We now publish a daily weather report that addresses U.S. weather near-term through four Fridays and a five-day Global weather forecast. You can find it at econcurrents.com. To return to this article just hit the return arrow at the upper left corner of your screen |
CLIMATE PREDICTION CENTER ENSO DISCUSSION
| The second paragraph is what is important: The most recent IRI plume favors a transition to El Niño, beginning June-August 2023 and persisting into the winter. This LINK is mostly for future reference as it is to a technical paper used by the forecasters of the strength of the El Nino. |
We now provide additional detail.
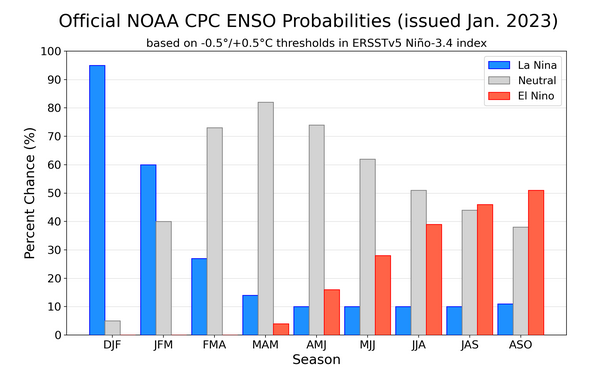
CPC Probability Distribution
Here are the new forecast probabilities. This information in the past has been released twice a month and the first release is based on a survey of Meteorologists, the second is based on model results. The probabilities are for three-month periods e.g. MAM stands for March/April/May. The first forecast is used to develop the Seasonal Outlook which will be issued next Thursday so that is what I am focusing on.
Here is the current release
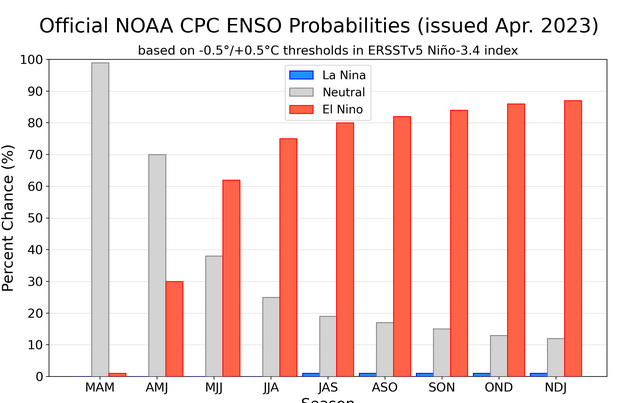
| You can clearly see the change in the probabilities from AMJ to MJJ. I pay a lot of attention to the middle month in the three-month period so J or June is what is being forecast. But this is just the forecast for Nino 3.4 Index. So the impact on U.S. and World weather will take a little time to show up. |
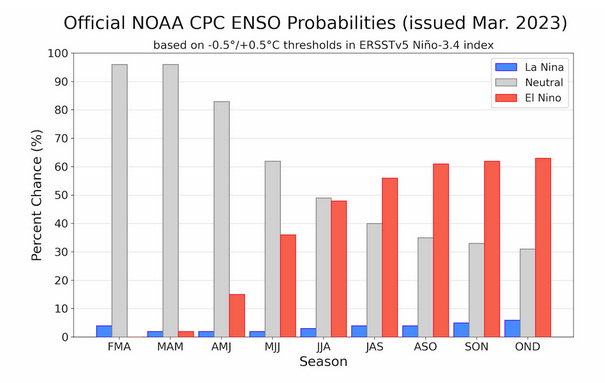
And here is the forecast from last month
And here is the forecast from the prior month

And the prior month.
| For a few months, there was not much change. Now the probabilities of an El Nino are very high and real question is how strong it will be. |
What Does the NOAA Proprietary ENSO Model Forecast?
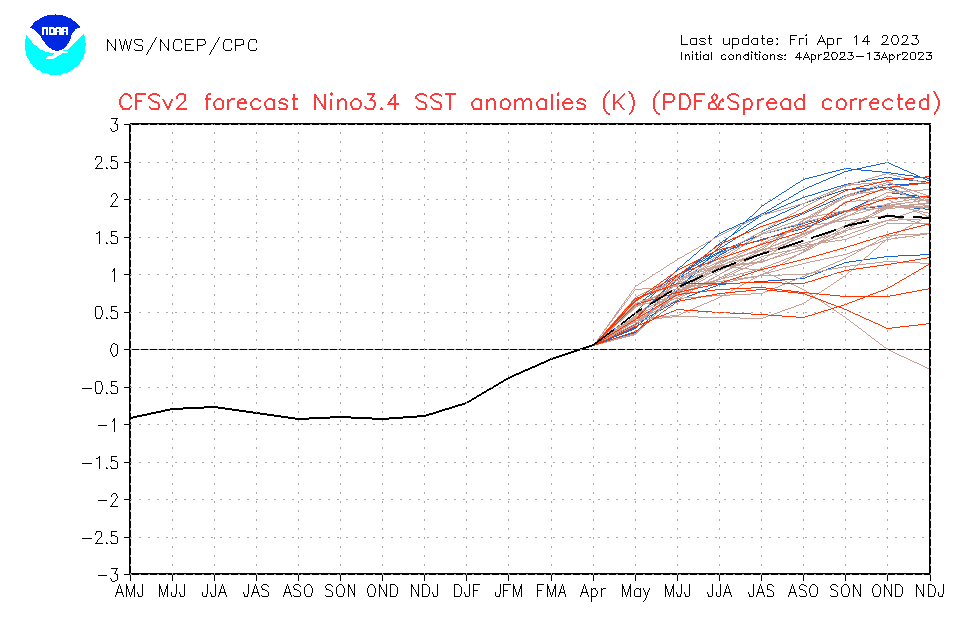
| This model shows the scatter in the forecasts but it is less than last month. The dark dashed line is the mean of the ensemble forecasts. NOAA tends to put more weight on the probability results that come out of their work with IRI but the two sets of results right now seem to be very similar. The above graphic is set up to not auto-update. If you want to see an updated version you can view an updated version by clicking HERE. But the current reading is what is relevant in terms of the NOAA ENSO analysis released on April 13, 2023. |
–
And BOM? (Australian Bureau of Meteorology
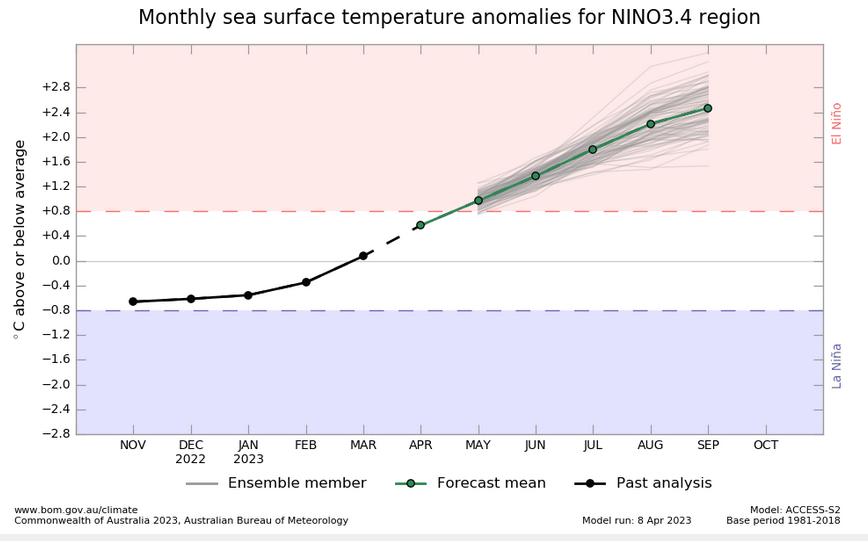
| BOM has a different cut-off for El Nino than other meteorological agencies. Based on their criteria, We will be in El Nino in May |
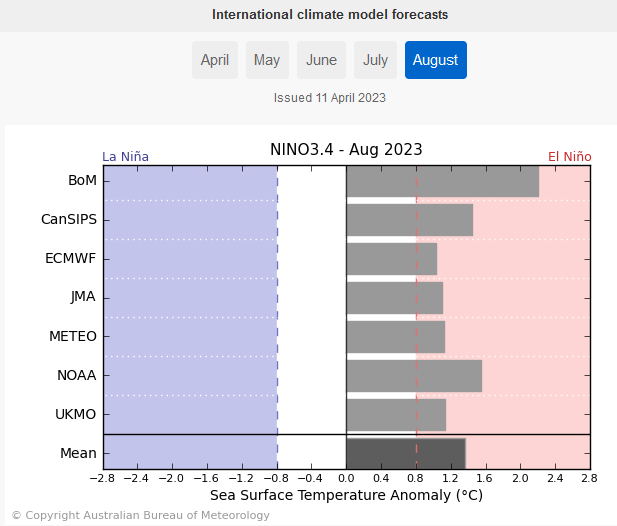
What do Other Meteorological Agencies Say
–
| What I am showing here are NINO 3.4 forecasts for August of 2023. These are well-respected models. And using the U.S. threshold of -0.5 C they show that we will be in El Nino in August with a variety of forecasts of severity. The Mean of the forecasts is moderate to severe El Nino with a Nino 3.4 value of about +1.6C |
–
Looking at Actual Current Conditions.
NOAA reports some derived data that describes the current situation and a forecast. But what if we want to form our own opinion? After all, meteorologists are looking at the actual current situation and making predictions.
This shows the current actual situation for the surface of oceans. To update this graphic click HERE.
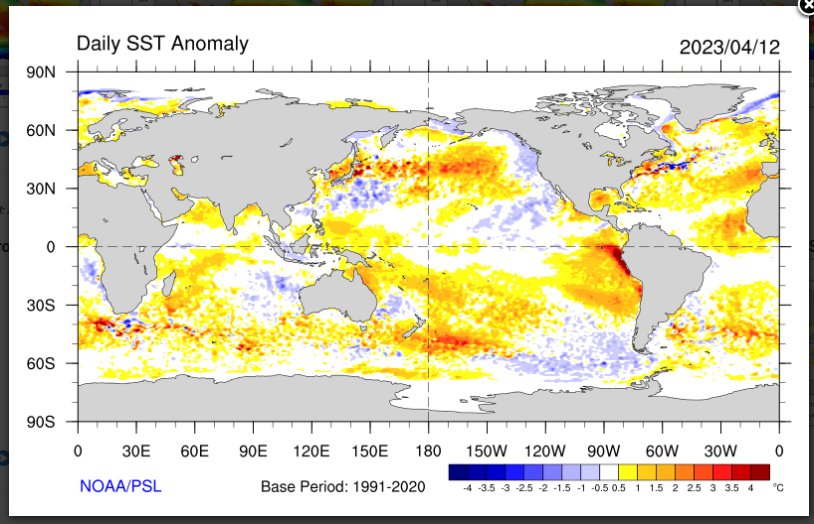
| Notice the warm water off of Peru. Notice the cool water off of the North American West Coast clearly indicating PDO negative conditions while we have a steady stream of Atmospheric Rivers arriving. It is a bit perplexing. |
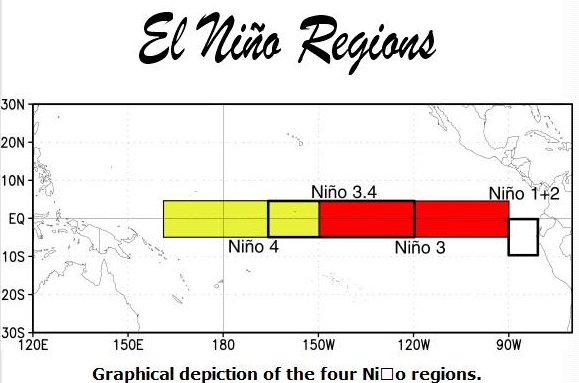
Where is ENSO Measured?
–
| You can mentally superimpose the Nino 3.4 area shown encompassing part of the yellow and part of the red areas in the above map and you can see that it is pretty much neutral in the Nino 3.4 area especially South of the Equator. However in the Nino 3 and Nino 1+2 Areas the water is very warm.- |
Putting the historical information in motion. Updates can be found HERE. but should not be needed.

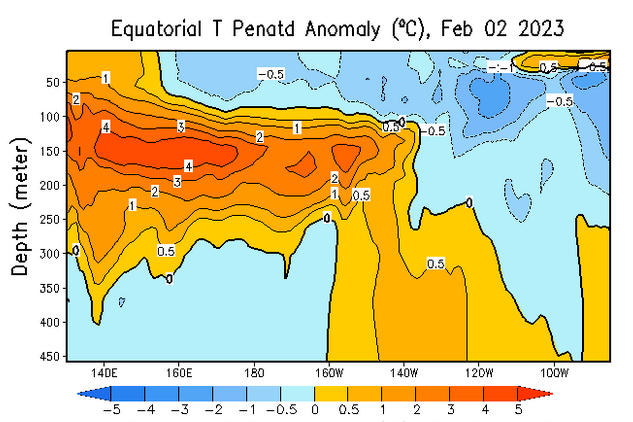
Now we look at the below surface temperature anomalies. Mapping the details. (Cross-Section along the Equator). The data is a five-day average centered on the date shown.
![]()
And last month

And the prior month
And the prior month
| We now see that the warm water at depth has undercut the cool water in the Eastern Pacific and indeed there is warm water at the surface off of Peru. But in the Nino 3.4 area it is warm but not very warm. You can see that the process really speeded up this last month. |
–
Here is an animation of the above.
You should not need to update this since it seems to auto-update but HERE is the link.
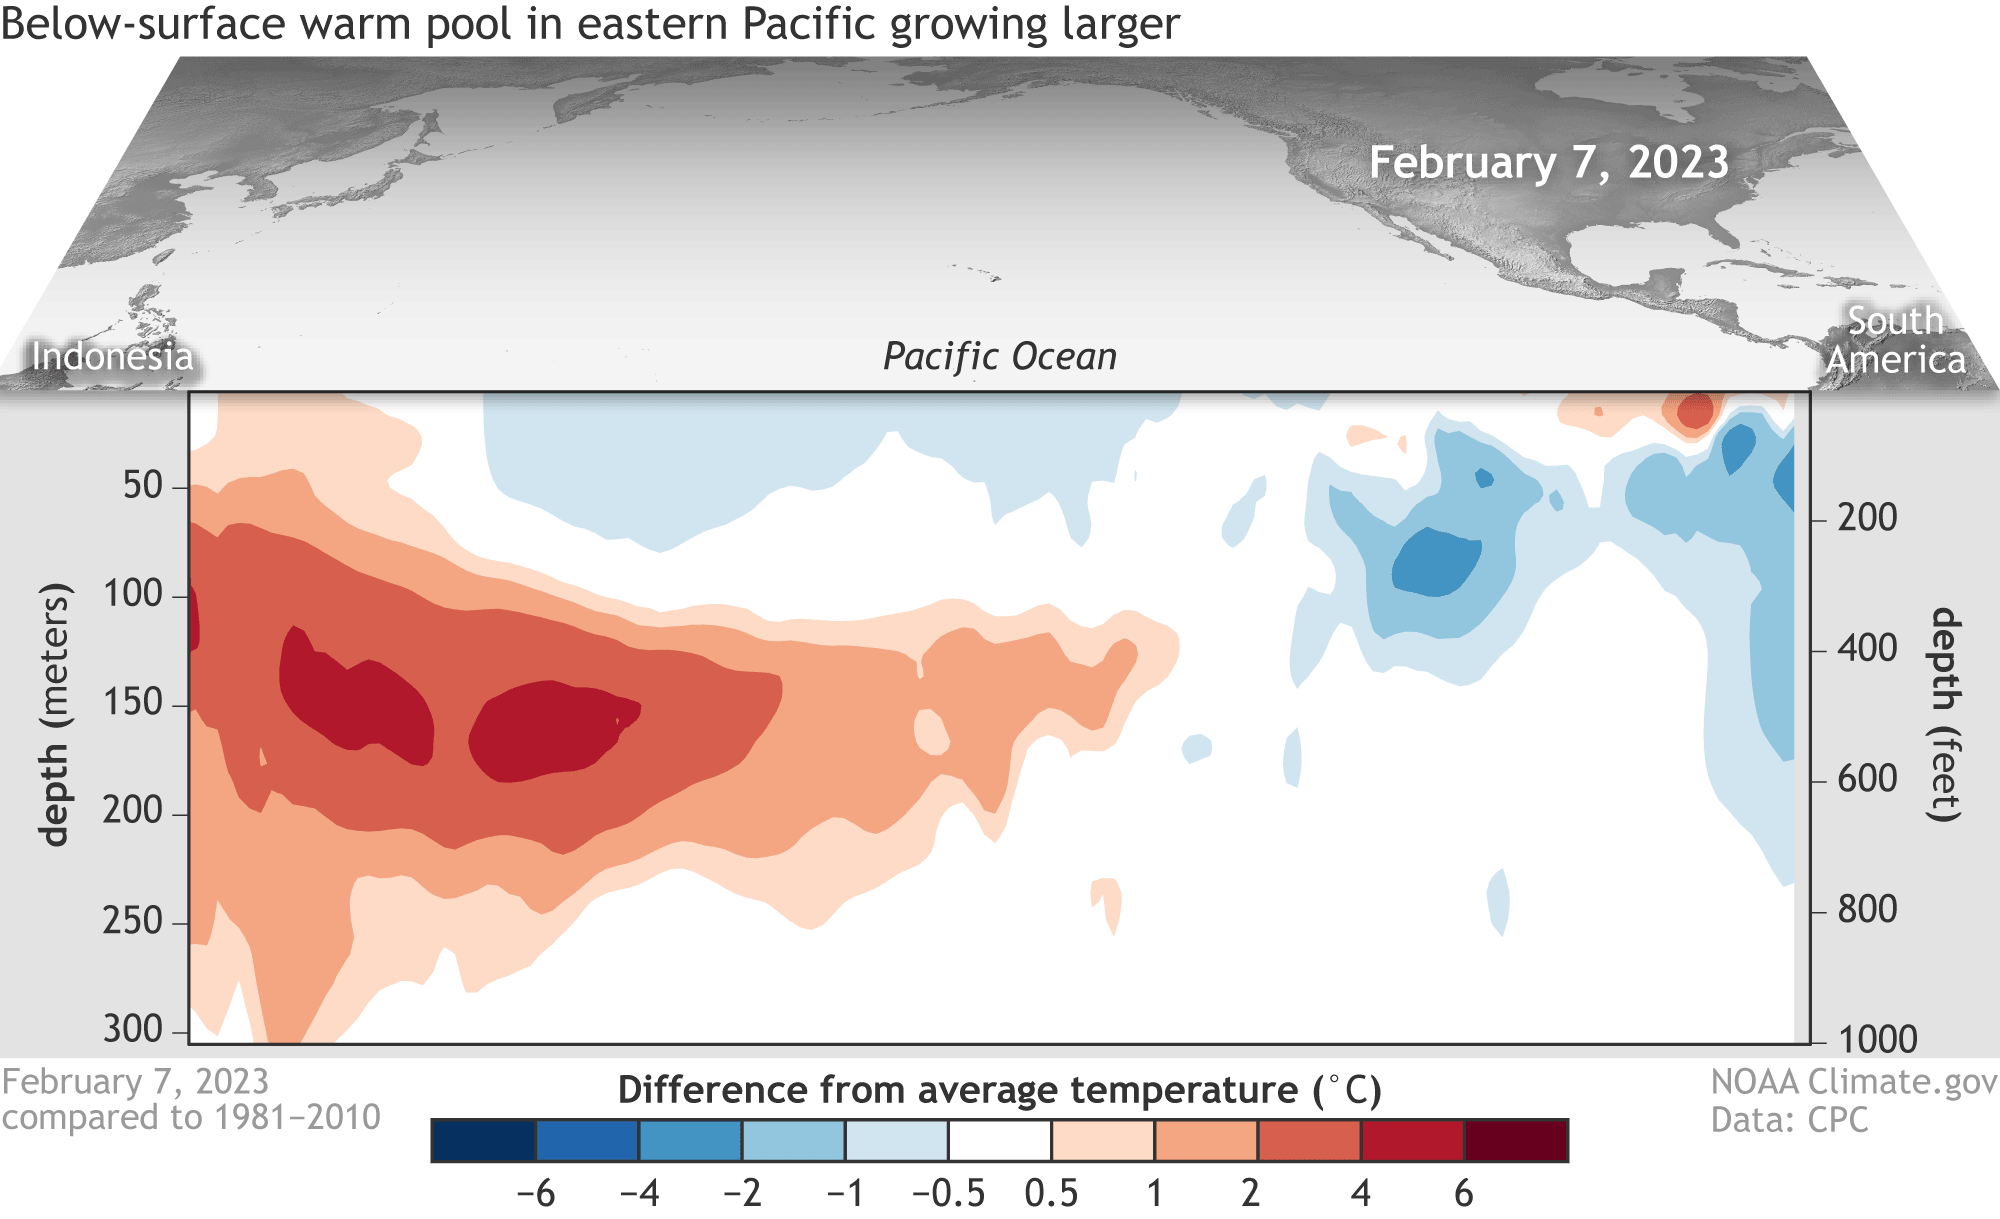
Water temperatures in the top 300 meters (1,000 feet) of the tropical Pacific Ocean compared to the 1991–2020 average in February–April 2023. NOAA Climate.gov animation, based on data from NOAA’s Climate Prediction Center.
Kelvin Wave: One explanation of the recent rapid change in the situation is an Oceanic Kelvin Wave.
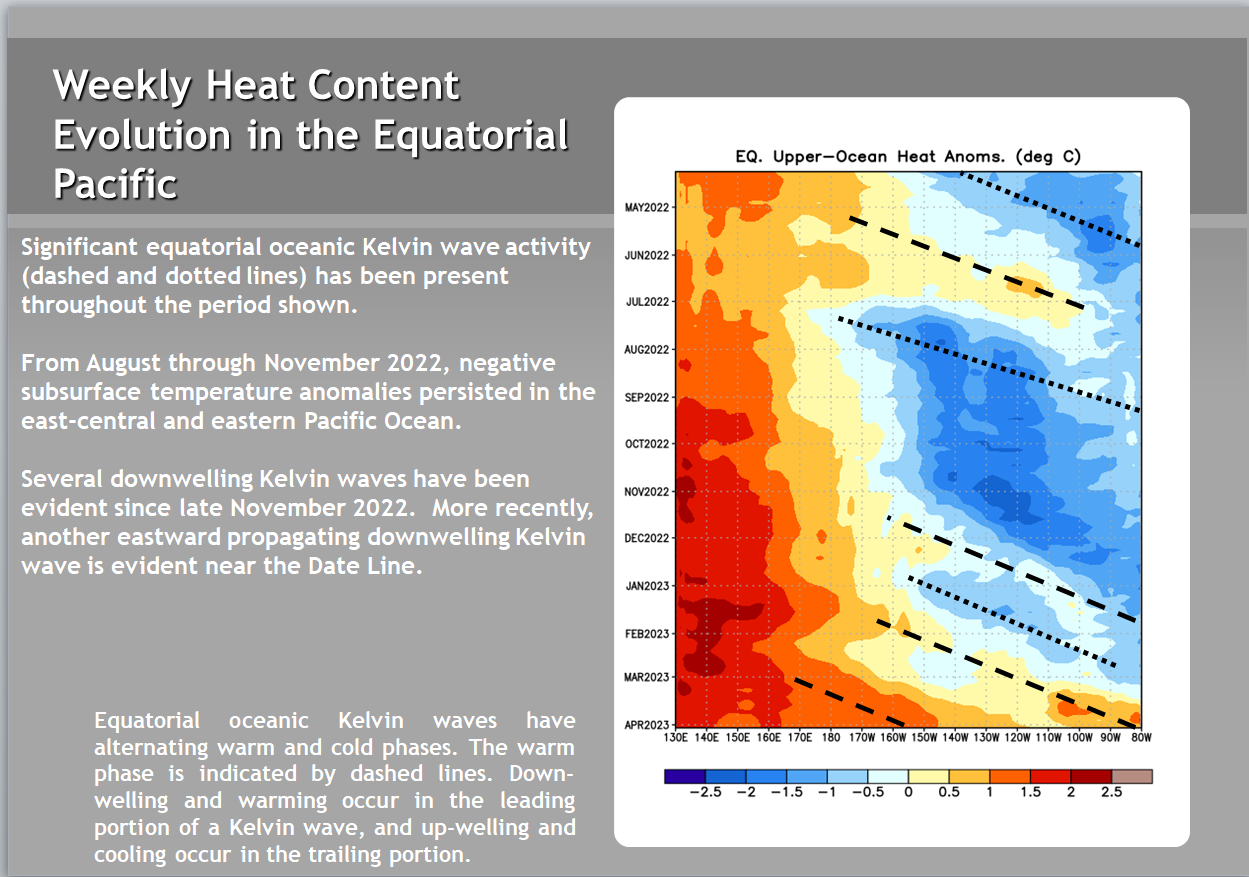
| This type of Kelvin Wave is one of the mechanisms for the warm water in the IndoPacific WarmPool to move to the east. This is a Hovmöller diagram It is sort of like a plotter graph as it shows the earlier time periods at the top and the most recent at the bottom. It is used a lot in meteorology. Notice the two dashed lines towards the bottom. It is showing that there was a weak downwelling Kelvin Wave that was not followed by an upwelling phase but instead by a subsequent and stronger downwelling phase. That broke the back of the La Nina. The MJO may have contributed to initiating the Kelvin Wave. Three consecutive years of La Nina caused the IndoPacific WarmPool to increase and begin to spread out. This makes it easier for this kind of Kelvin Wave to get started. That is why no one phase of ENSO can last indefinitely but it was a surprise to have three La Nina Winters in a row. |
–
Are the changes sufficient to move not just from La Nina to ENSO Neutral but all the way to El Nino?
We need to look at additional information.
I abbreviated this section tonight (and last month also) because it seems that we can be confident that we have left La Nina conditions in terms of the sea surface temperatures in the Nino 3.4 measurement area but is the atmosphere responding?

| The SOI has been falling which is consistent with the end of La Nina and is now in the ENSO neutral range. |
This from the NOAA ENSO Blog is an interesting Post by Emily Becker
You can read her blog post by clicking HERE
This is from her Blog Article.
–
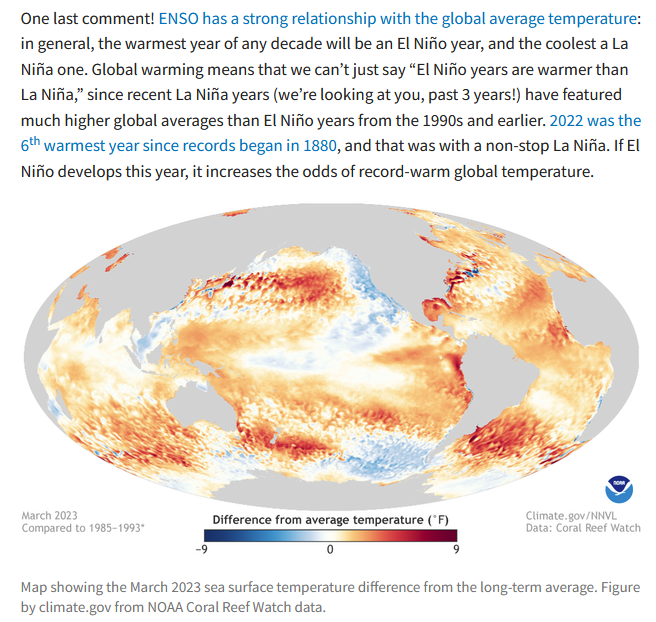
| A lot of warm ocean surface water. But cool off the West Coast. Very warm off of South America. Earlier we showed a daily version of this in a different format but comparing against different years. Not sure I remember why Emily Becker picked those years but it is probably in her post. The point that we are likely to have a spike in World average team if we have an El Nino is valid. The IndoPacific WarmPool should spread out a bit creating more evaporation which will transfer ocean heat into atmospheric heat. |
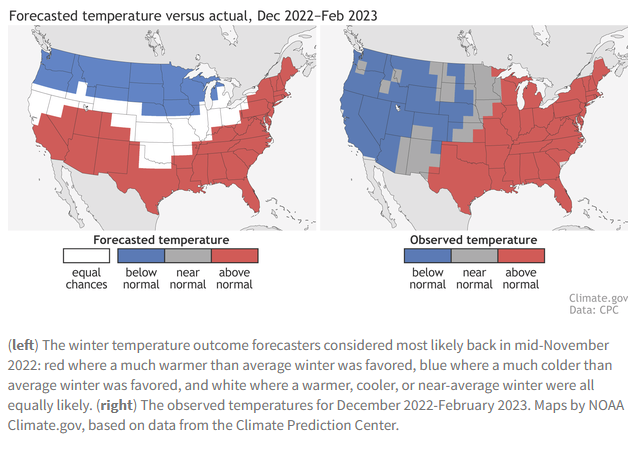
 Forecast v Observed Temperature
Forecast v. Observed Precipitation
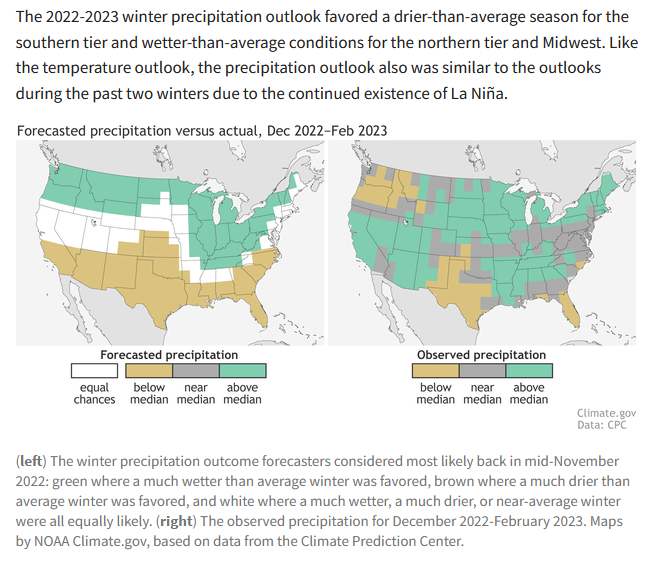
| The above is very interesting. In Tom’s Blog Post, he offers some possible explanations for why the forecasts were so wrong. |
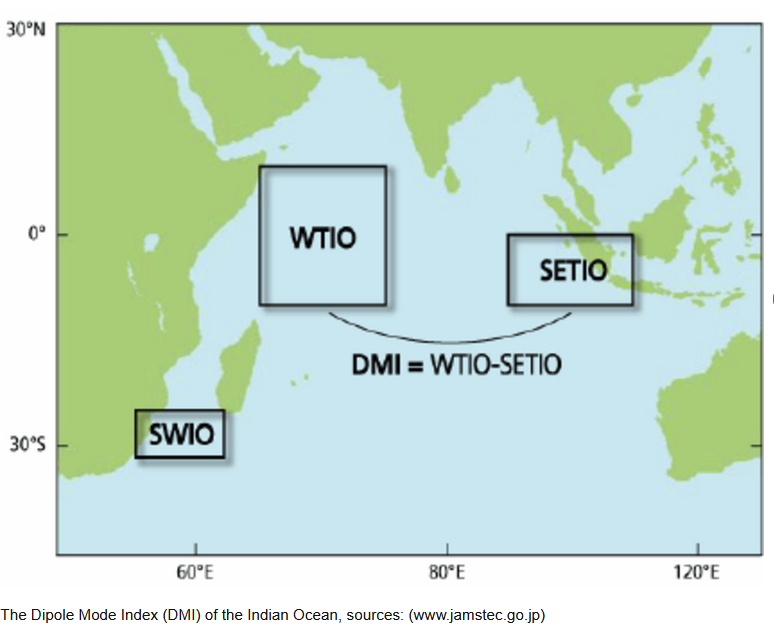
What about the Indian Ocean Dipole (IOD)?
| The index is calculated as the monthly difference between the western (10°S-10°N, 50°-70°E) (WTIO) and eastern Indian Ocean (10°S-0°, 90°-108°E) (SETIO) sea surface temperature departures from average. |
–
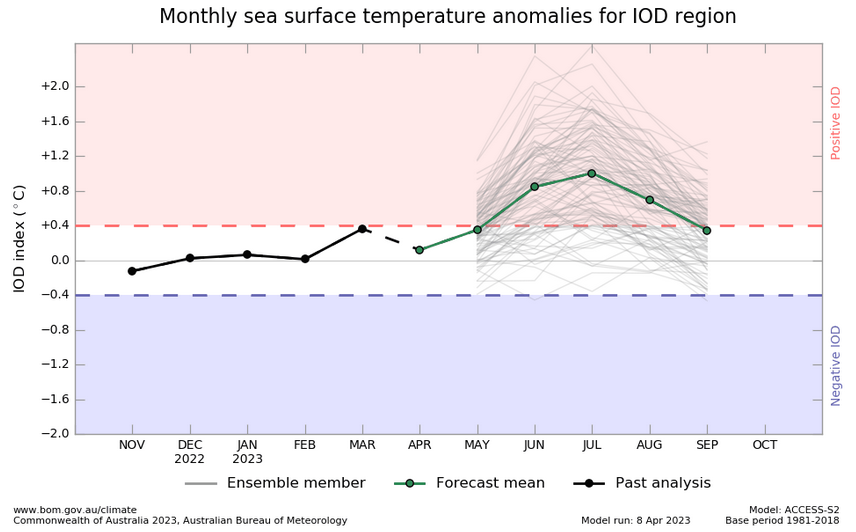
Australia BOM IOD forecast
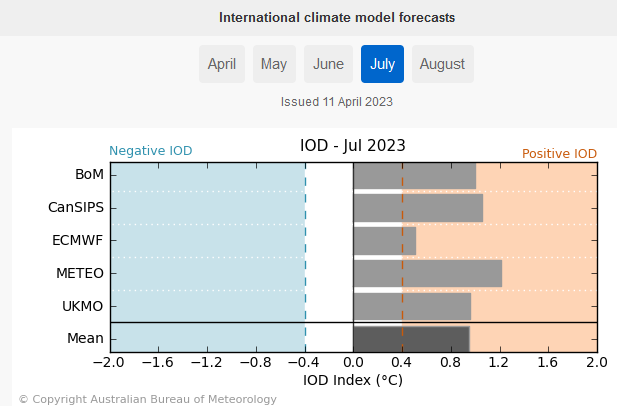
 And looking at some additional models
–
| The IOD seems to possibly reoccur this summer. But it also is hard to predict. So I am not going to discuss that in detail tonight. If it is still in the forecast next month I will provide additional information on the possible impacts. It may be bad news for Australia. It will impact all nations where their weather is impacted by the Indian Ocean. I may discuss it some more when I publish the JAMSTEC forecast that I have received. |
| I hope you found this article interesting and useful. |