I realize that we are past mid-Februray and I recently presented the NOAA Seasonal Outlook, but it makes sense to review January of this year. In this article, I will first take a global perspective and here I rely on the large volume of information that is issued by NOAA (NCEI Div) and then I will take a look at the state rankings in January. The state rankings look at how each state’s January 2023 temperature or precipitation fits in terms of its 129 years of recent history.
Although NCEI seems to think that the important information about January is that it was the seventh warmest on record, that may fall into the category of a given and we will discuss that at the beginning of the article. What I found most interesting was the information on sea ice.
U.S. and Global Weather were very different in January of 2023

First, we will take a global perspective and then later focus on the U.S.
I quote extensively from a press release by John Bateman and many other resources from the same agency. My comments are in boxes to avoid confusion between official statements from NCEI and my comments. NCEI and other parts of NOAA provide a vast array of graphics to choose from some of which were in John Bateman’s press release. I have used some of those graphics and added others from NCEi and other parts of NOAA.

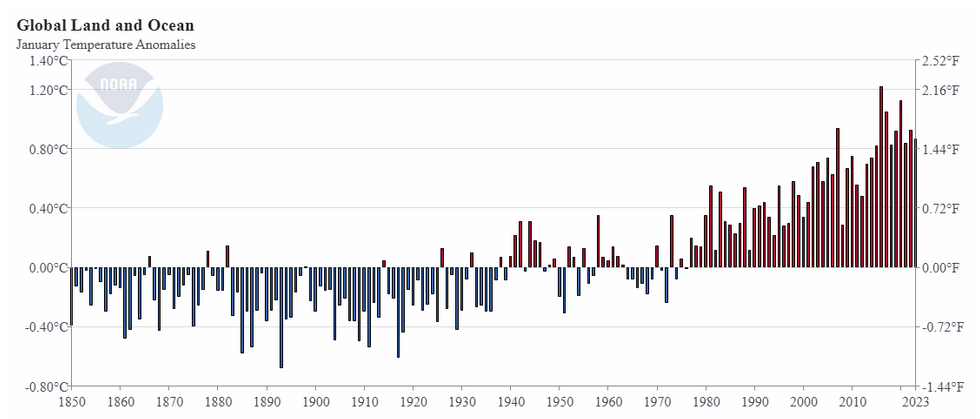
I would like to start with this graphic which was not included in John Bateman’s press release.
–
| First I will start by taking exception with NCEI. They state that “January 2023 was the seventh warmest on record” as if that was shocking news. If you look at the above you will see that 2023 was either in line with the recent situation or slightly cooler. I believe in honest reporting which includes not making misleading statements. I think NCEI leaves something to be desired in that regard. There is a good chance that if we transition to El Nino the above graphic will show an increase for 2023. There may be long-cycle components to the above such as the PDO and AMO and their Southern Hemisphere counterparts. There is plenty of problematic weather in January 2023 to report on without getting involved in sensationalism. It is just the title that I have a problem with. The rest of the report appears to be objective. |
–
Notable events
Continuing
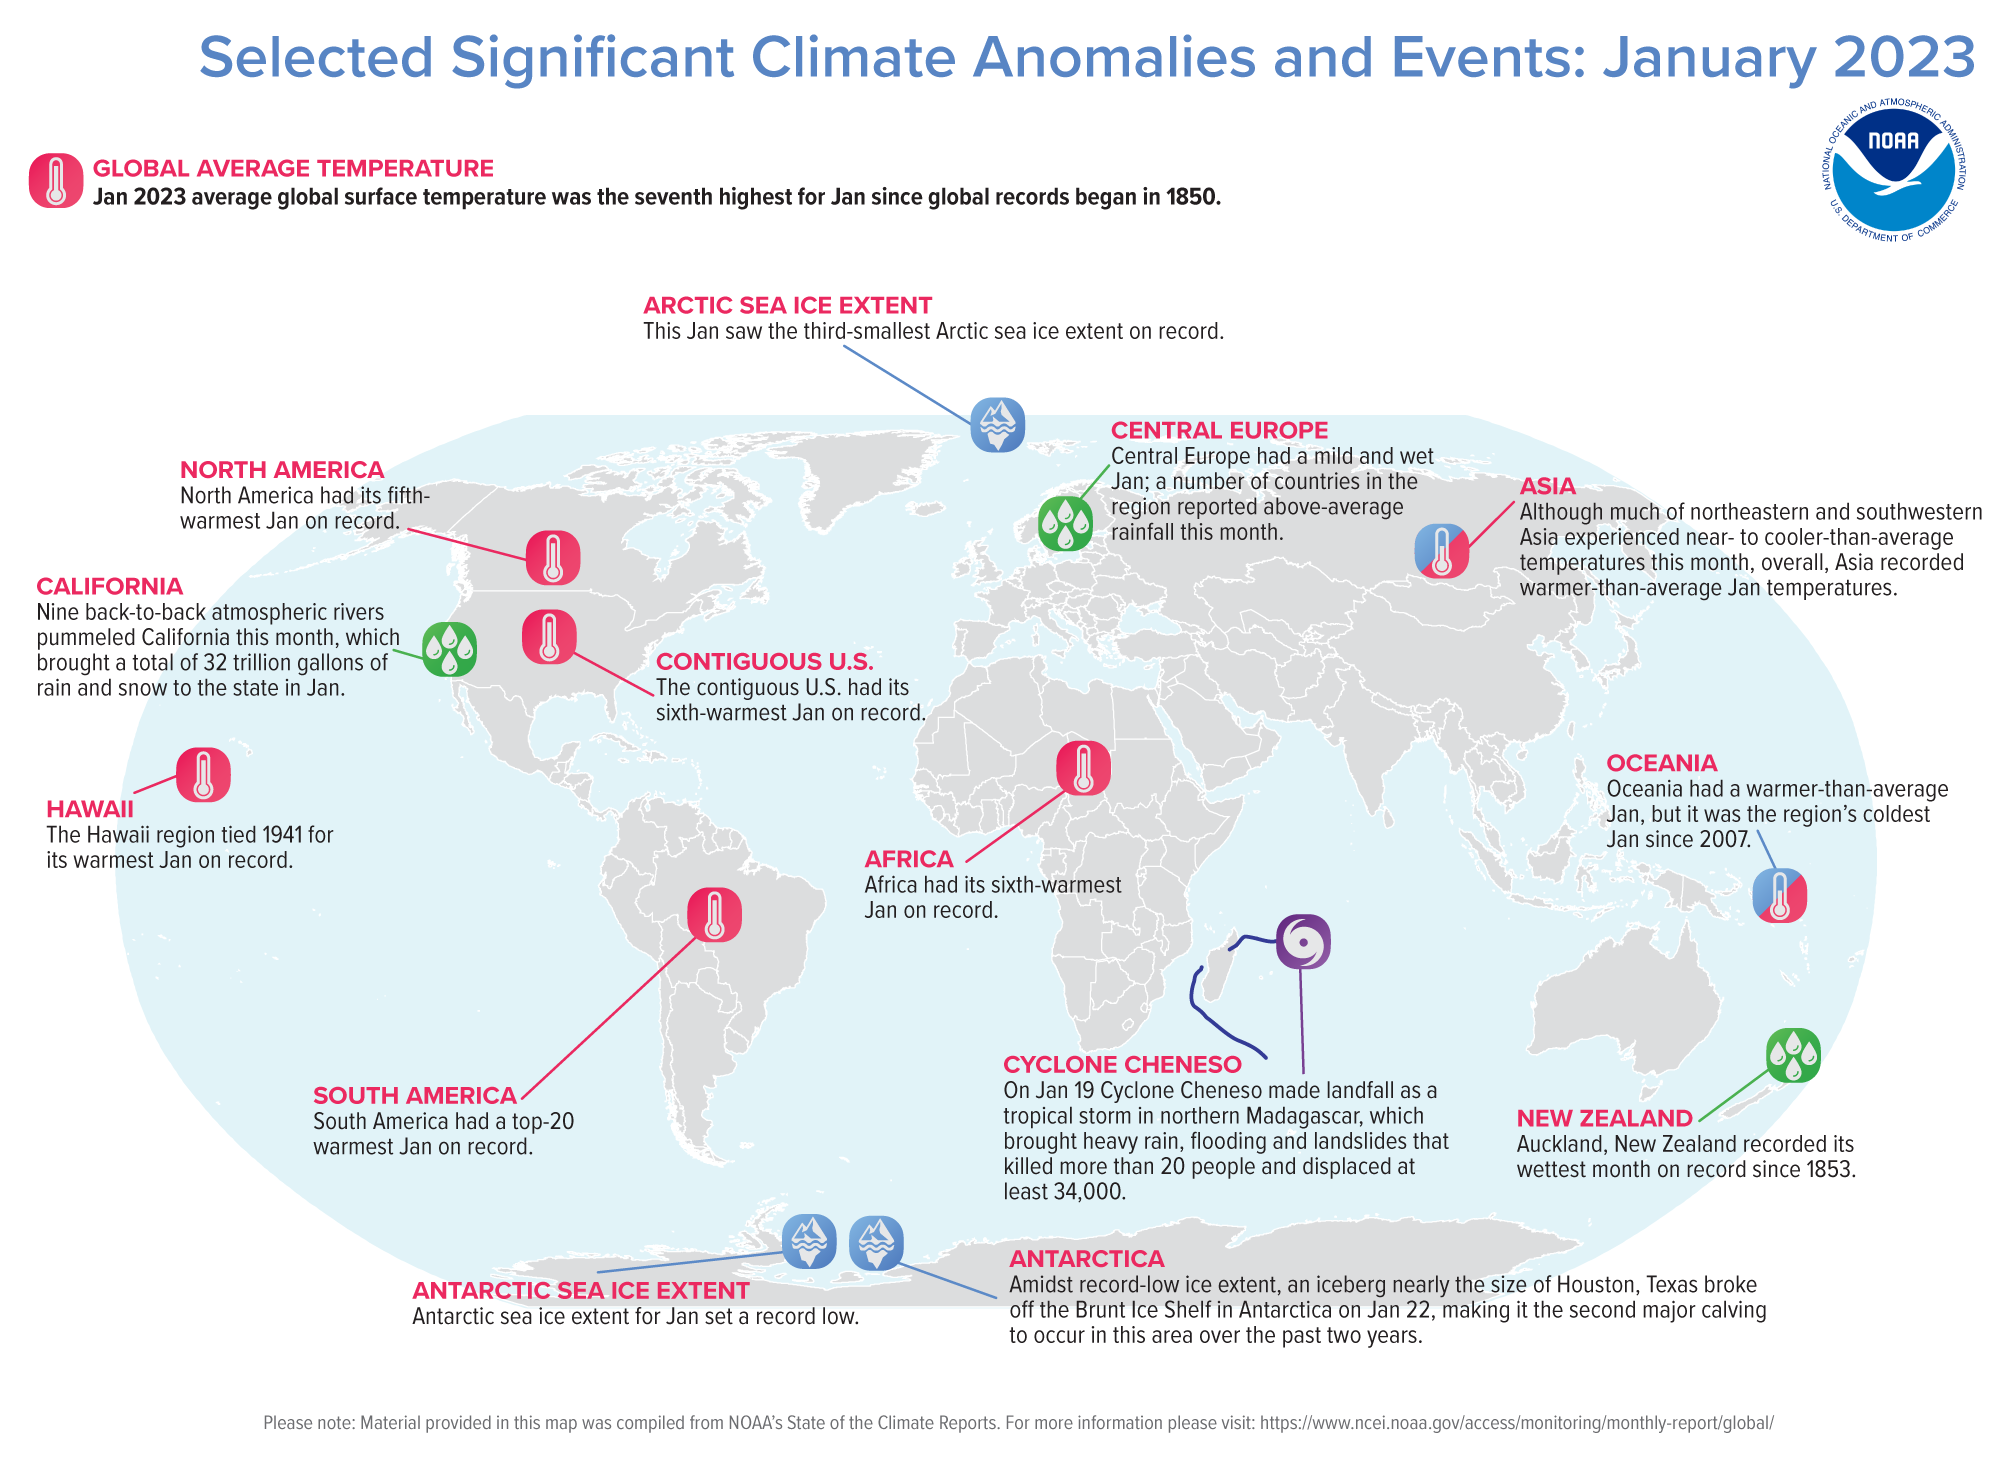
“January Highlights:
Europe had its warmest January on record, while North America and Africa each had a January that ranked among the 10 warmest on record.
Arctic sea ice extent ranked third lowest on record, while Antarctic sea ice hit a record low for January.
Cyclone Cheneso in the South Indian Ocean was the only storm of tropical cyclone strength this month.
Globally, January 2023 was the seventh-warmest January in the 174-year NOAA record. According to NCEI’s Global Annual Temperature Outlook, it is virtually certain (> 99.0%) that the year 2023 will rank among the 10-warmest years on record.
This monthly summary, developed by scientists at NOAA’s National Centers for Environmental Information, is part of the suite of climate services NOAA provides to government, business, academia and the public to support informed decision-making.
Coinciding with the release of the January 2023 Global Climate Report, the NOAA Global Surface Temperature (NOAAGlobalTemp) dataset version 5.1.0 replaced version 5.0.0. This new version includes complete global coverage and an extension of the data record back in time an additional 30 years to January 1850. While anomalies and ranks might differ slightly from what was reported previously, the main conclusions regarding global climate change are very similar to the previous version. Please see our Commonly Asked Questions Document and web story for additional information.”
Monthly Global Temperature
The January global surface temperature was 1.57°F (0.87°C) above the 20th-century average of 53.6°F (12.0°C). This ranks as the seventh-warmest January in the 174-year record. January 2023 marked the 47th consecutive January and the 527th consecutive month with temperatures at least nominally above the 20th-century average.
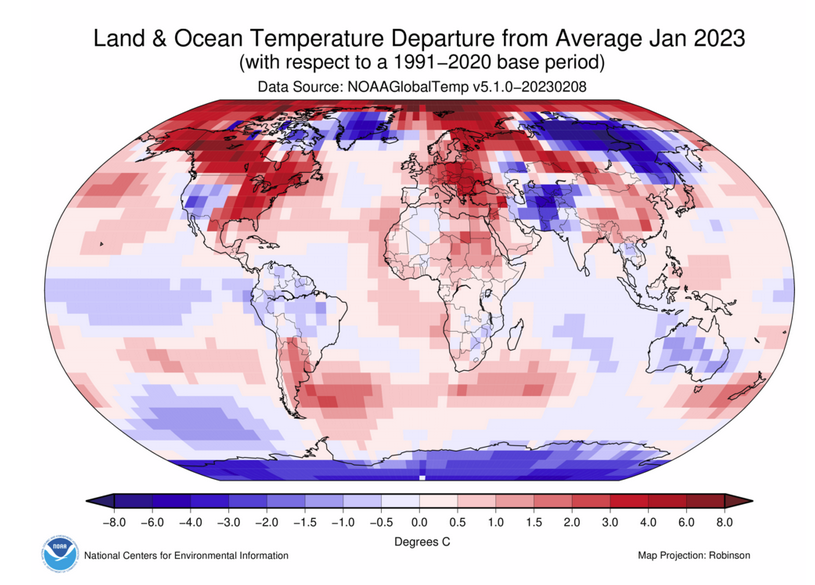
The year started off unusually warm and mild in Europe, which had its warmest January on record. North America had its fifth-warmest January on record, while Africa had its sixth. South America had a January that ranked among its 20 warmest on record. Asia and Oceania each had a warmer-than-average January, but it did not rank among their 20 warmest on record. In fact, Oceania had its coldest January since 2007.
Temperatures were above average throughout most of Europe and the Arctic, much of Africa and northern and eastern North America, and across parts of southern South America and northwestern, central, and southeastern Asia. Sea surface temperatures were above average across much of the northern, western and southwestern Pacific and the Atlantic. The Hawaii region tied January 1941 for its warmest January on record. [Editor’s Note: 1941 was a very unusual year globally] Overall, record warm temperatures covered 3.6% of the world’s surface this month.
Global Precipitation (I was only able to find a land-only graphic).
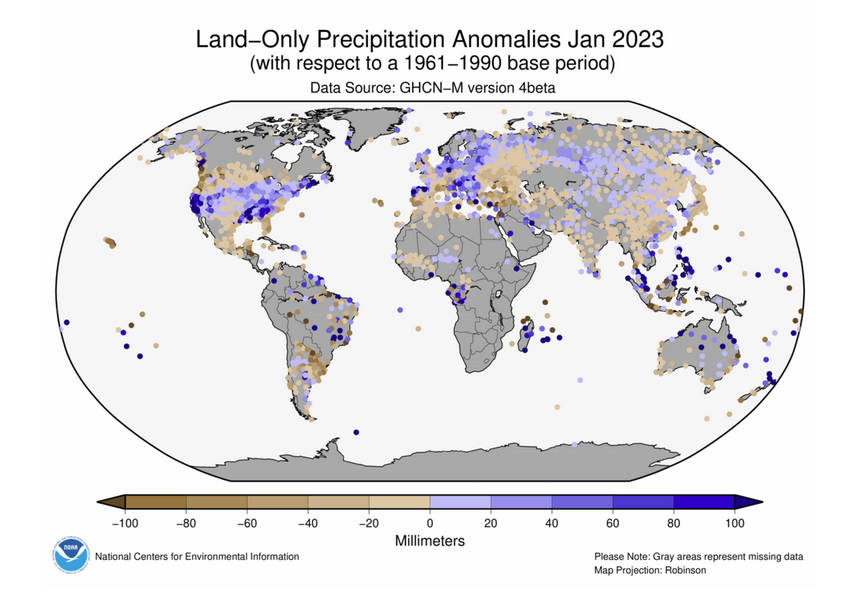
Above-average January precipitation was observed across parts of northeastern and inland eastern Northern America, the central and southern coast of the western U.S., central Europe, central Asia and eastern Oceania. Auckland, New Zealand recorded its wettest month on record since 1853. In the U.S., nine back-to-back atmospheric rivers pummeled California, which brought a total of 32 trillion gallons of rain and snow to the state this January. Meanwhile, drier-than-average conditions were present throughout much of Mexico and across parts of the northwestern U.S. and eastern, southern and western Asia.
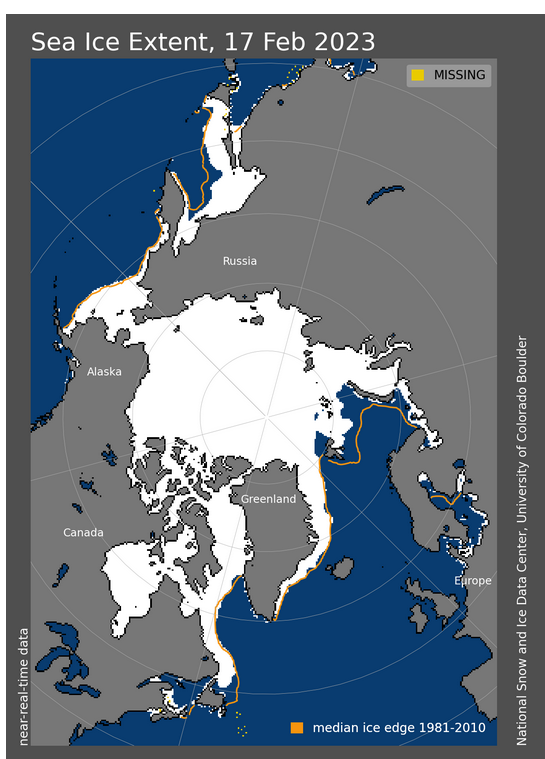
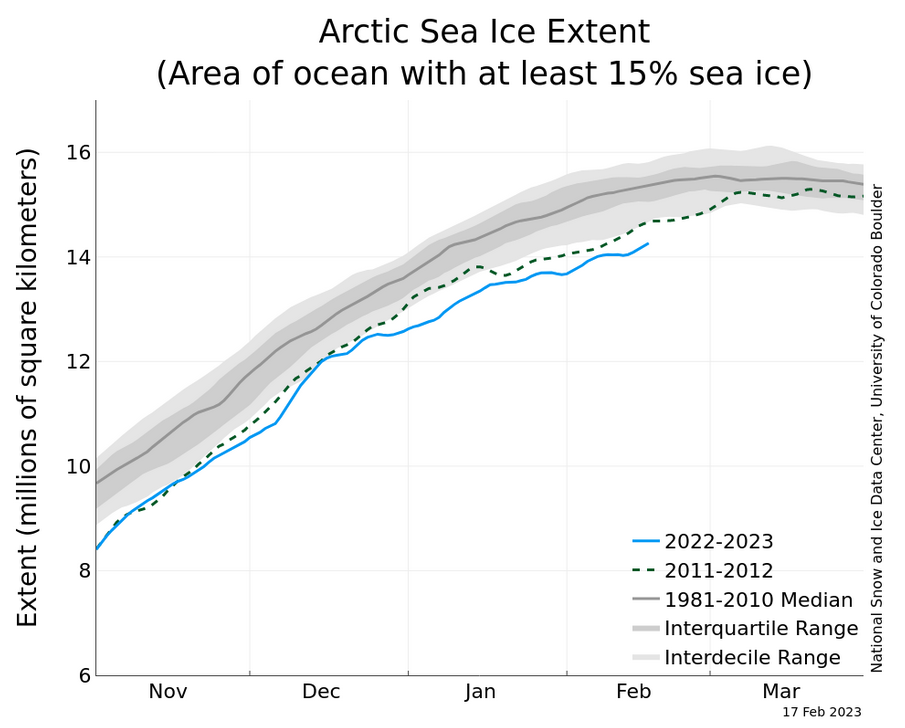
Sea Ice News (Source)
Globally, January 2023 saw the lowest January sea ice extent on record. This surpassed the previous record low, set in 2017, by 150,000 square miles.
Arctic sea ice extent in January averaged 5.15 million square miles, which is about 243,000 square miles below the 1991-2020 average. This marks the third-smallest January extent in the 45-year record. The January 2023 Antarctic sea ice extent hit a record low for January at 1.25 million square miles, which is about 700,000 square miles below the 1991-2020 average. This January’s extent was roughly 210,000 square miles smaller than the previous record low from January 2017.
According to data from NOAA and analysis by the Rutgers Global Snow Lab, the Northern Hemisphere snow cover extent during January was about 376,000 square miles below the 1991-2020 average. This ranks as the 17th-lowest Northern Hemisphere snow cover extent on record. Extent was above average throughout much of western North America and eastern Asia, and below average across most of eastern North America, Europe and southern Asia. Overall, North America had a near-average snow cover extent this month while Eurasia tied 1991 for its ninth-lowest extent in the 57-year record.
–
| On this graphic it looks like a record low which shows that how you present numbers is important. What looks like the prior range of values is not the full range check the Legend. The graph above it shows where the losses are via the organge line. |
–
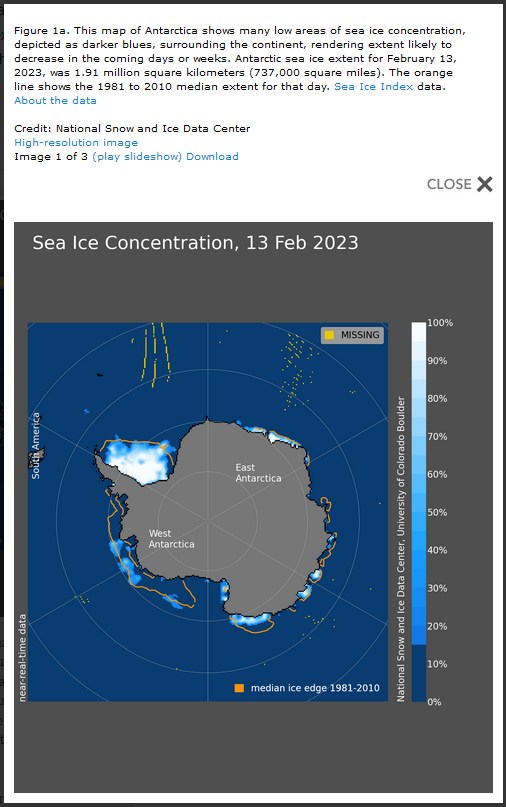
–
| The key is the change from the orange line. The image quality is not wonderful. It seems that the major losses were in Antarctica not the northern Hemisphere. The text preceeding these maps explains this if you read it carefully. |
–
Global Tropical Cyclones
Four named storms occurred across the globe in January. No storms reached major tropical cyclone strength (≥111 mph), but one reached tropical cyclone strength (≥74 mph). These counts are all below 1991-2020 averages for January. No storms were active in the Northern Hemisphere, which is typical for January. Cyclone Cheneso, which formed in the South Indian Ocean, brought heavy rain and flooding to Madagascar and was the only storm of tropical cyclone strength this month. Of the three other storms, two occurred in the Southwest Pacific and one off the coast of Australia.
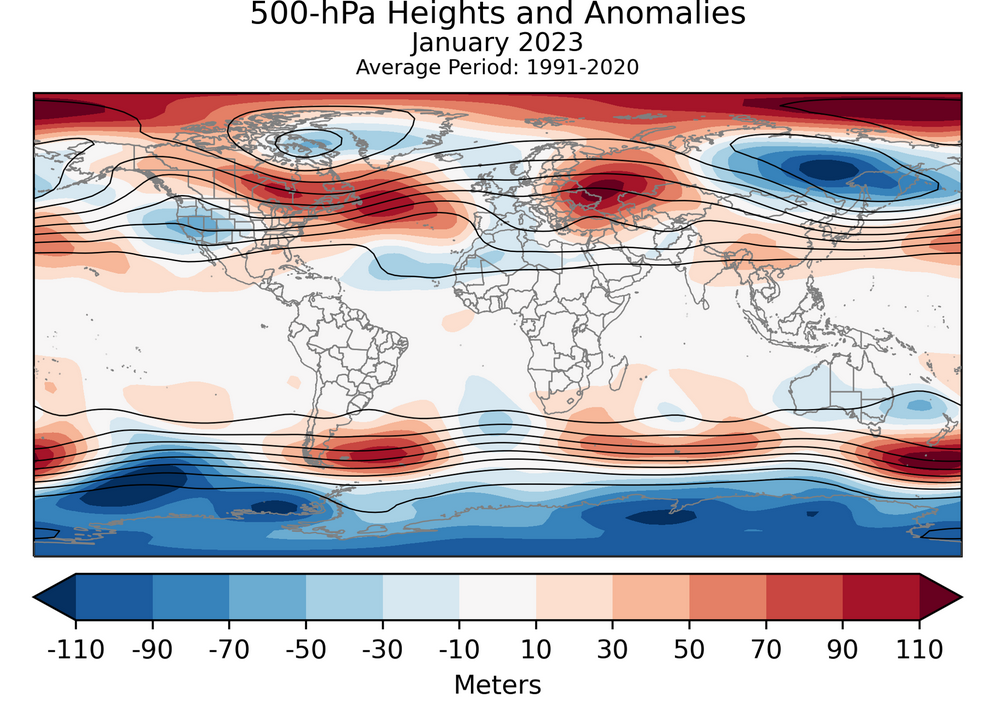
How about the overall weather pattern?
–
| It is a typical La Nina Pattern and should correlate with the earlier temperature and precipitation deviations from Normal. |
–
Now let us look at the U.S. State Rankings. The state rankings look at how each state’s January 2023 temperature or precipitation fits in terms of its 129 years of recent history.
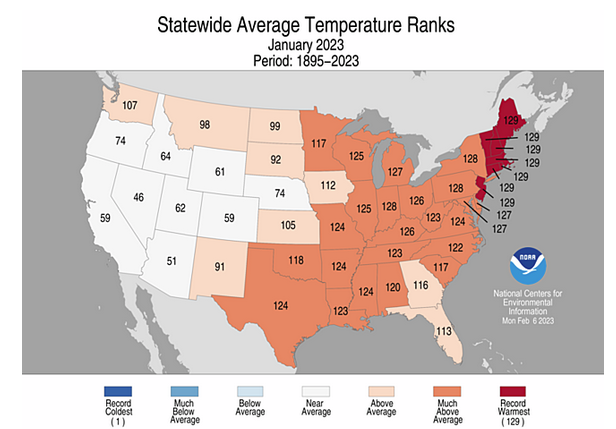
| Five states had record warm. A large number were warmer than average. |
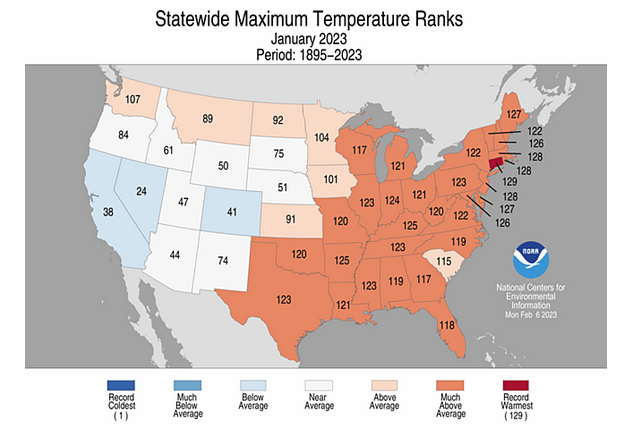
| One one state had record warm. Three states were much below average. This is characteristic of the process of global warming and is also associated with certain weather conditions. |
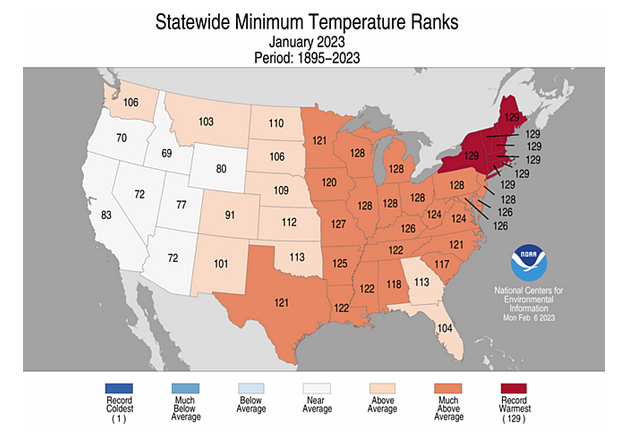
| To complete the picture, the five states with record minimums explain why they had record average temperatures but only one had record highs. This is often associated with dry conditions and also possibly low wind. |
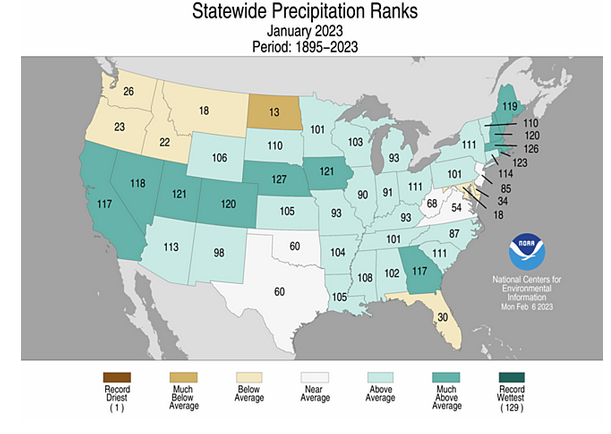
| No state had record precipitation but 11 were much above average while 7 were below average and 1 was much below average. Overall, the CONUS (48 states) was wetter than its history. There seems to be somewhat of a correlation between much wetter than average and below-average maximum temperatures and winter storms will do that. |
Sometimes looking at the precipitation by Climate Division provides additional insight.
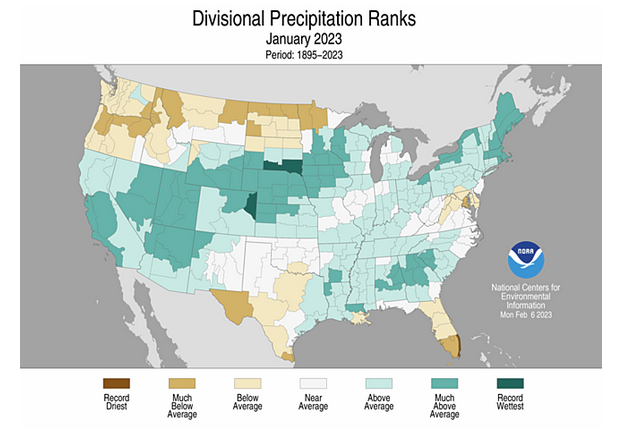
| One might even imagine that looking at climate divisions reveals the prevailing storm track. For sure it reveals a few climate divisions that had record wet conditions in terms of the 129-year history for Januarys. |
–
| I hope you found this article interesting and useful. |
–