Updated at 6:30 p.m. EST Saturday, January 28, 2023
Here is what we are paying attention to in the next 48 to 72 hours. This article also includes World weather forecasts.
It also includes links for longer-term outlooks and sometimes (like today) we show the maps that one finds if one clicks on those links. But we can not update all of those maps each day so look at the date and the duration of the period of time involved. If you want a more up-to-date map, click on the provided link which may be located in a table of links. If the date in the title of the article is not today’s date. just go to Econcurrents.com and look for today’s weather article.
We start with the U.S. Information.
Short Range Forecast Discussion
NWS Weather Prediction Center College Park MD
258 PM EST Sat Jan 28 2023Valid 00Z Sun Jan 29 2023 – 00Z Tue Jan 31 2023
…Heavy snow over parts of the Great Lakes…
…There is a Slight Risk of excessive rainfall over parts of the Central
Gulf Coast into the Southeast……Pockets of rain/freezing rain over parts of the Southern Plains to the
Great Lakes……Temperatures will be 15 to 35 degrees below average over parts of the
Northern/Central Rockies and High Plains…

First, the 48-Hour Forecast (It is a 48 to 72 Hour Forecast actually)
Daily weather maps. I try to keep the below three maps updated. The Day 1 map updates twice a day and the Day 2 and 3 maps update only once a day. I will be doing the updating during the period described in the title of the article but if you happen to read this article later, you can get updates by clicking HERE.
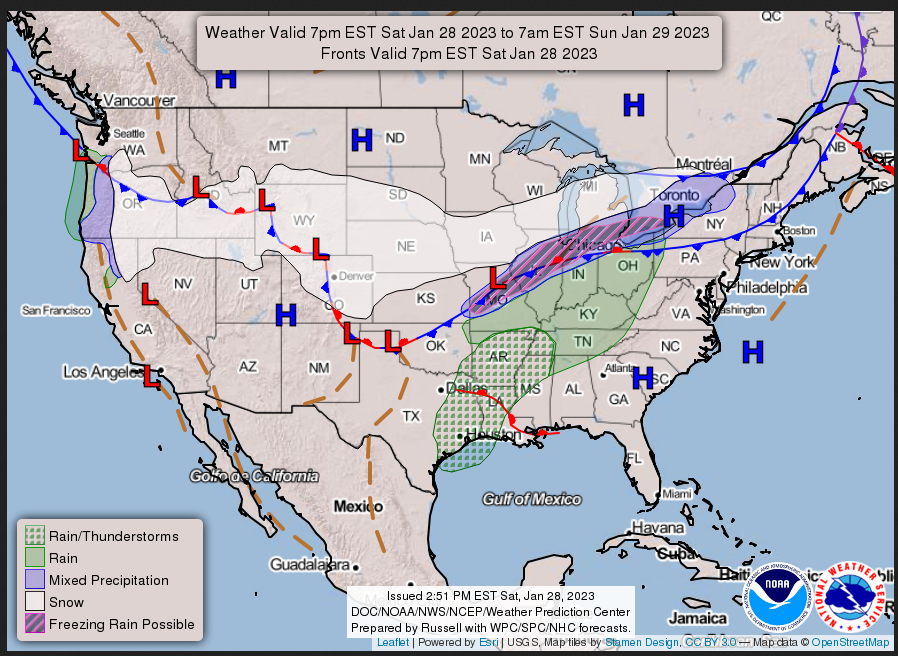
SATURDAY AFTERNOON, EVENING AND OVERNIGHT
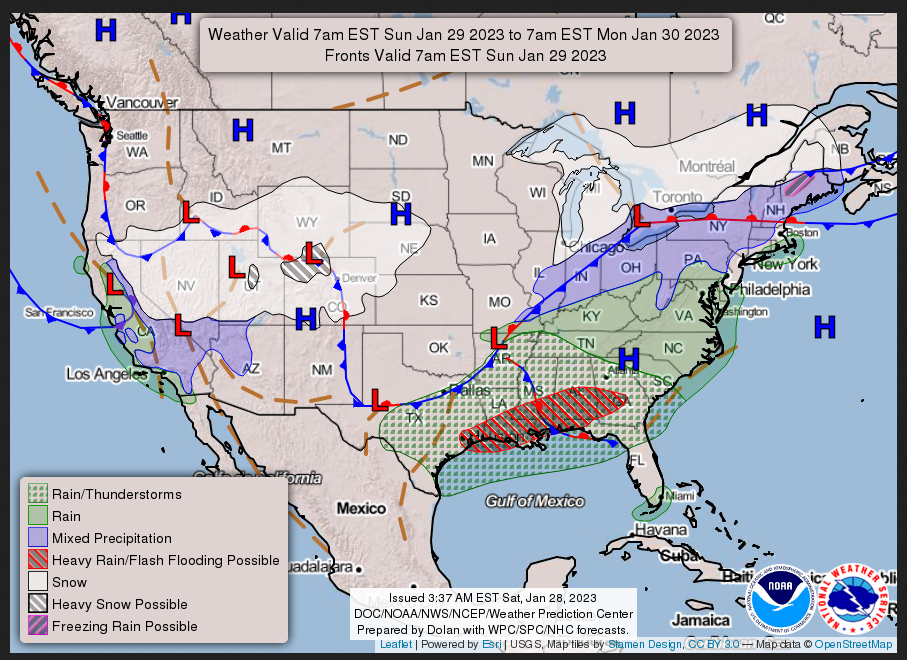
SUNDAY
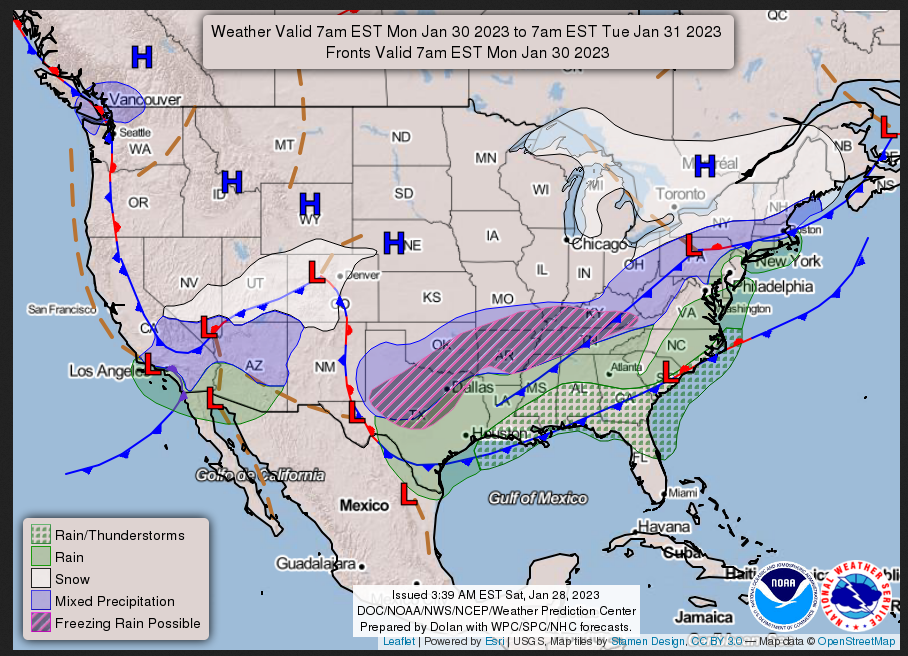
MONDAY
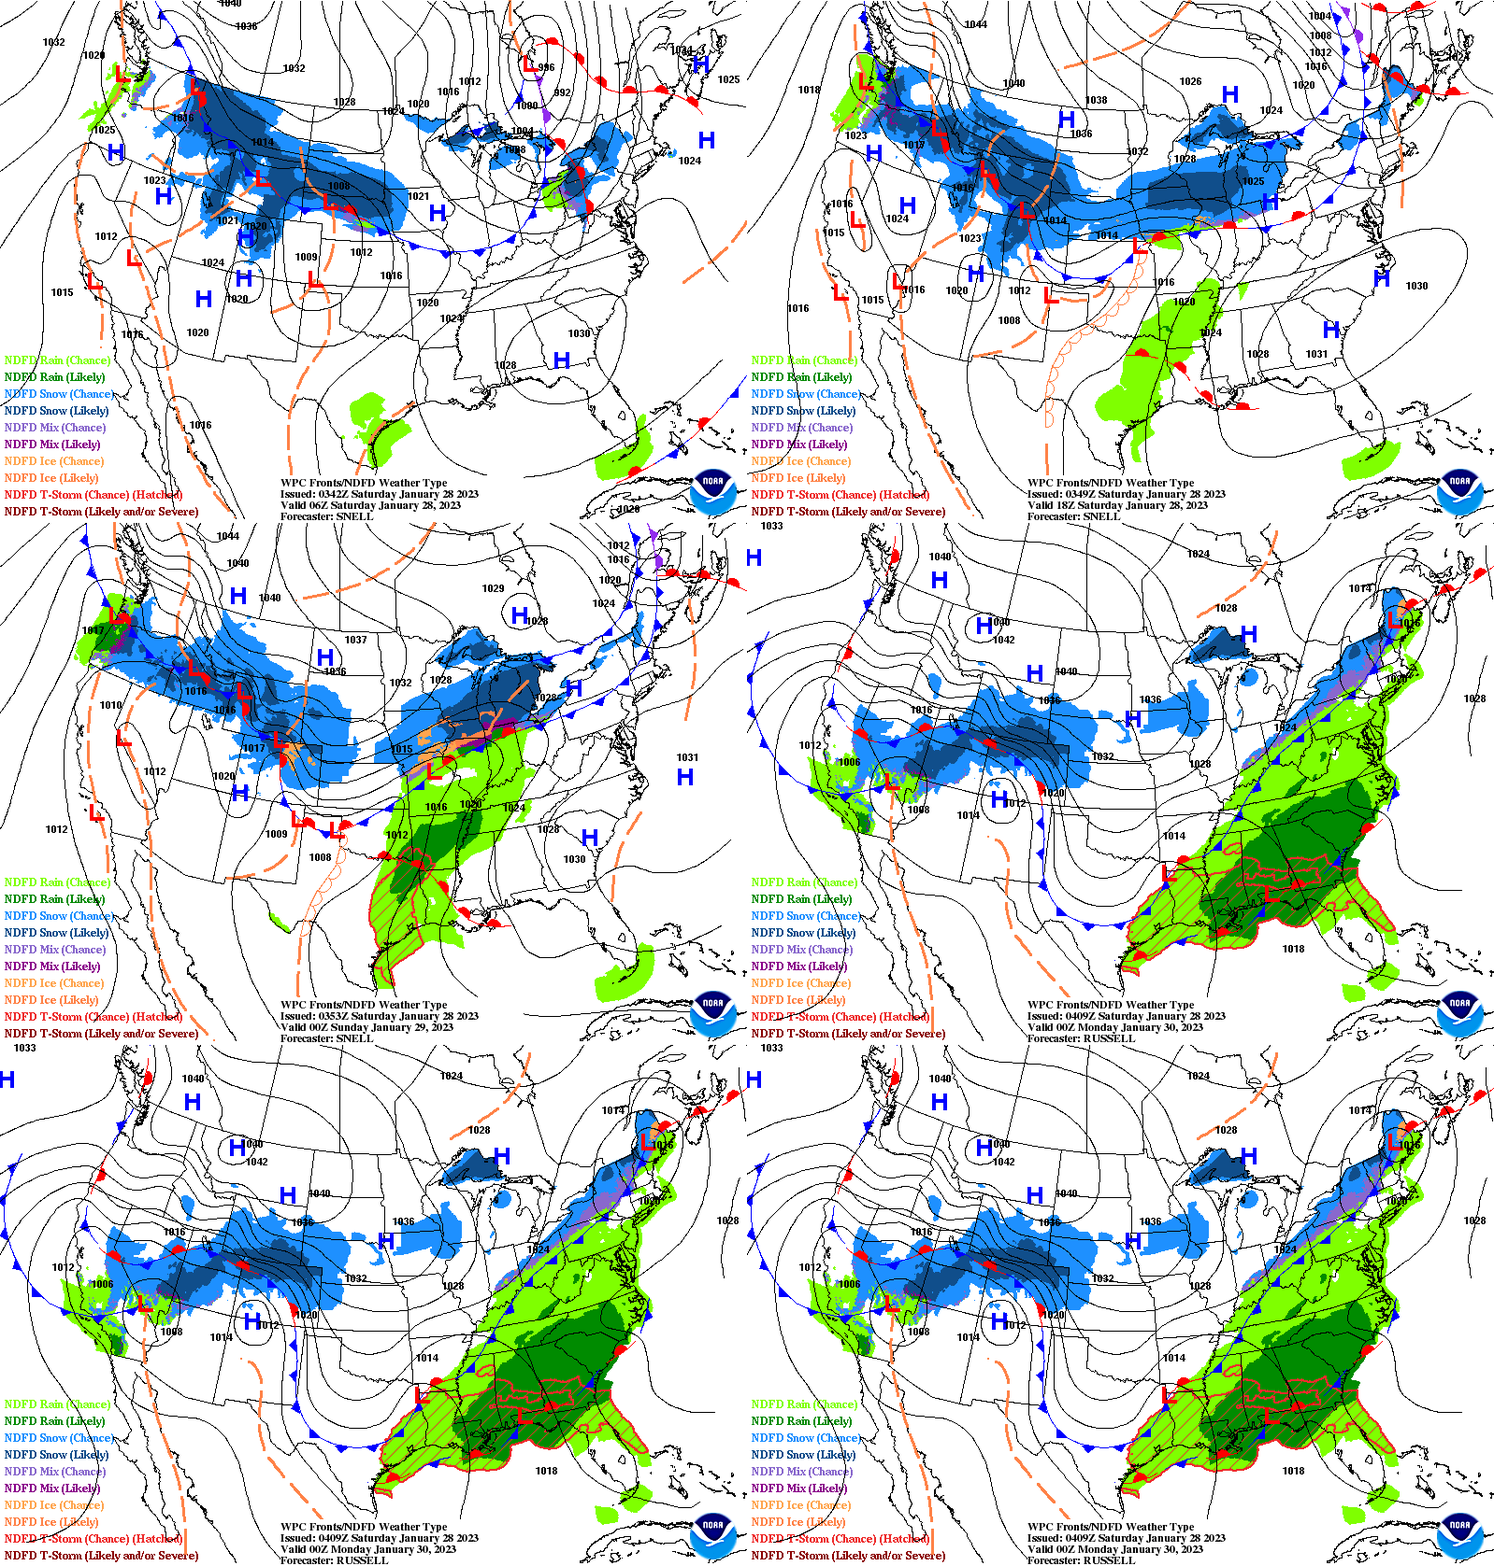
This animation shows how things may play out over the next 60 hours. To update click here.
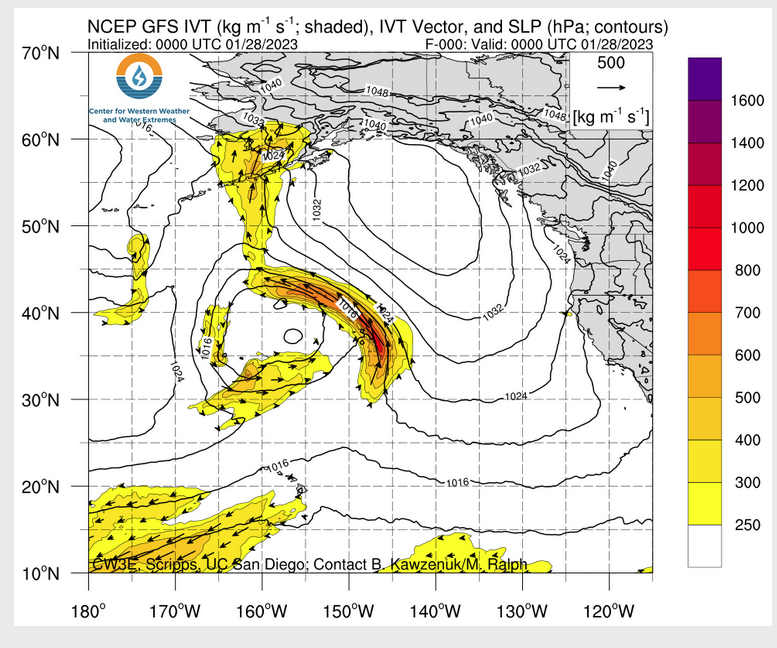
ATMOSPHERIC RIVERS
Continuation of the NWS Short Range Forecast (It is updated by NWS twice a day and these updates can be found here. We post at least one of those updates daily, sometimes both. The Highlights are shown in the lede paragraph of this article.
A wave of low pressure over the Middle Mississippi Valley will move
northeastward to off Northern New England Coast by Monday evening. North
of the low, snow will develop over parts of the Middle Mississippi Valley
on Saturday evening. Moderate to heavy snow will develop over parts of the
Great Lakes overnight Saturday. On Sunday, light to moderate snow will
develop over parts of Northern New England and northern New York State.
Light snow will continue over the Great Lakes, especially downwind from
the lakes, on Sunday, too.

In addition, moisture from the Gulf of Mexico will stream northward over
the Western Gulf Coast/Lower Mississippi Valley into the Ohio Valley. The
moisture will produce rain and embedded thunderstorms over parts of the
Western Gulf Coast and Lower Mississippi Valley from Saturday evening into
early Sunday. Rain will develop over parts of the Middle Mississippi
Valley that will expand into the Ohio Valley overnight Saturday into
Sunday. The rain will then expand into parts of the Northeast and
Mid-Atlantic on Sunday afternoon.

Along the rain/snow line, pockets of light rain/freezing rain will develop
from the Middle Mississippi Valley into the Great Lakes from Saturday
evening into Sunday evening. On Monday, light snow will continue over
parts of the Northeast into the Central Appalachians. The snow will result
in reduced visibility and the snow/ice will produce hazardous driving
conditions.

Meanwhile, cold high pressure over the Northern Plains will move southward
to the Central Plains by Monday. The cold air will bring temperatures 15
to 35 degrees below average over parts of the Northern/Central Rockies and
High Plains. As the cold air moves southward, the pockets of rain/Freezing
rain will extend from parts of the Southern Plains into the Ohio Valley
from Sunday evening into Monday.

Furthermore, the moisture will aid in producing showers and thunderstorms
with heavy rain over parts of the Western/Central Gulf Coast and part of
the Southeast on Sunday. Therefore, the WPC has issued a Slight Risk of
excessive rainfall with these thunderstorms over the region from Sunday
into Monday morning. The associated heavy rain will create mainly
localized areas of flash flooding, with urban areas, roads, and small
streams the most vulnerable.

Additionally, some of the thunderstorms will be strong to severe.
Therefore, the SPC has issued a Marginal Risk of severe thunderstorms over
parts of the Western/Central Gulf Coast and part of the Southeast from
Sunday into Monday morning. The hazards associated with these
thunderstorms are frequent lightning, severe thunderstorm wind gusts,
hail, and a few tornadoes. The threat of excessive rainfall and severe
thunderstorms ends on Monday.

Moreover, an upper-level low will develop over Northern California on
Sunday and move southward to Southern California and Northwestern Mexico
by Monday evening. A front associated with the energy will also move
southward from the Pacific Northwest to the Southwest by Monday evening.
The system will produce coastal rain and higher-elevation snow over the
Pacific Northwest on Saturday evening into Sunday morning. The coastal
rain and higher-elevation snow will move into California on Sunday.
Furthermore, snow will develop over parts of the Northern Intermountain
Region and Northern Rockies from Saturday evening into Sunday morning. On
Sunday, the snow will move into the Great Basin and Central Rockies and
parts of the Southwest on Monday. The snow will result in reduced
visibility and hazardous driving conditions.
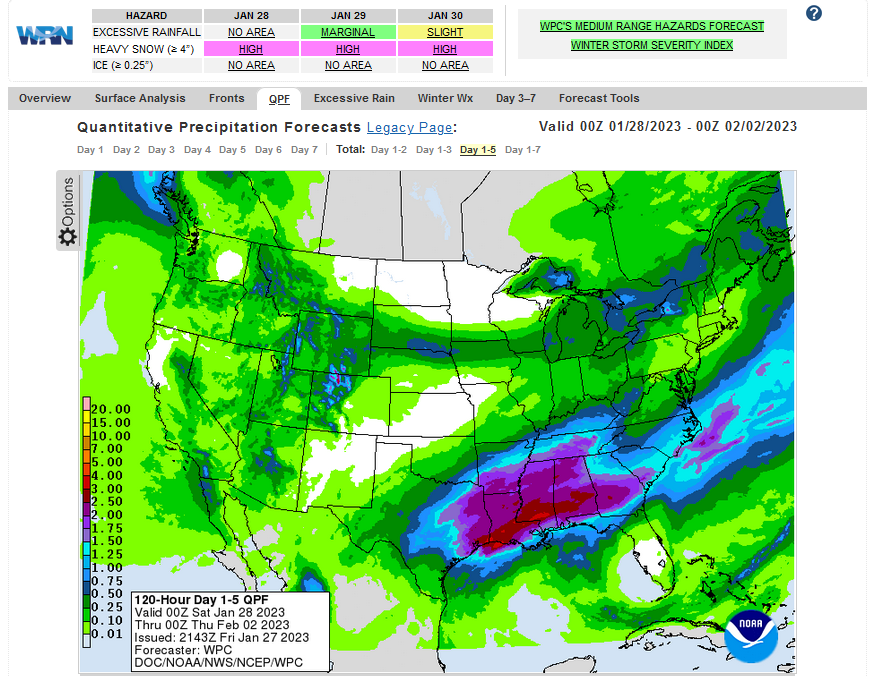
Below is the current five-day cumulative forecast of precipitation (Updates can be found HERE)
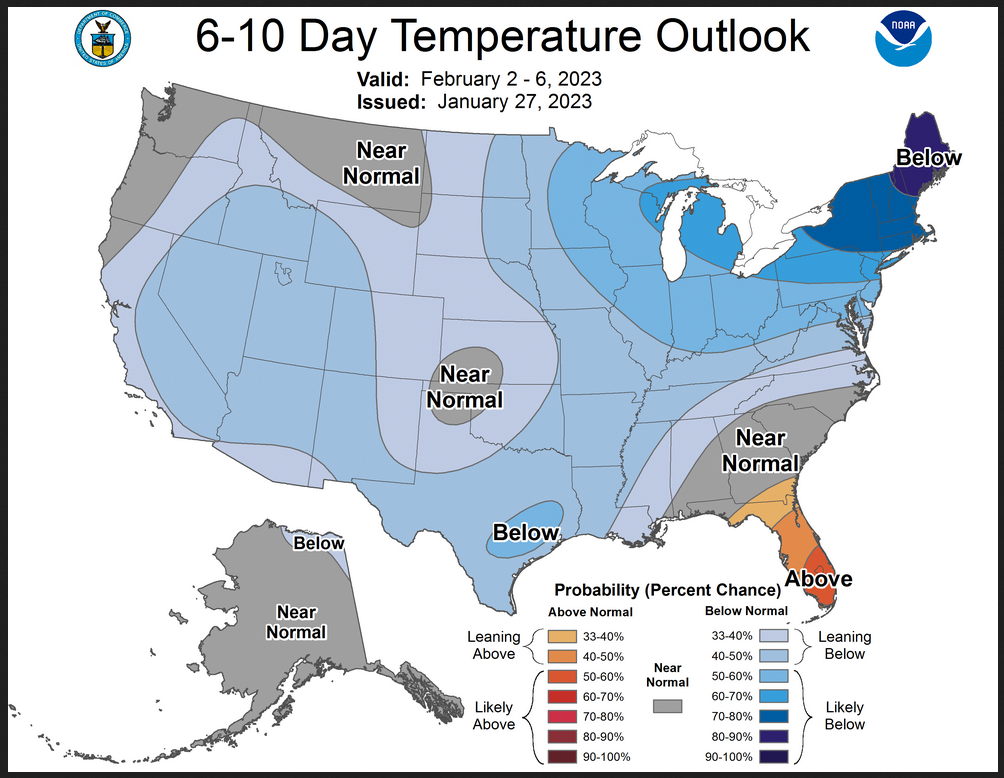
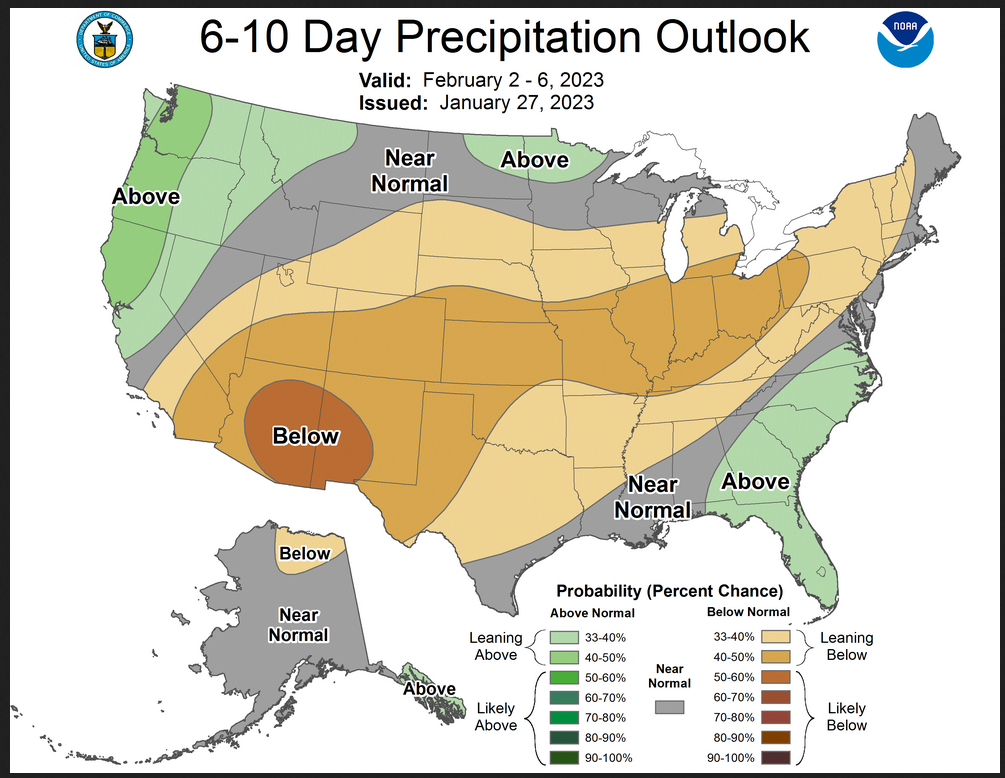
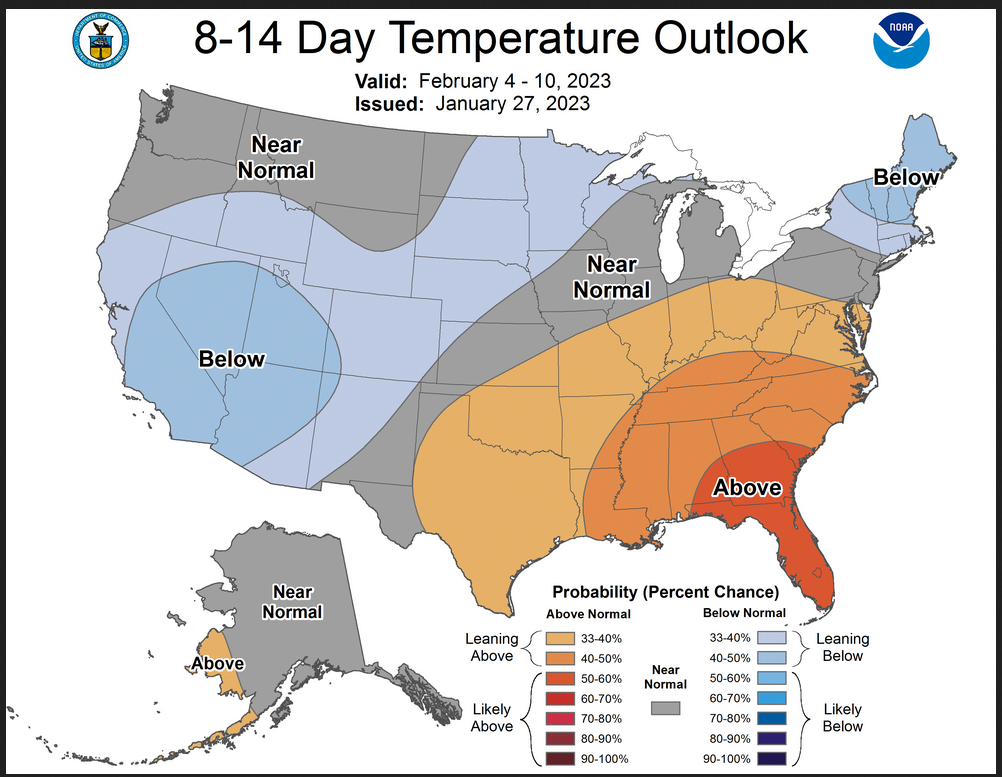
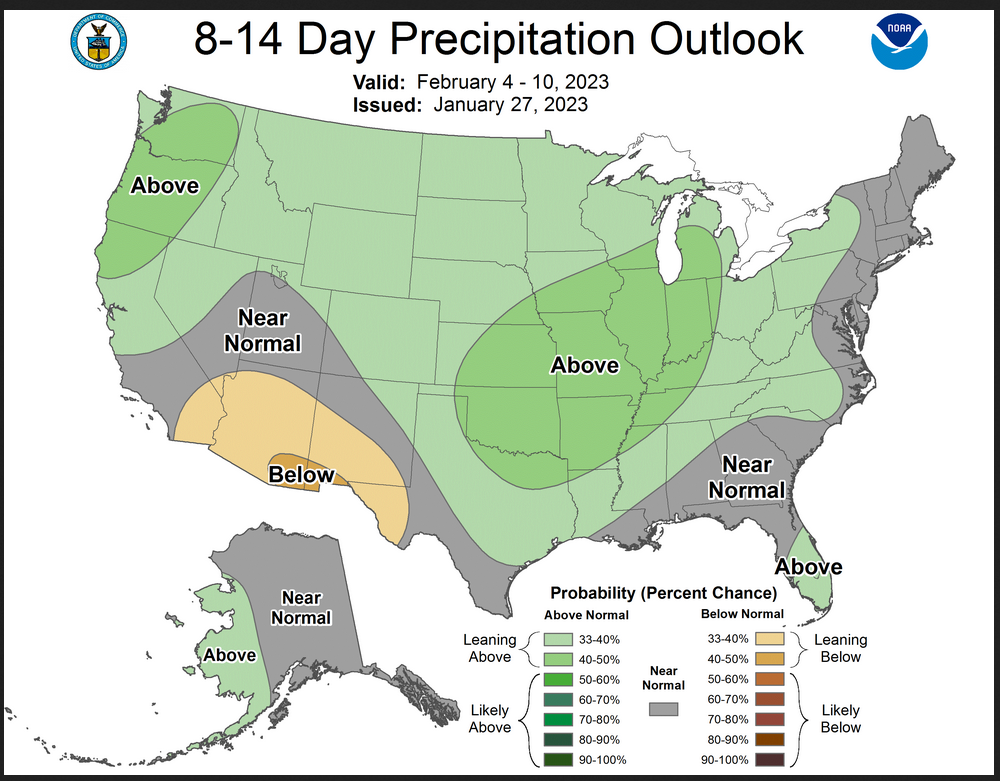
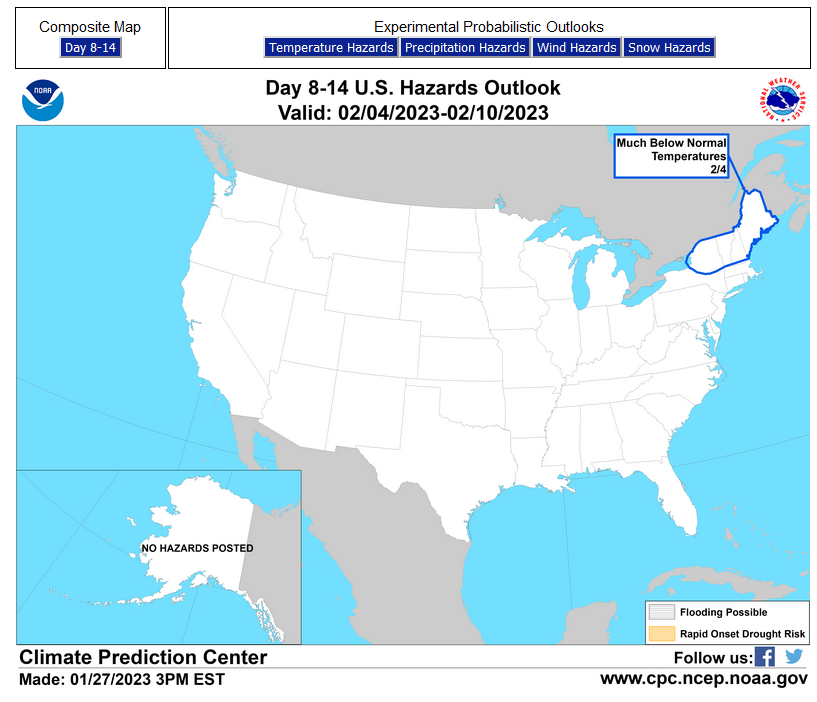
Now we look at Intermediate-Term “Outlook” maps for three time periods. Days 6 – 10, Days 8 – 14, and Weeks 3 and 4. An outlook differs from a forecast based on how NOAA uses these terms in that an “outlook” presents information as deviation from normal and the likelihood of these deviations.
Below are the links to obtain updates and additional information. They are particularly useful if you happen to be reading this article significantly later than when it was published. I always try to provide readers with the source of the information in my articles.
6 – 10 DAY
8 – 14 DAY
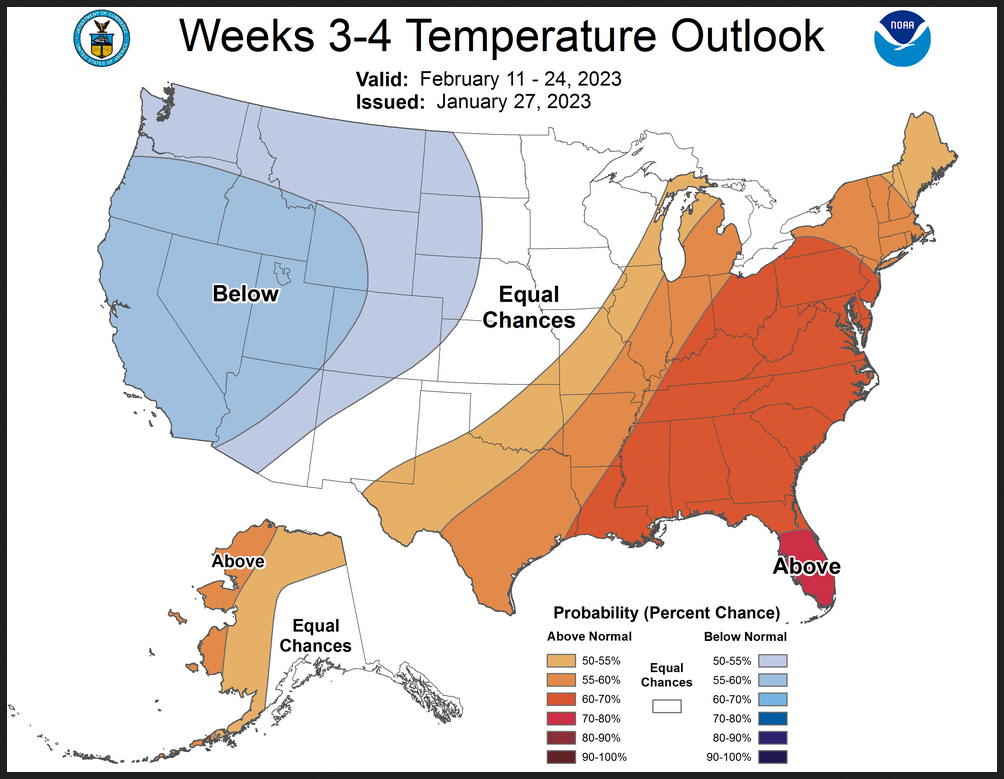
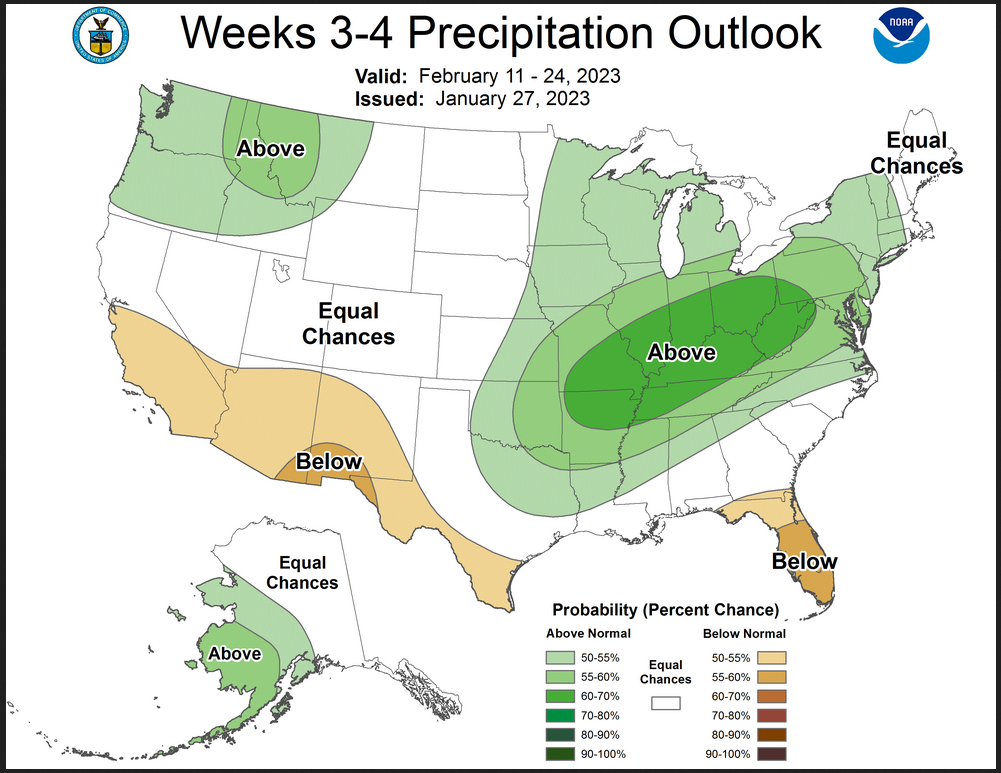
Week 3 – 4
Week 3-4 Forecast Discussion Valid Sat Feb 11 2023-Fri Feb 24 2023
Over the tropical Pacific, La Niña persists but is weakening toward ENSO neutral. Sea surface temperature anomalies in all NINO regions have all warmed substantially since November 2022. Thus, while La Niña teleconnections will still likely impact the Week 3-4 outlook for February 11-24, 2023, its influence may be less pronounced than intraseasonal forcings, such as the Madden-Julian Oscillation (MJO). Examining the MJO, it has recently emerged into Real-time multivariate (RMM) phase 3 over the Indian Ocean. Dynamical and statistical model guidance from the GEFS, ECMWF, and Linear Inverse Model (LIM) all depict a propagating MJO through RMM phases 3, 4, 5, 6, and 7 over the coming few weeks. In fact, given that La Niña is currently weakening, the prior-90-day mean removal used to calculate the RMM indices may not be ideal. This negatively impacts RMM1 in particular (phases 4 and 5 over the Maritime Continent), which is where the MJO can constructively interfere with La Niña. Thus, RMM1 is likely more positive than what is shown on the Wheeler-Hendon diagrams derived from the dynamical models and a robust, propagating MJO is likely to occur, which has the potential to impact CONUS and Alaska through its teleconnection. The likelihood of this propagation is further supported by forecasts of outgoing longwave radiation and velocity potential, which are not influenced by the idiosyncrasies of the RMM calculations.
This propagation of the MJO forces the establishment of a Rossby wave train with upper level ridging over the northeast Pacific Ocean, troughing over western CONUS, and ridging over eastern CONUS by the end of Week 2. These large-scale Rossby Waves forced by the MJO typically retrograde westward with time, which would occur during the Week 3-4 period. Further, with this propagation of the MJO, below normal upper-level heights are typically found over Greenland and the Arctic. This north-to-south trough-ridge dipole over North America is consistent with the ensemble mean forecasts by the GEFS and ECMWF that the North Atlantic Oscillation (NAO) and Arctic Oscillation (AO) will both exceed +1 standard deviations near the end of Week 2. The Pacific North American pattern (PNA) is depicted to be slightly positive near the end of Week 2, but as the trough retrogrades westward, it will likely become negative during Week 3-4, which is also consistent with La Niña background forcing. Should the MJO’s propagation continue into phases 8 and 1 along with the prior forcing from phases 5, 6, and 7, there is a possibility that troughing may try to establish over the eastern CONUS during the end of Week 4 in conjunction with the development of a negative NAO, which could lead to colder temperatures across the East and Southeast.
The dynamical model guidance from the ECMWF, GEFS, CFS, ECCC, and JMA are largely consistent with the aforementioned evolution of the pattern as forced by the MJO. Their ensemble means for the Week 3-4 period each depict anomalous ridging over the North Pacific, troughing over the western CONUS, and ridging over eastern CONUS associated with a vigorous Southeast Ridge. The greatest uncertainties exist with the axis and magnitude of the troughing over western CONUS along with the extent of the ridging into Alaska. How these two features eventually evolve will have a large impact on actual surface temperatures over central CONUS. For example, the statistical models depict broad scale warmth over the eastern two thirds of CONUS, largely associated with the MJO, whereas the dynamical models, particularly the ECMWF, are more aggressive in bringing the cold farther east into the central CONUS. This suggests the existence of a baroclinic zone stretching from Texas into the Upper Midwest/Great Lakes region where a specific location’s eventual average temperature over the Week 3-4 period will depend greatly on the exact tracks of individual synoptic-scale storms.
Thus, given the aforementioned drivers and forecast tool guidance, this Week 3-4 temperature outlook features elevated probabilities for above normal temperatures over the eastern third of CONUS from Texas to Maine with the highest probabilities in the Southeast. Below normal temperatures are most probable in the West. In the eastern Central and Northern Plains, equal chances of above or below normal temperature are depicted due to the uncertainty in that region. In Alaska, above normal temperatures are favored in the Aleutians and Western Mainland due to southwesterly flow. The North Slope is expected to be above normal as well due to longer term trends.
With respect to the Week 3-4 precipitation outlook, above normal precipitation is expected along the potential baroclinic zone from northeastern Texas to southern New England. The highest probabilities are centered in the Ohio Valley. Above normal precipitation is also favored over the Pacific Northwest and Upper Rockies with the troughing expected in that region. However, with offshore ridging in place, the trough is not expected to be strong or dig south enough to impact California with significant onshore flow. Thus, below normal precipitation is favored in central and southern California. Below normal precipitation is also probable in the Southwest, southern Texas, and Florida, which is typical for La Niña. In Alaska, the southwesterly flow provides elevated chances of above normal precipitation in the Aleutians and Western Mainland.
Finally, for Hawaii, the multi-model ensemble from SubX shows above normal temperature probabilities of over 90%, which corresponds to the above normal SSTs surrounding the islands. Above normal precipitation also appears probable, particularly in the southeastern islands.
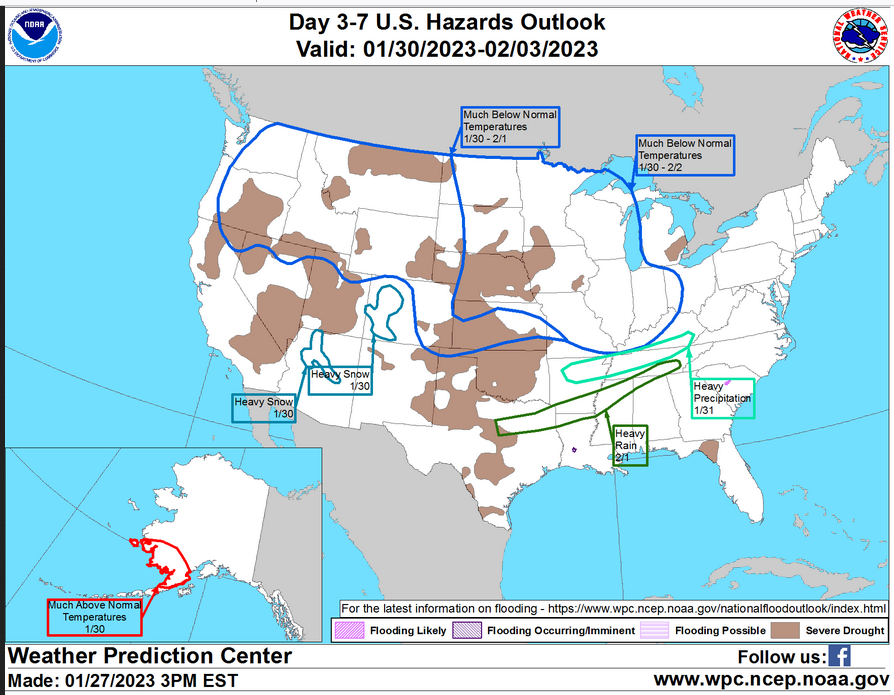
HAZARDS OUTLOOKS
Click here for the latest complete Day 3 -7 Hazards forecast which updates only on weekdays. Once a week probably Monday or Tuesday I will update the images. I provided the link for readers to get daily updates on weekdays. Use your own judgment to decide if you need to update these images. I update almost all the images Friday Night for the weekend edition of this Weather Report. So normally readers do not need to update these images but if the weather is changing quickly you may want to.
Month to Date Information
Temperature month to date can be found at https://hprcc.unl.edu/products/maps/acis/MonthTDeptUS.png
Precipitation month to date can be found at https://hprcc.unl.edu/products/maps/acis /MonthPNormUS.png
World Forecast
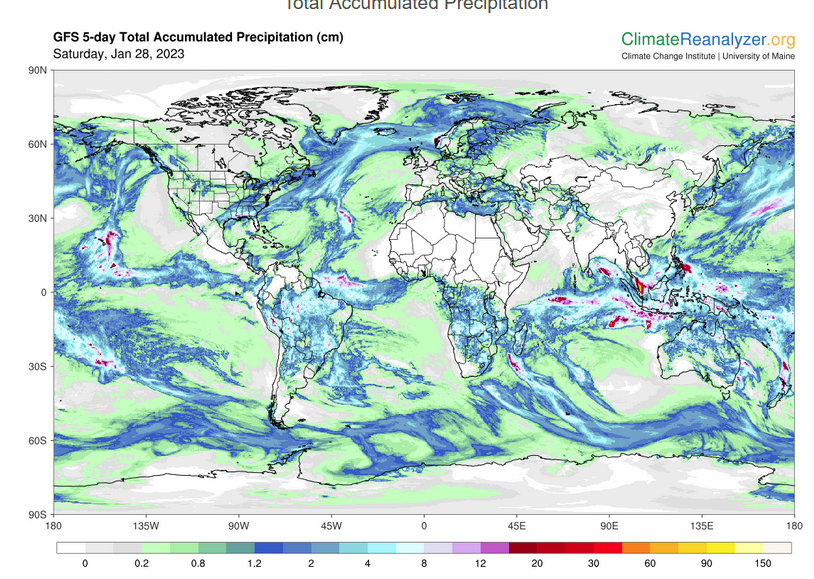
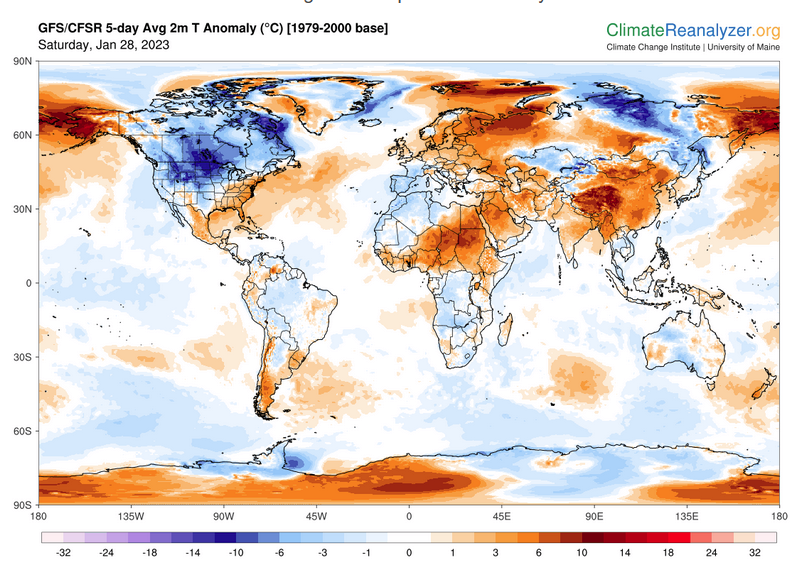
Below are the 5-Day forecasts for temperature and precipitation. Updates and much additional information can be obtained HERE
This information is provided by the University of Maine. They draw upon many different sources. There is a lot of information available at the link provided. I have just provided two useful forecasts. There are probably over a hundred different forecasts available from this source.
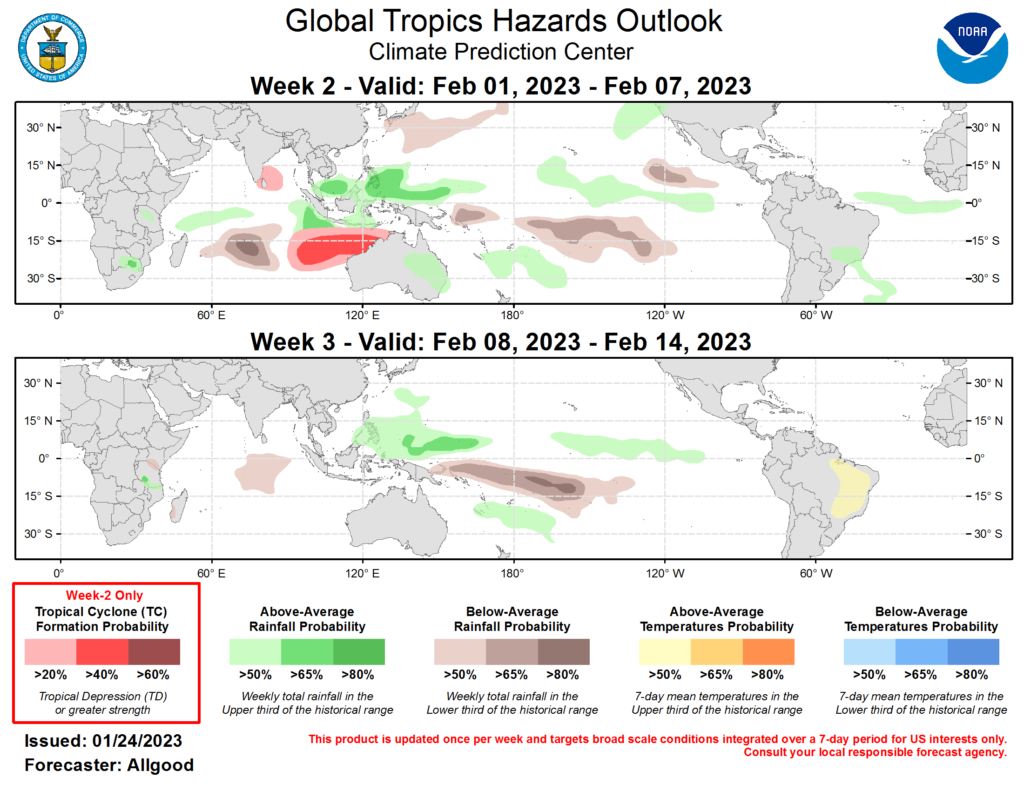
Worldwide Tropical Forecast (This is a NOAA Product)
This graphic updates on Tuesdays) If it has not been updated, you can get the update by clicking here Readers will only have to do that if they are reading this article much later than the date of it being published.-
| I hope you found this article interesting and useful. |
