Updated at 7:40 p.m. EST Monday, January 2, 2023

Here is what we are paying attention to in the next 48 to 72 hours from Monday afternoon’s NWS Forecast. This is a combination of a U.S. plus World Weather Article. We have also incorporated much of what we normally issue on Friday Night which is basically the same report but with more images displayed rather than simply providing the links to make it easier for readers to look ahead 28 days. Saturday NOAA issued their End of Month Report which includes the updated outlook for January 2023. We want to feature that over the weekend so we have provided a link in the NOAA End of Month Article back to this article so those readers can visit this article to get the short-term weather forecasts.
We start with the U.S. Information.
Short Range Forecast Discussion
NWS Weather Prediction Center College Park MD
300 PM EST Mon Jan 02 2023
Valid 00Z Tue Jan 03 2023 - 00Z Thu Jan 05 2023
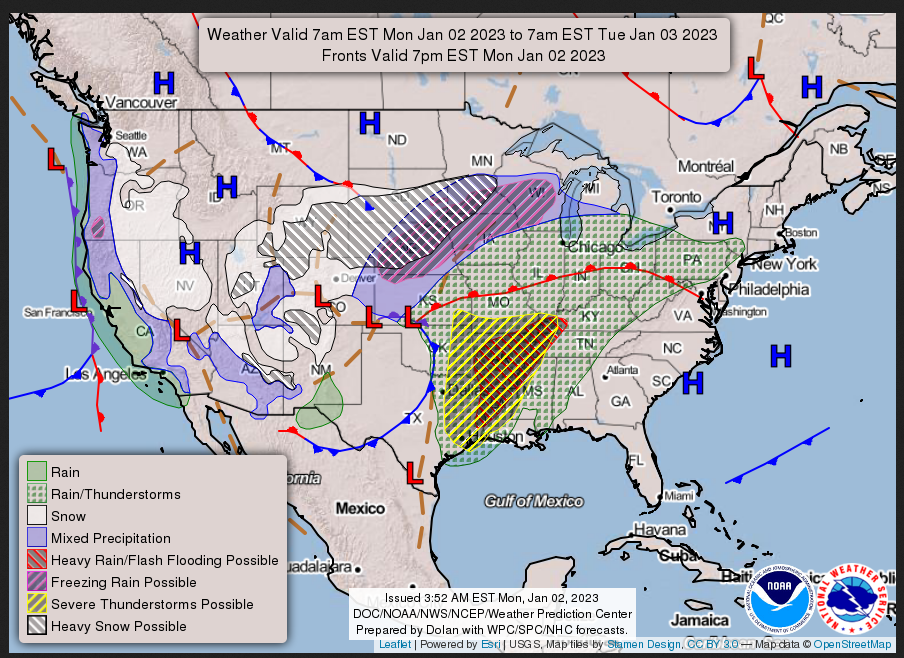
...A low pressure system is bringing heavy snow and ice across the
northern Plains to the upper Midwest as well as heavy rain and severe
weather across the South through the next couple of days...
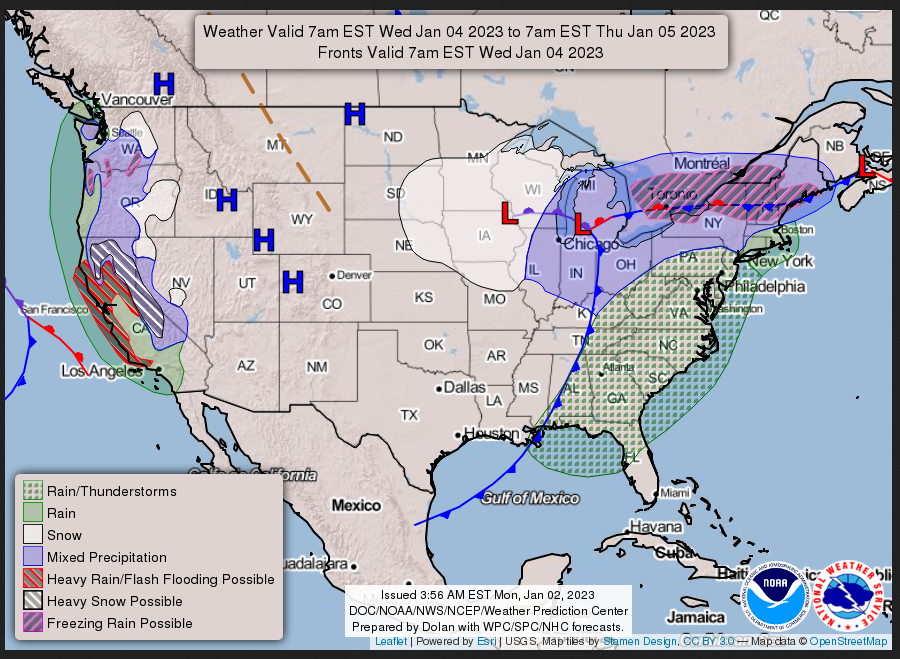
...Unsettled weather continues along the West Coast with the next round of
heavy precipitation reaching northern California later on Wednesday...
First, the 48-Hour Forecast (It is a 48 to 72 Hour Forecast actually)
Daily weather maps
MONDAY
TUESDAY
WEDNESDAY
I try to keep the above maps updated. They only update twice a day and in some cases once a day.
I will be doing the updating during the period described in the title of the article but if you happen to read this article later you can get updates by clicking HERE .
This animation shows how things may play out over the next 60 hours. To update click here.
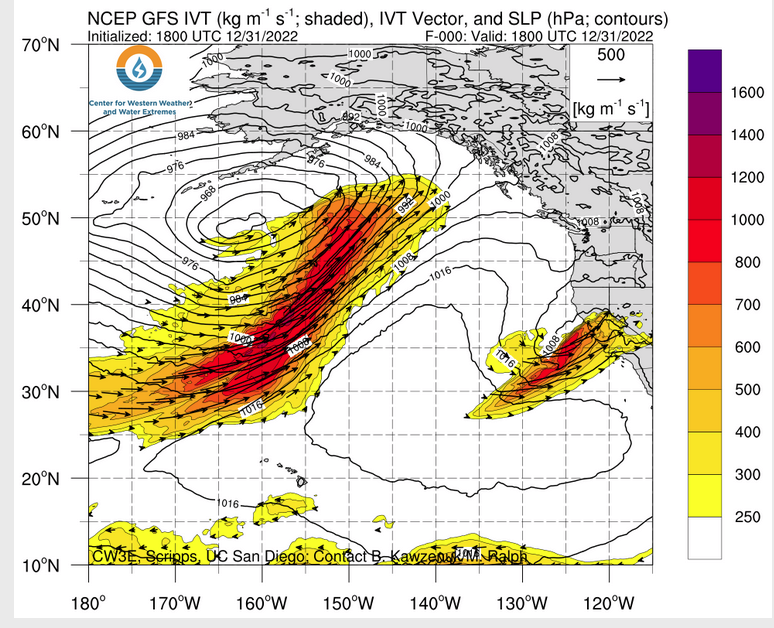
ATMOSPHERIC RIVERS
Continuation of the NWS Short Range Forecast (It is updated by NWS twice a day and these updates can be found here. We post at least one of those updates daily, sometimes both. The Highlights are shown in the lede paragraph of this article.
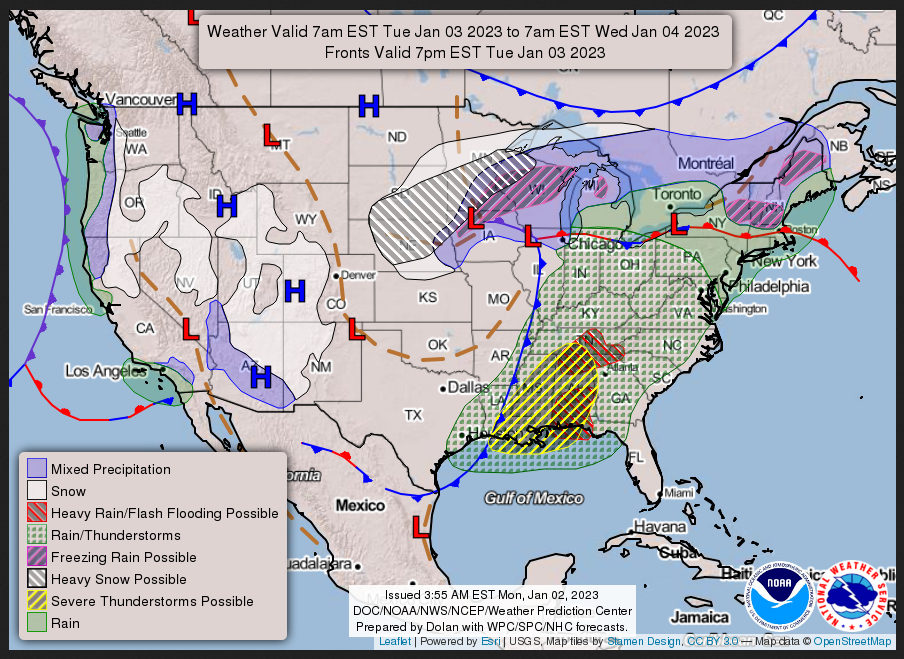
A low pressure system currently developing over the central High Plains
will become the latest winter storm to impact areas from the northern to
central High Plains through the upper Midwest during the next couple of
days.  A swath of moderate to heavy snow is forecast across the northern
half of this general area where highest snowfall amounts could exceed 18
inches.  Meanwhile, a swath of freezing rain and mixed precipitation is
expected across the southern half of this area where highest ice accretion
can exceed a quarter of an inch.  Winds are expected to increase as the
low pressure center tracks across as well but they are not expected to be
excessively strong as the main energy associated with the system is
forecast to be sheared to the east, leading to a gradual weakening of the
storm by Tuesday night.  Nevertheless, heavy snow and gusty winds will
result in reduced visibility and difficult to hazardous travel conditions
in snow-covered roads across the central to northern Plains as the storm
intensifies tonight into Tuesday.

Meanwhile, heavy rain and severe weather will continue to be the main
story across the mid-South through tonight ahead of a strong cold front
trailing south from the intensifying low pressure system.  The hazards
associated with these thunderstorms are frequent lightning, severe
thunderstorm wind gusts, hail, and a few tornadoes. There will also be an
increased threat of EF2-EF5 tornados over the region.  By Tuesday, the
heavy rain and severe weather threats will shift progressively east into
the eastern Gulf Coast states and perhaps farther inland toward the
Tennessee Valley as the cold front pushes eastward.  These threats are
expected to be slightly lessened on Tuesday.  In the mean time, wet
weather will spread northeast into New England on Tuesday with mixed
precipitation possible over northern Maine.  By Wednesday, much of the
East Coast will be under a good chance of showers and thunderstorms but
areas west of the Appalachians will see rapidly improving weather behind
the cold front.  Ahead of the front, temperatures will be 15 to 25 degrees
above average before colder air arrives behind the front.

Over the western U.S., more unsettled weather is in store as a very active
weather pattern continues to direct strong storm systems from the Pacific
toward the West Coast.  The current wave of moderate to heavy
precipitation up and down the West Coast will catch a break across
California by Tuesday but will linger near the Pacific Northwest coast.
However, a large and powerful Pacific cyclone brewing in the Pacific is
forecast to bring the next episode of heavy precipitation toward the West
Coast on Wednesday.  The heaviest precipitation is forecast to reach
northern California by Wednesday afternoon.
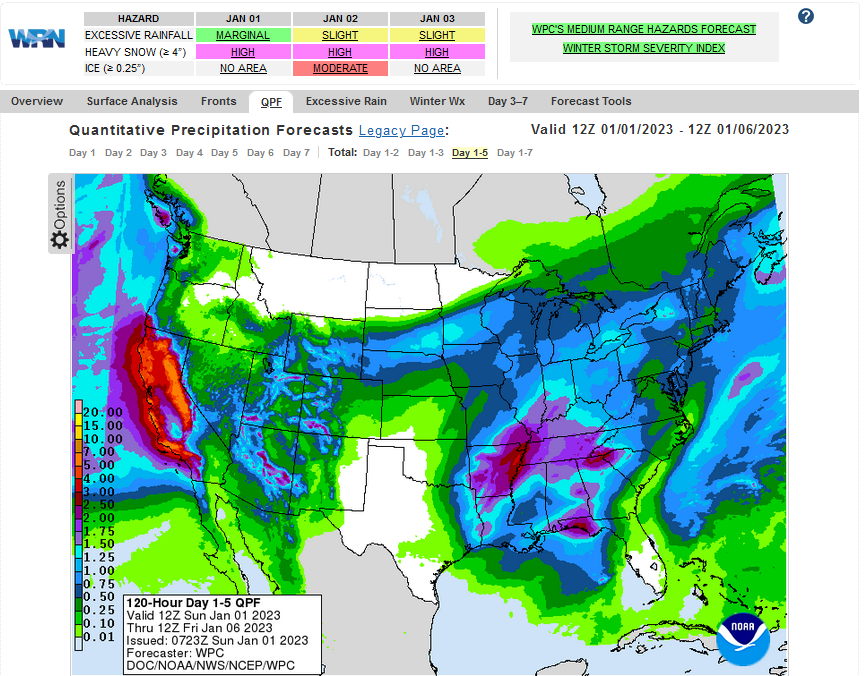
Below is the current five-day cumulative forecast of precipitation (Updates can be found HERE)
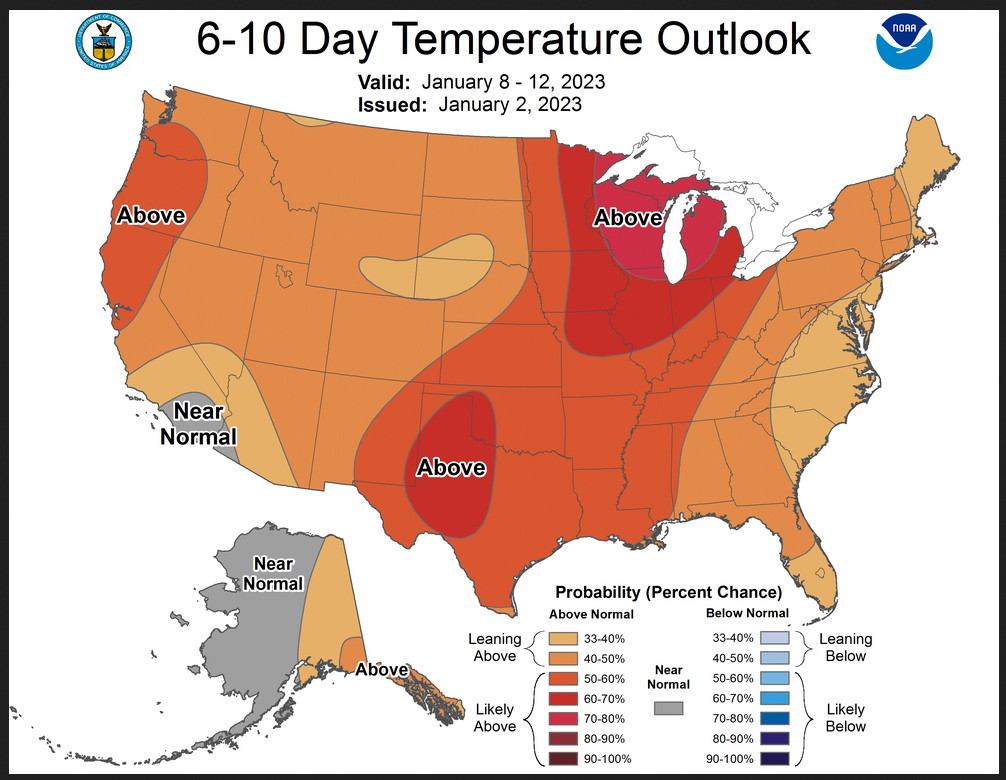
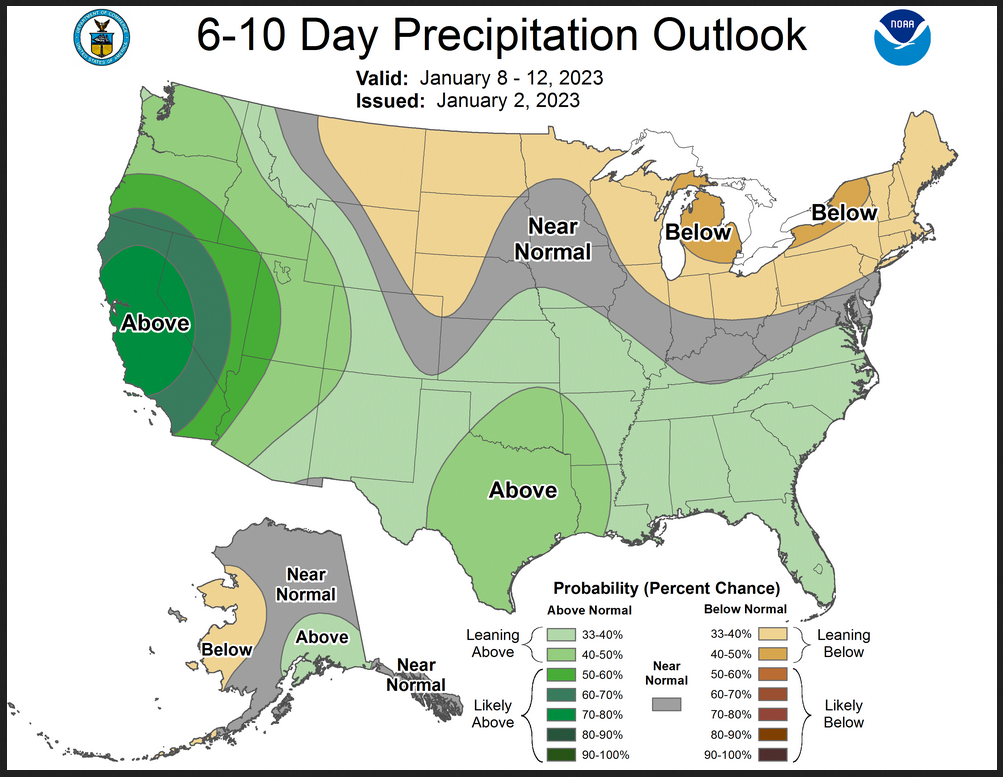
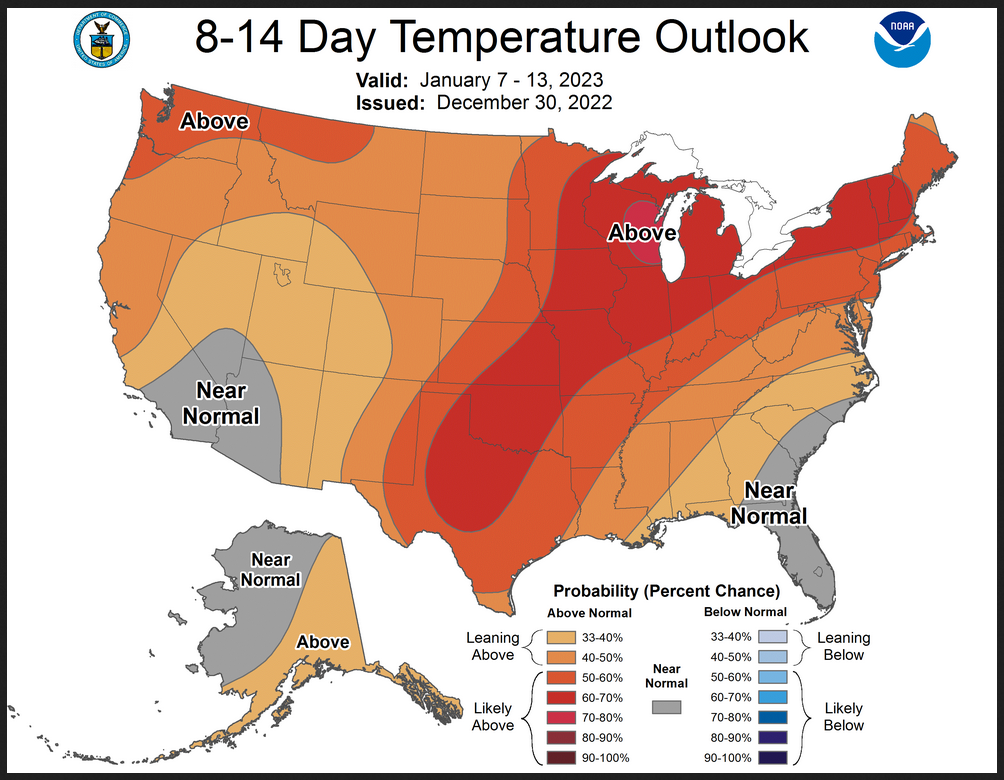
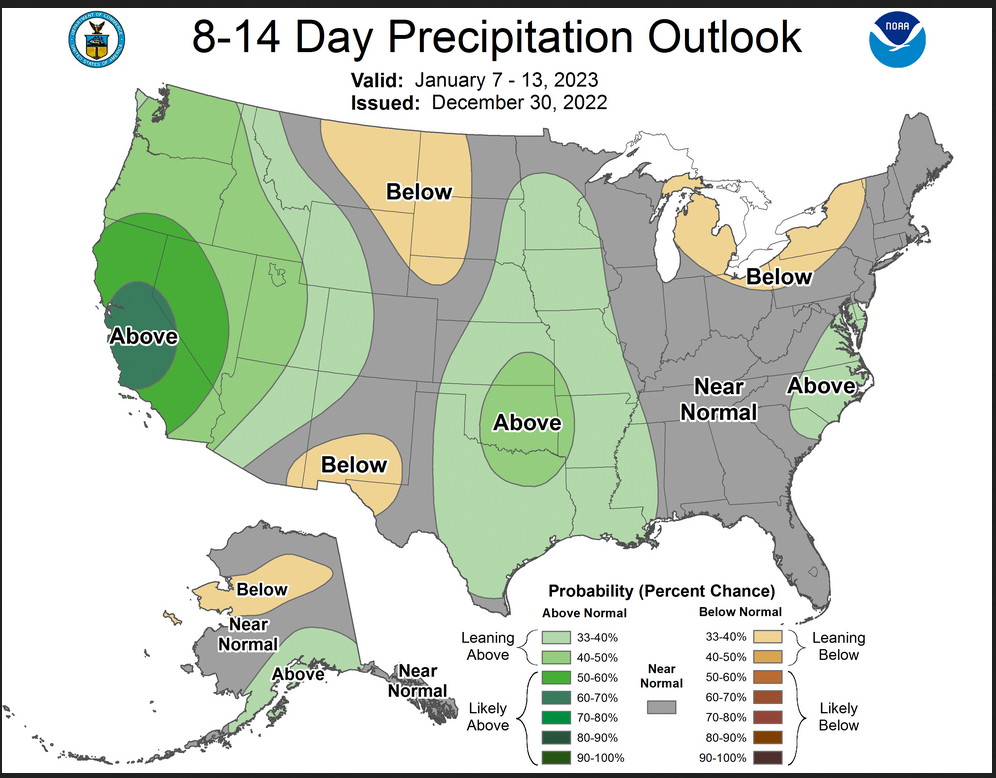
Now we look at Intermediate-Term “Outlook” maps for three time periods. Days 6 – 10, Days 8 – 14, and Weeks 3 and 4. An outlook differs from a forecast based on how NOAA uses these terms in that an “outlook” presents information as deviation from normal and the likelihood of these deviations.
Below are the links to obtain updates and additional information. They are particularly useful if you happen to be reading this article significantly later than when it was published. I always try to provide readers with the source of the information in my articles.
–
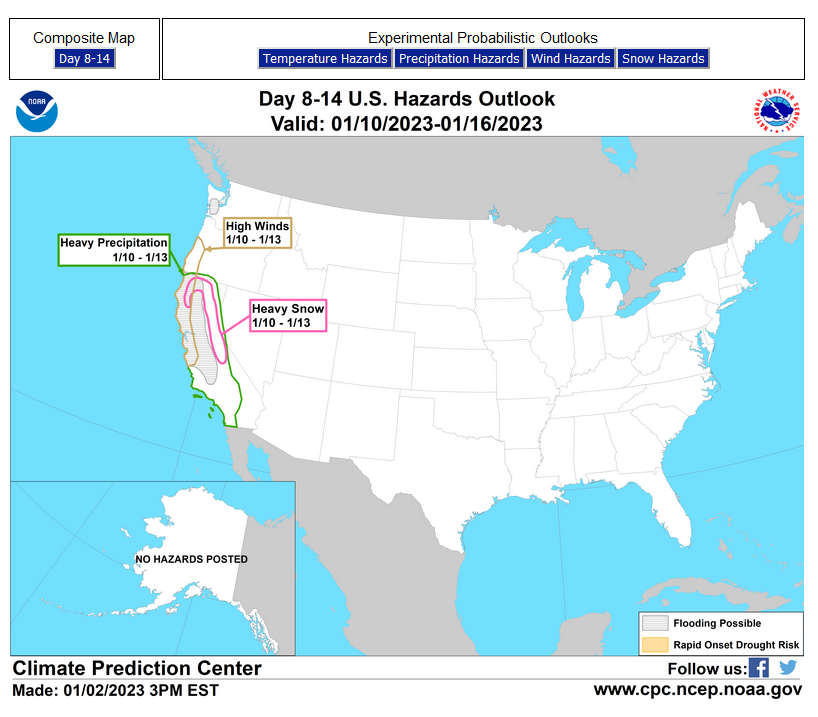
Days 8 – 14
–
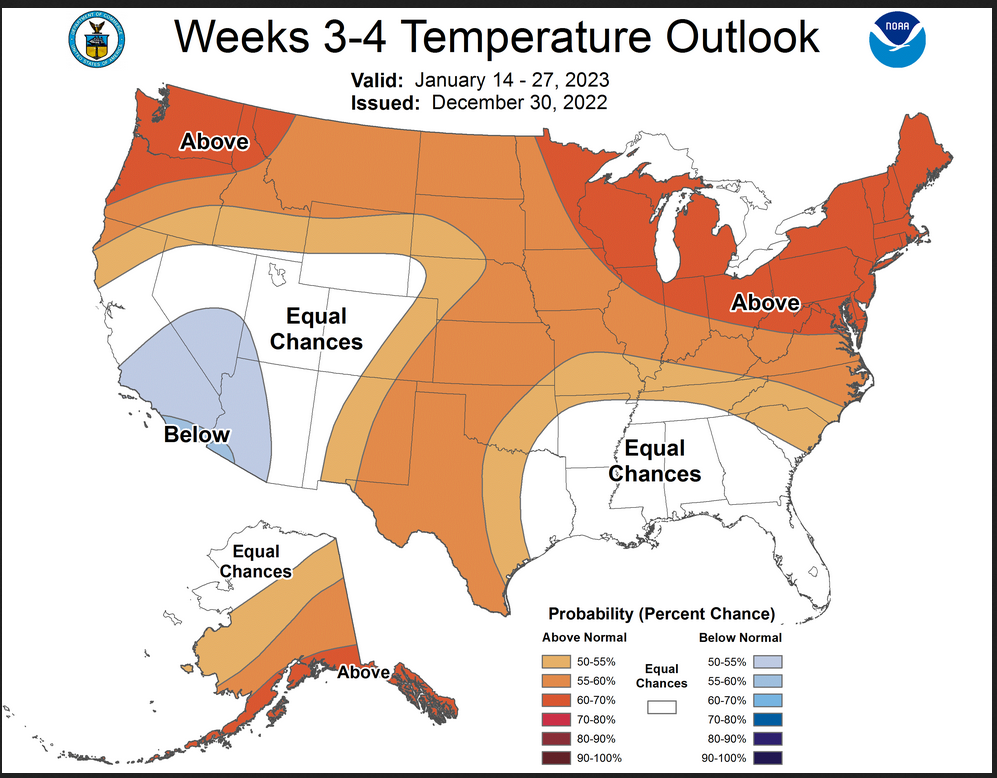
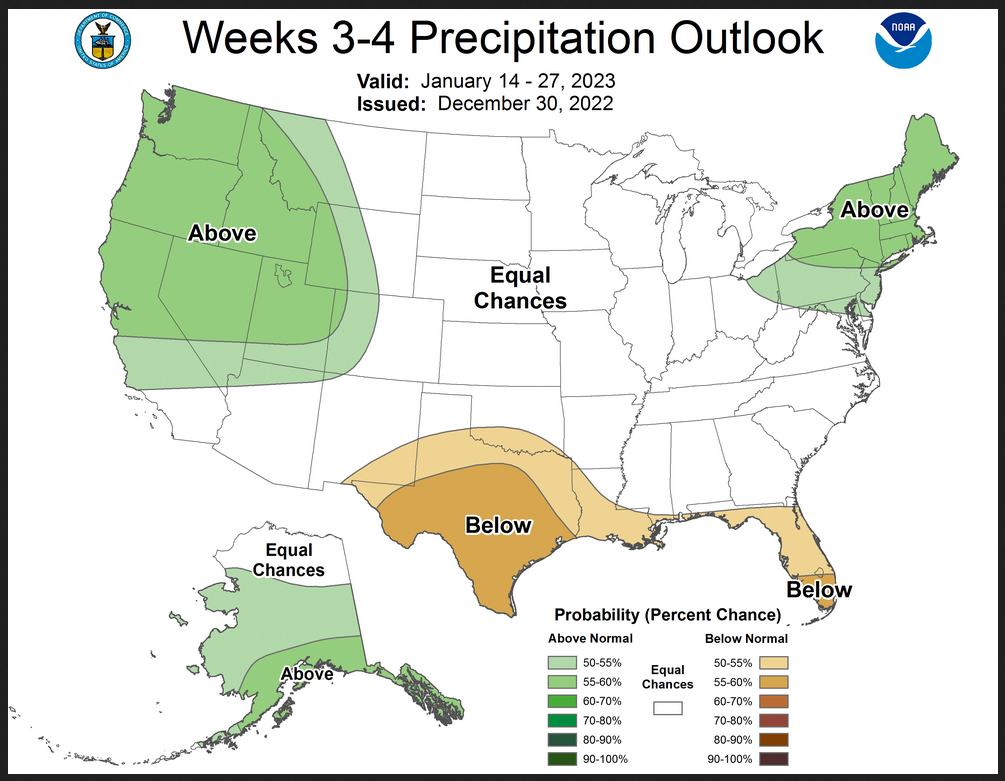
Weeks 3 – 4
–
Discussion Released with Week 3 – 4 Outlook
Prognostic Discussion for Week 3-4 Temperature and Experimental Precipitation Outlooks
NWS Climate Prediction Center College Park MD
300PM EST Fri Dec 30 2022Week 3-4 Forecast Discussion Valid Sat Jan 14 2023-Fri Jan 27 2023
While La Niña remains the primary driver of tropically driven climate conditions, the Madden-Julian Oscillation (MJO) is currently active in phase 6, based on the real-time multivariate MJO (RMM) index, with convection over the Western Pacific. Dynamical models forecast the MJO to remain active and propagate eastward, although there is significant spread among ensemble members and uncertainty in the timing and strength of the MJO. Composites and regression models based on the current state of the MJO and La Niña indicate potential impacts on subseasonal climate variability over North America through the Week 3-4 Outlook period. The impacts of the MJO may result in enhanced negative 500-hPa height anomalies over the north-central and northeastern CONUS, as indicated by lagged MJO composites and some dynamical models including the ECMWF ensemble mean. The multivariate linear regression (MLR) and linear inverse model (LIM) temperature tools indicate a potential for decreasing temperatures from the north-central CONUS southeastward, if the MJO impacts the circulation pattern. However, due to uncertainty in the MJO forecast and resulting impacts occurring later in the Week 3-4 Outlook period, MJO impacts were incorporated into the forecast only to the extent that they appear in the manual blend of operational dynamical and statistical forecast tools.
The ECMWF, Canadian, and GEFS operational ensemble mean forecasts for week 3 are relatively consistent in predicting negative 500-hPa height anomalies centered near the Aleutian Islands, positive 500-hPa height anomalies over the western and northern CONUS, and a negative 500-hPa height anomaly center over the southeastern CONUS. Models increasingly diverge on the 500-hPa height forecast for week 4 but show an overall tendency towards negative 500-hPa height anomalies over the northeastern CONUS, particularly in the ECMWF and GEFS ensemble means. The Week 3-4 Outlook is based on a blend of dynamical model and statistical model forecast tools. The manual blend indicates a trough with negative 500-hPa height anomalies centered over the Aleutians and a ridge and associated positive 500-hPa height anomalies over the western CONUS. Slightly negative mid-level height anomalies are predicted from the Southwest across the southern CONUS, associated with a trough over the eastern CONUS. Slightly positive mid-level height anomalies are indicated over parts of the Northeast in the manual blend of mid-level height forecasts. This predicted circulation pattern is consistent with the MME forecast from the Subseasonal Experiment (SubX).
Above normal temperatures are likely for the Aleutians, southern Mainland Alaska, and the Alaska Panhandle, consistent with the CFS, ECMWF, GEFS, and SubX MME temperature forecasts. Likely above normal temperatures are predicted across the northern tier of the CONUS, under positive 500-hPa height anomalies in the week 3 dynamical model forecasts. Negative mid-level height anomalies over the Southeast through much of the Week 3-4 Outlook period support a forecast of equal chances (EC) of above and below normal temperatures. Above normal temperatures are favored for much of the Southern and Central Plains as well, as indicated by the manual blend temperature forecast for week 3-4, particularly in week 3. Below normal temperatures are slightly favored for parts of the Southwest into the Great Basin, as indicated by most dynamical model temperature tools.
Southerly flow across the Alaska Mainland and onshore flow into the Alaska Panhandle favor above median precipitation. Probabilities of above median precipitation are increased across much of the western CONUS, ahead of enhanced onshore flow into the Pacific Northwest early in the period and into the central Pacific coast later in the Week 3-4 Outlook period. Above median precipitation is also favored for much of the Northeast, ahead of the predicted trough, as indicated by the manual blend of precipitation forecast tools, particularly for week 3. Below median precipitation is favored for the Southern Plains and along the Gulf Coast into Florida, as indicated by the Subsampling precipitation forecast tool and the SubX MME forecast.
Operational dynamical models and the SubX MME predict likely positive 500-hPa height anomalies over the Hawaiian Islands during the Week 3-4 Outlook period favoring below median precipitation for Hawaii. Above average sea surface temperatures and the predicted positive 500-hPa height anomalies favor above normal temperatures for Hawaii.
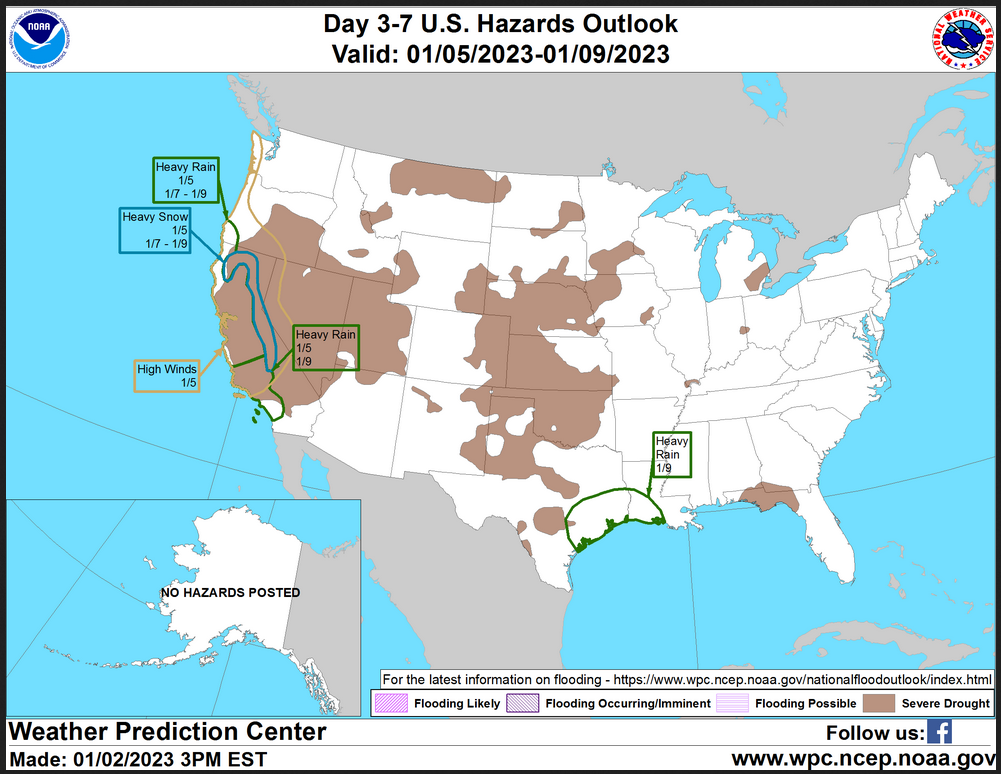
HAZARDS OUTLOOKS
Click here for the latest complete Day 3 -7 Hazards forecast which updates only on weekdays. Once a week probably Monday or Tuesday I will update the images. I provided the link for readers to get daily updates on weekdays. Use your own judgment to decide if you need to update these images. I update almost all the images Friday Night for the weekend edition of this Weather Report. So normally readers do not need to update these images but if the weather is changing quickly you may want to.
Month to Date Information
Temperature month to date can be found at https://hprcc.unl.edu/products/maps/acis/MonthTDeptUS.png
Precipitation month to date can be found at https://hprcc.unl.edu/products/maps/acis /MonthPNormUS.png
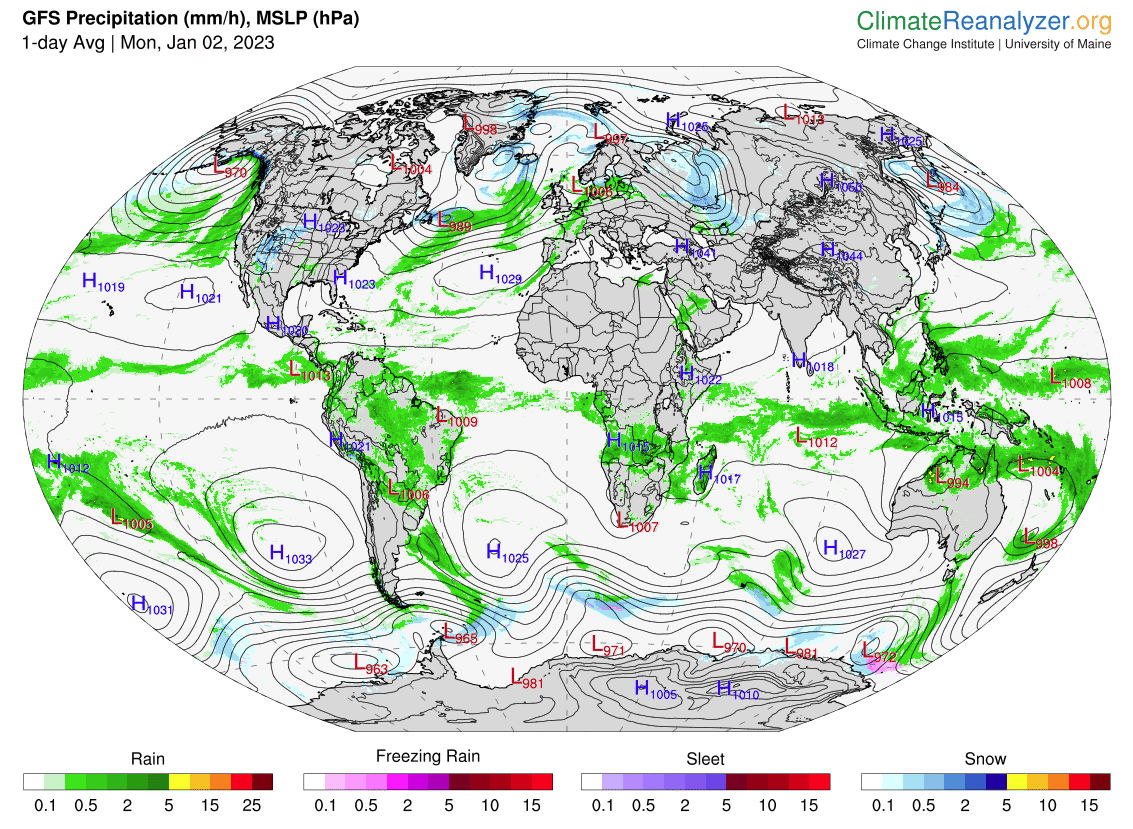
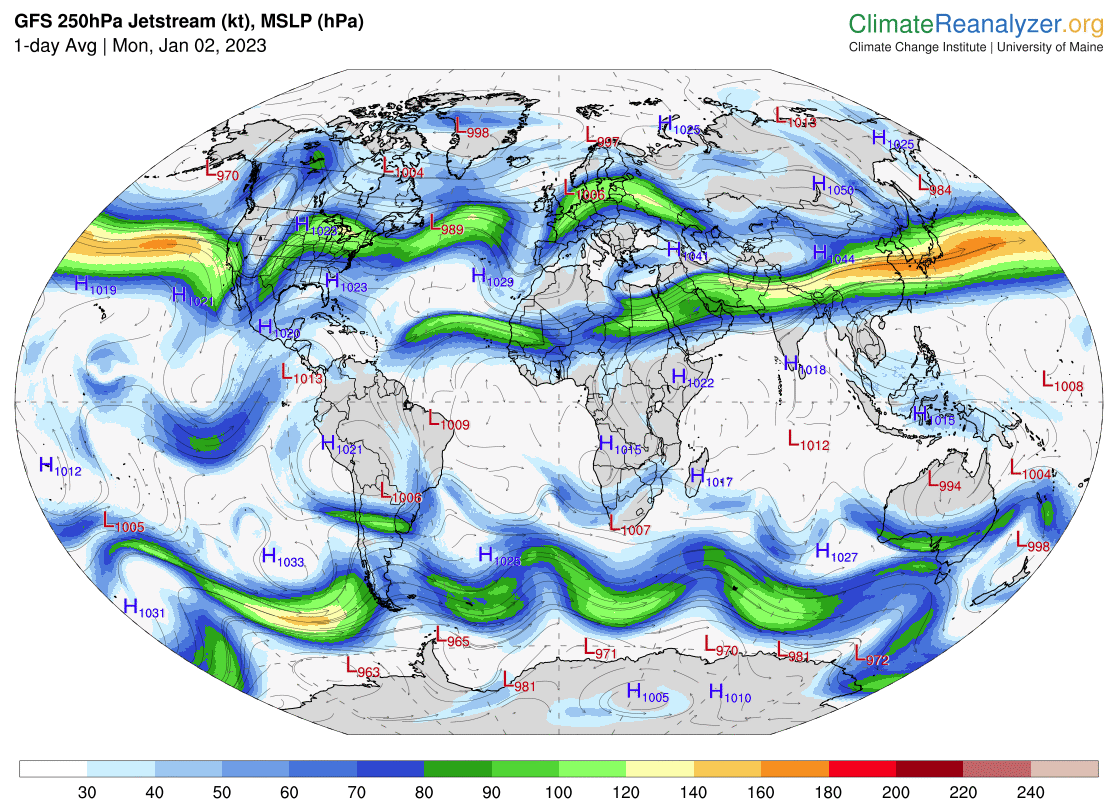
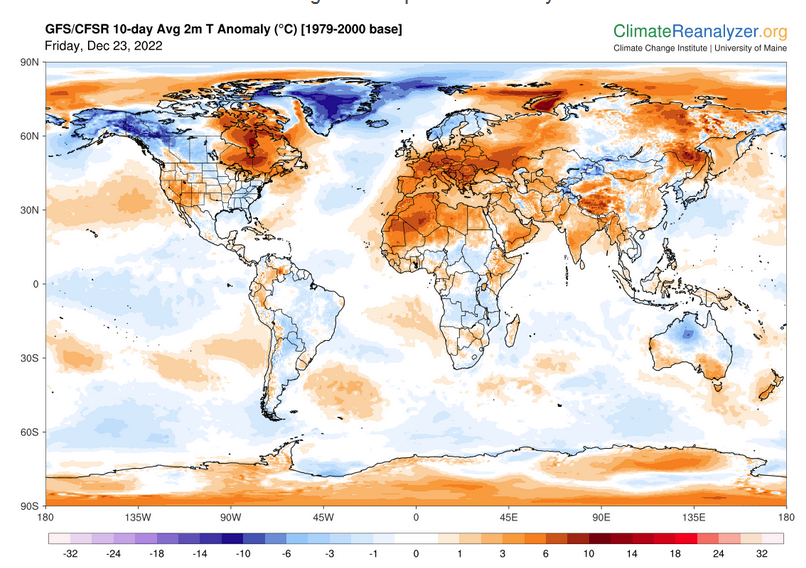
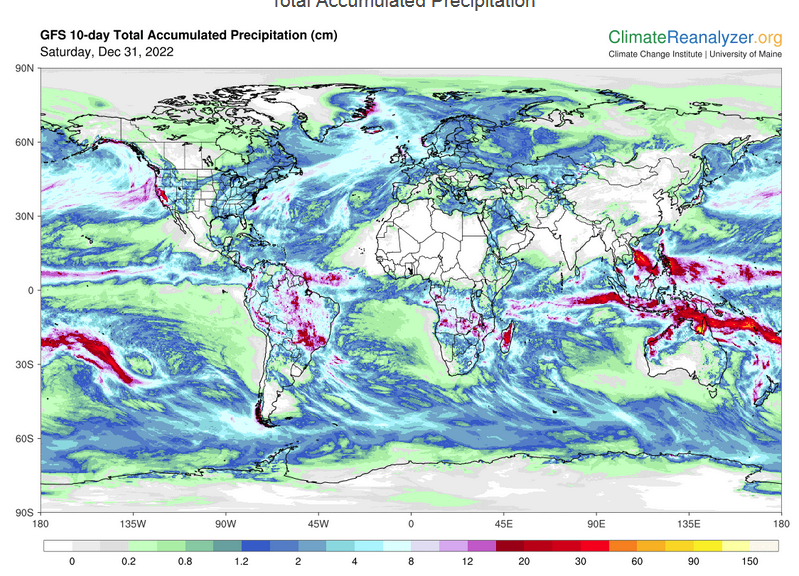
World Forecast
Below are the current precipitation forecast and the 10-Day forecasts for temperature and precipitation. Updates and additional information can be obtained HERE
Much of this information is provided by the University of Maine. They draw upon many different sources.
Worldwide Tropical Forecast (This is a NOAA Product)

This graphic updates on Tuesdays) If it has not been updated, you can get the update by clicking here Readers will only have to do that if they are reading this article much later than the date of it being published.
| I hope you found this article interesting and useful. |
