Updated at 3:27 p.m. EST Thursday, December 29, 2022
Here is what we are paying attention to the next 48 hours from Thursday afternoon’s NWS Forecast. This is a combination of a U.S. plus World Weather Article. We start with the U.S. Information.
Short Range Forecast Discussion
NWS Weather Prediction Center College Park MD
300 PM EST Thu Dec 29 2022
Valid 00Z Fri Dec 30 2022 - 00Z Sun Jan 01 2023
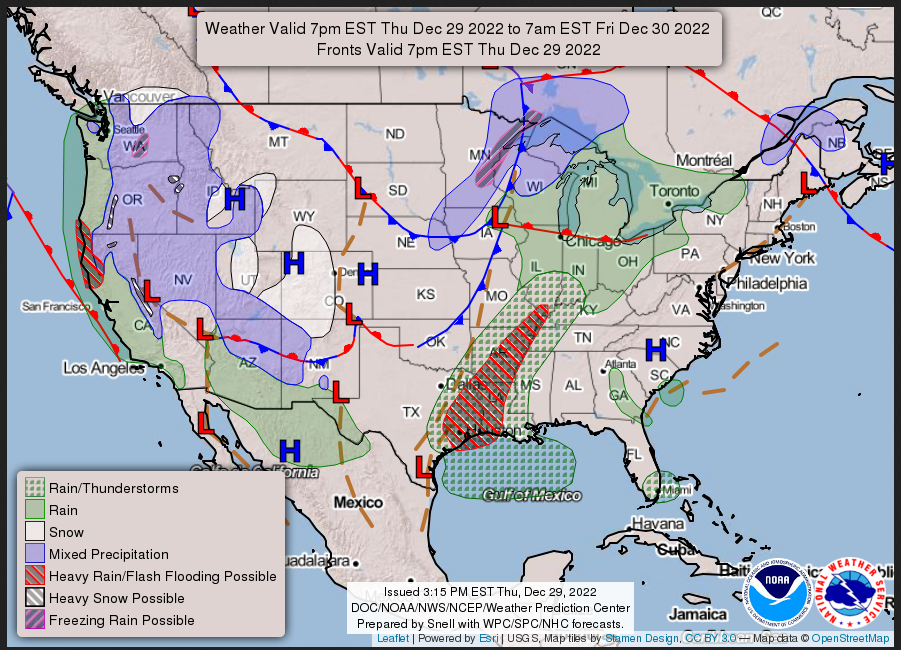
...Heavy rain likely along with possible flooding for the West Coast of
the U.S., with a focus from southwestern Oregon into central and northern
California through the weekend...
...Showers and thunderstorms with the potential for severe weather and
flash flooding across portions of eastern Texas into the lower/middle
Mississippi Valley and lower Ohio Valley...
...Temperatures will be well above average from the central to eastern
United States...
![]()
We start with the 48-Hour Forecast
Continuation of the NWS Short Range Forecast (It is updated by NWS twice a day and these updates can be found here. We post at least one of those updates daily, sometimes both.
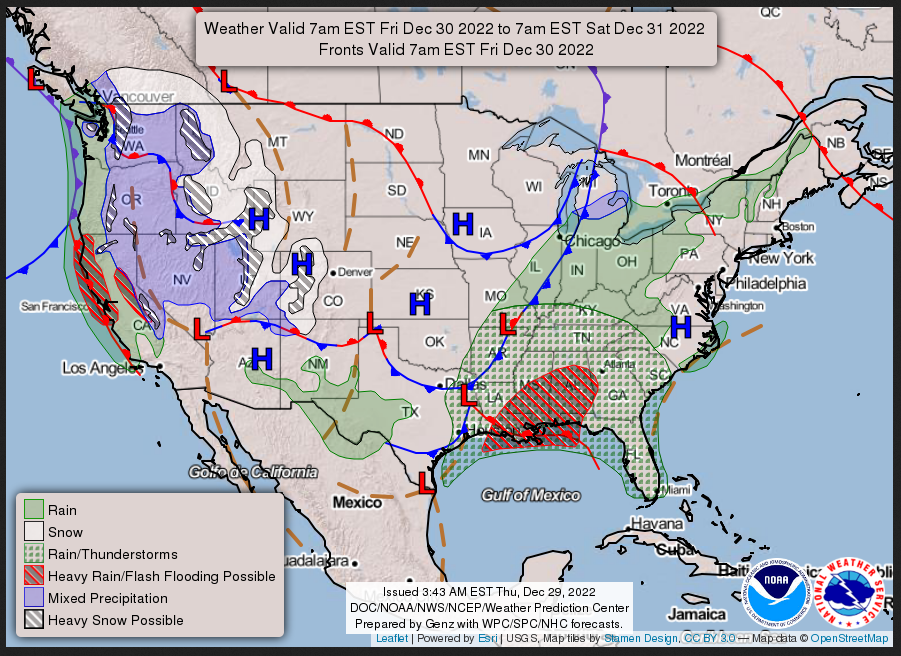
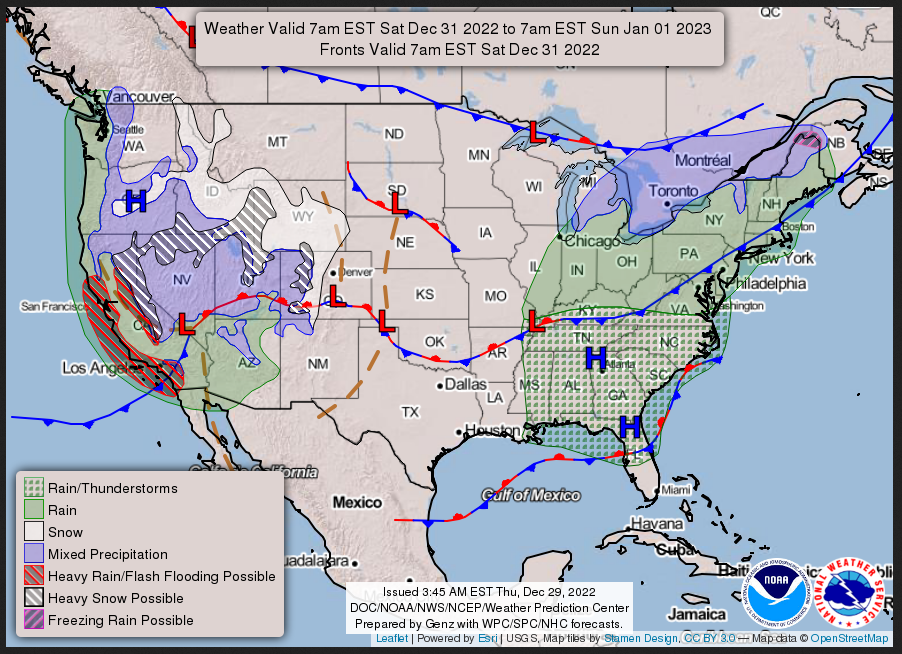
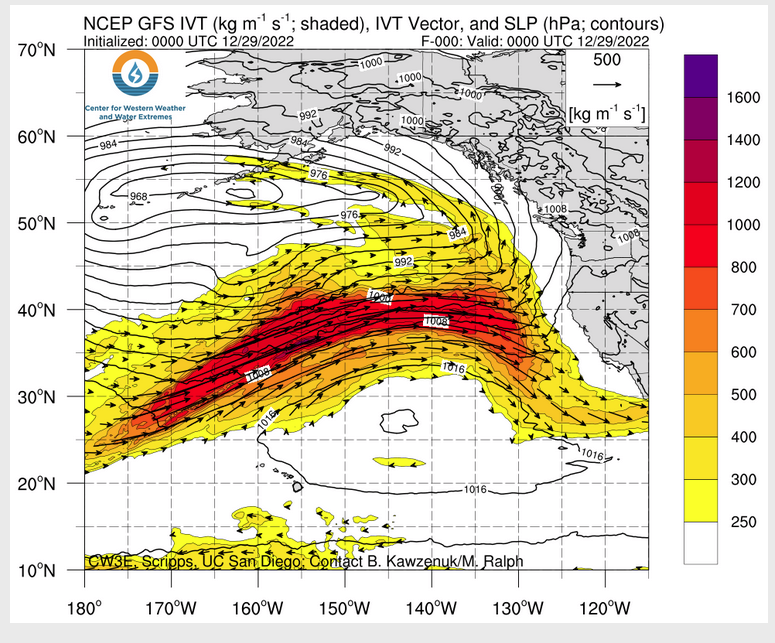
An active weather pattern will continue into the weekend for much of the
western U.S. as a series of upper level disturbances move into the region.
While snow levels are still relatively low as of Thursday afternoon from
the Sierra Nevada into the Cascades of Oregon, warmer Pacific air will
flow into the region near and just south of a cold front that will reach
the West Coast tonight, raising snow levels for locations from southern
Oregon into central and northern California. The cold front is not
forecast to make much southward progress through Friday which will focus a
slow moving axis of moderate to heavy precipitation into northern
California, with snow reserved for only the highest elevations of the
mountains from southern Oregon into northern California. The cold front is
expected to begin shifting south on Saturday, translating the threat of
heavy rain and flooding southward into southern California beginning
Saturday afternoon. Through late Saturday, 1-3 inches of rain is forecast
for the Sacramento Valley while 4 to 8 inches of rain, locally higher, can
be expected to impact the foothills and favored upwind portions of the
Coastal Ranges into the central and northern Sierra Nevada. Given warmer
temperatures and heavy rain for these locations, areas of flooding are
expected for portions of the West Coast with a focus from southwestern
Oregon into central and northern California through at least Saturday,
with snow melt a contributing factor.

Out ahead of the disturbances affecting the western U.S., warmer air will
be felt by much of the central and eastern U.S. into the weekend where
high temperatures are likely to run anywhere from 10 to 25 degrees above
average for most locations east of the Rocky Mountains. With the warmer
temperatures, however, will come the threat for rain and thunderstorms.
The greatest risk for severe thunderstorms will remain focused across
southern locations from eastern Texas into the lower Mississippi Valley
and central Gulf Coast through Friday while the potential for flash
flooding will overlap with some of these same locations, but also extend
northward into the lower Ohio Valley. Rain for the East Coast will likely
hold off until Saturday as a pair of cold fronts approach from the west.
Daily weather maps
THURSDAY AFTERNOON, EVENING, AND OVERNIGHT
FRIDAY
SATURDAY
I try to keep the above maps updated. They only update twice a day and in some cases once a day.
I will be doing the updating during the period described in the title of the article but if you happen to read this article later you can get updates by clicking Here for Day 1 and Here for Day 2. This link works also.
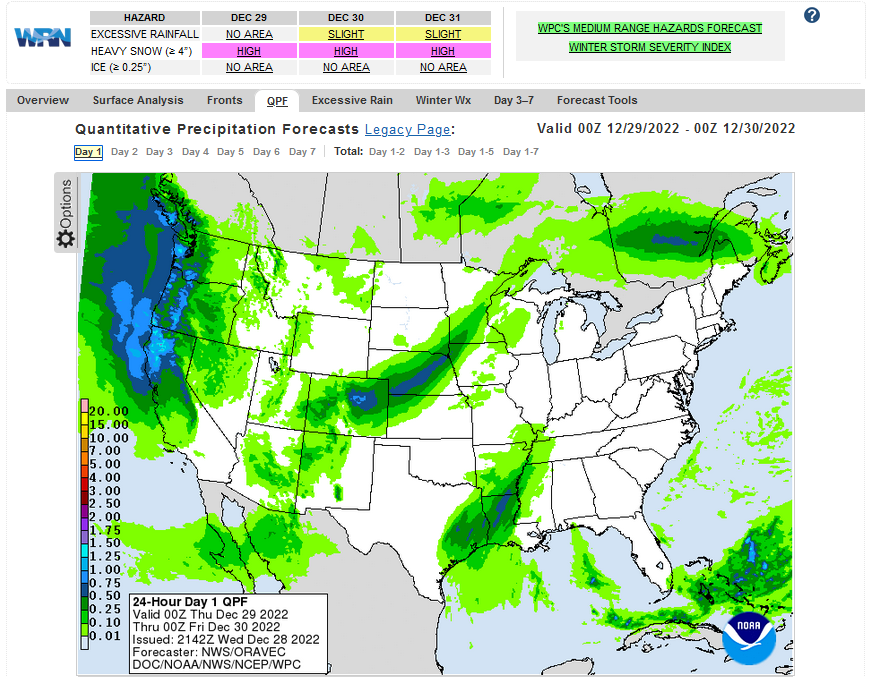
Below is the current three-day cumulative forecast of precipitation (Updates can be found HERE)
his animation shows how things may play out over the next 60 hours. To update click here.
| Temperature (Maximum or Minimum Anomaly) for Days 3 – 7 |
Precipitation (Five days of cumulative precipitation) |
| https://www.wpc.ncep.noaa.gov/medr/medr_mean.shtml | https://www.wpc.ncep.noaa.gov/qpf/day1-7.shtml |
ATMOSPHERIC RIVERS
 —
—
Now we look at Intermediate-Term “Outlook” maps for three time periods. Days 6 – 10, Days 8 – 14, and Weeks 3 and 4. An outlook differs from a forecast based on how NOAA uses these terms in that an “outlook” presents information as deviation from normal and the likelihood of these deviations.
I have provided the 6 – 10 day maps (and I usually update it every two days) so you do not need to click to get them but you will have to click on the links for the Day 8 -14 and Week 3- 4 period. The maps do not update daily. But you can get the current images simply by clicking on the links provided. Then hit the return arrow at the upper left of your screen to return to the article. There is no need to do that right away since what is published today is up to date as of the original publish date so they can be updated during the weekend if you want. It is probably not necessary to do that. The Week 3 – 4 Outlook only updates on Fridays.
Below are the links to obtain updates and additional information. They are particularly useful if you happen to be reading this article significantly later than when it was published. I always try to provide readers with the source of the information in my articles.

 –
–
| Mostly warm and wet. That is a big change |
HAZARDS OUTLOOKS
Click here for the latest complete Day 3 -7 Hazards forecast which updates only on weekdays. Once a week probably Monday or Tuesday I will update the images. I provided the link for readers to get daily updates on weekdays. Use your own judgment to decide if you need to update these images. I update almost all the images Friday Night for the weekend edition of this Weather Report. So normally readers do not need to update these images but if the weather is changing quickly you may want to.

 Month to Date Information
Temperature month to date can be found at https://hprcc.unl.edu/products/maps/acis/MonthTDeptUS.png
Precipitation month to date can be found at https://hprcc.unl.edu/products/maps/acis /MonthPNormUS.png
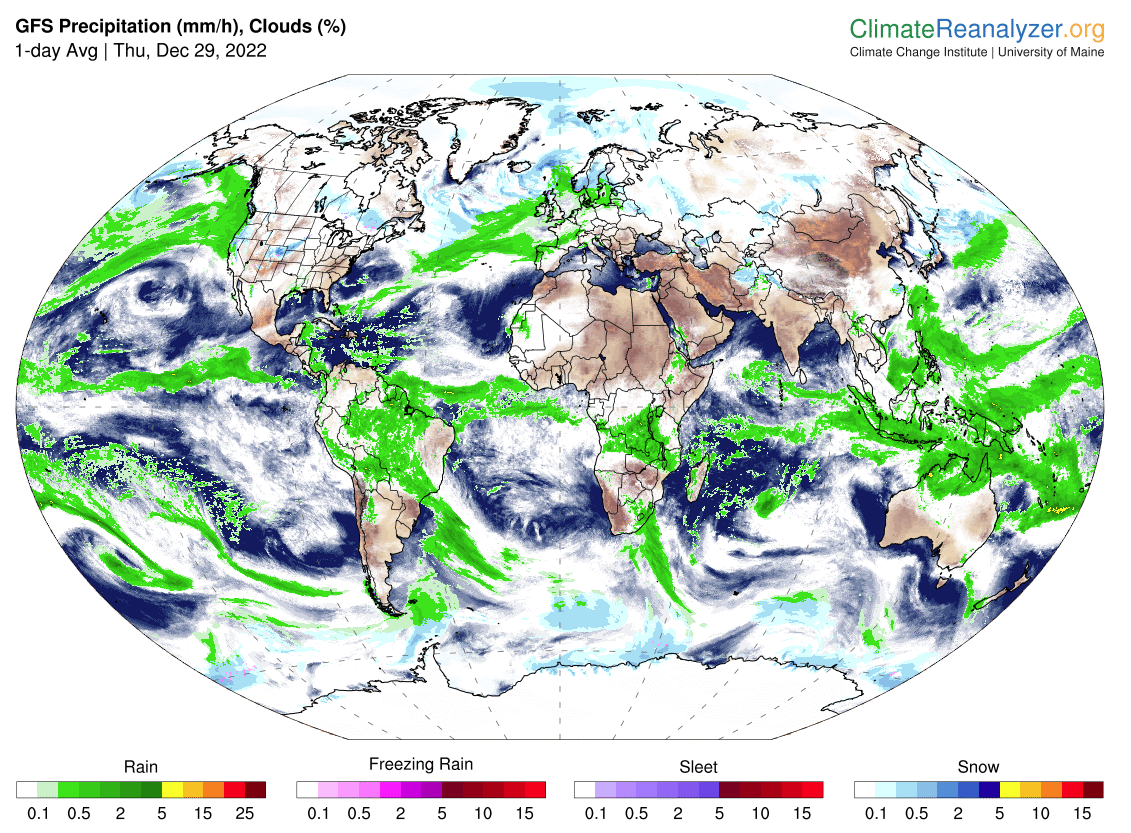
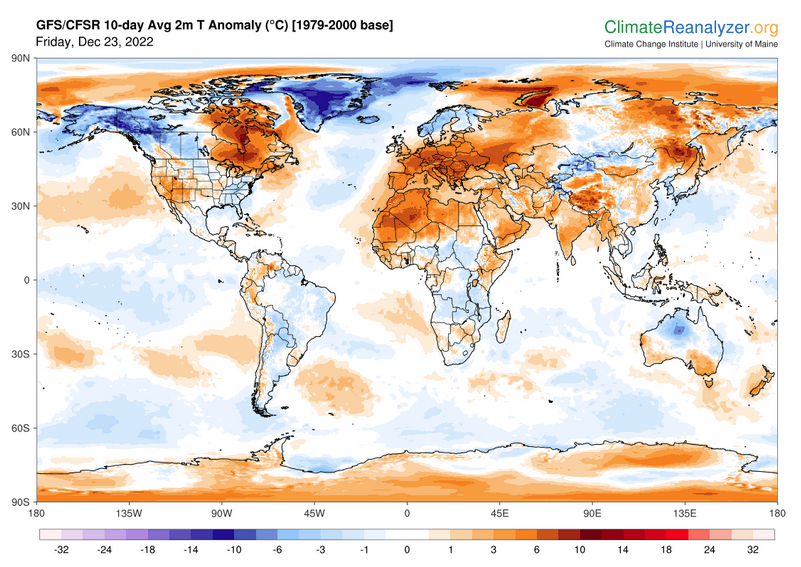
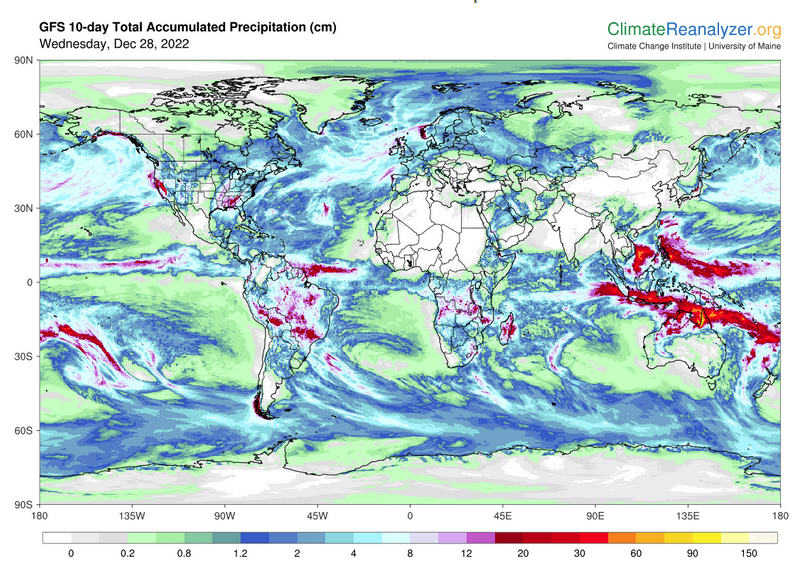
World Forecast
Below are the current precipitation forecast and the 10-Day forecasts for temperature and precipitation. Updates and additional information can be obtained HERE
Much of this information is provided by the University of Maine. They draw upon many different sources.
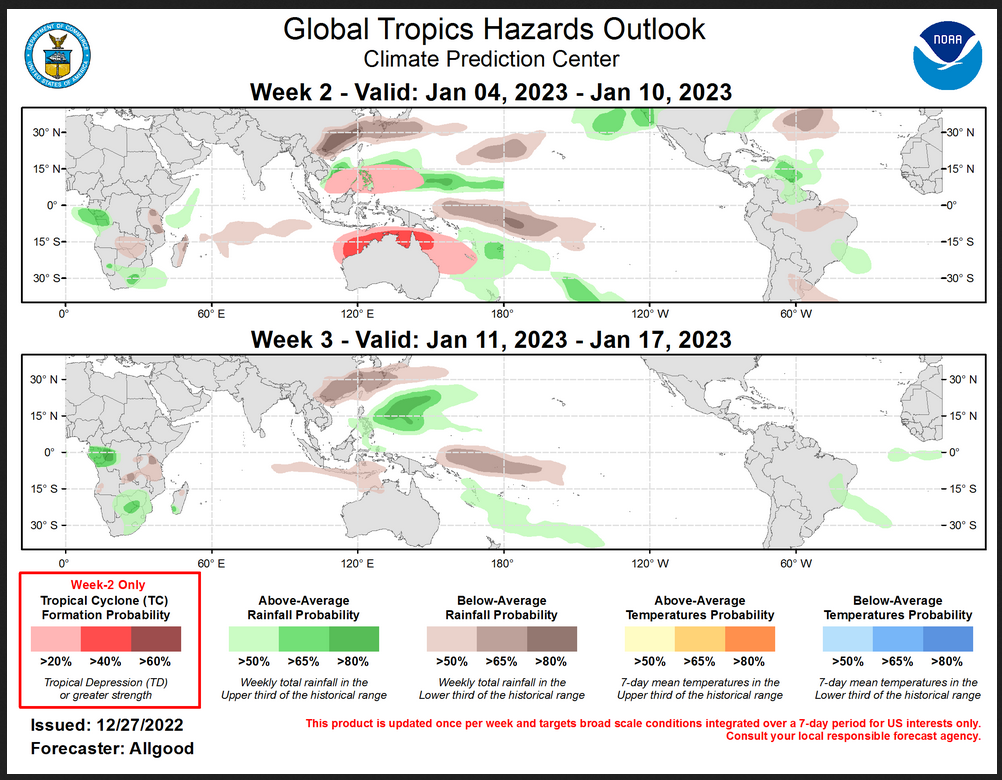
 Worldwide Tropical Forecast (This is a NOAA Product)
This graphic updates on Tuesdays) If it has not been updated, you can get the update by clicking here Readers will only have to do that if they are reading this article much later than the date of it being published.
| I hope you found this article interesting and useful. |