Updated at 8:55 pm Friday December 23. The weekend version of this article will be published later.
Here is what we are paying attention to the next 48 hours from Friday Afternoon’s NWS Forecast. This is a combination of a U.S. plus World Weather Article. We start with the U.S. Information.
Short Range Forecast Discussion
NWS Weather Prediction Center College Park MD
244 PM EST Fri Dec 23 2022
Valid 00Z Sat Dec 24 2022 - 00Z Mon Dec 26 2022
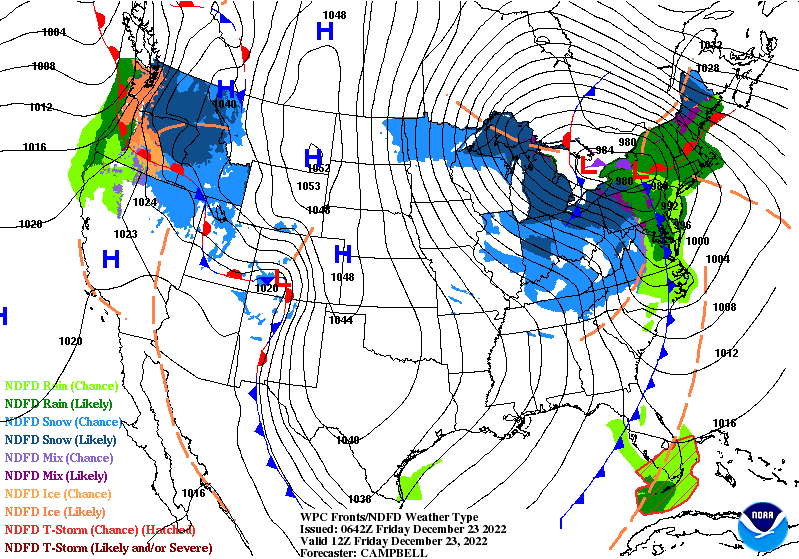
...Blizzard and Arctic Blast to impact from the Midwest to the Northeast...
...Lake-effect snow downwind from Great Lakes with the highest snowfall
totals downwind from Lakes Erie, Ontario, and Superior...
...Rain/freezing rain to impact the Pacific Northwest and the Northern
High Plain...
...Temperatures will be 25 to 35 degrees below average from east of the
Rockies to the Appalachians...
Continuation of the NWS Short Range Forecast (It is updated by NWS twice a day and these updates can be found here. We post at least one of those updates daily, sometimes both.
Day 1 and Day 2 Maps can be found by clicking Here for Day 1 and Here for Day 2. This Link works also.
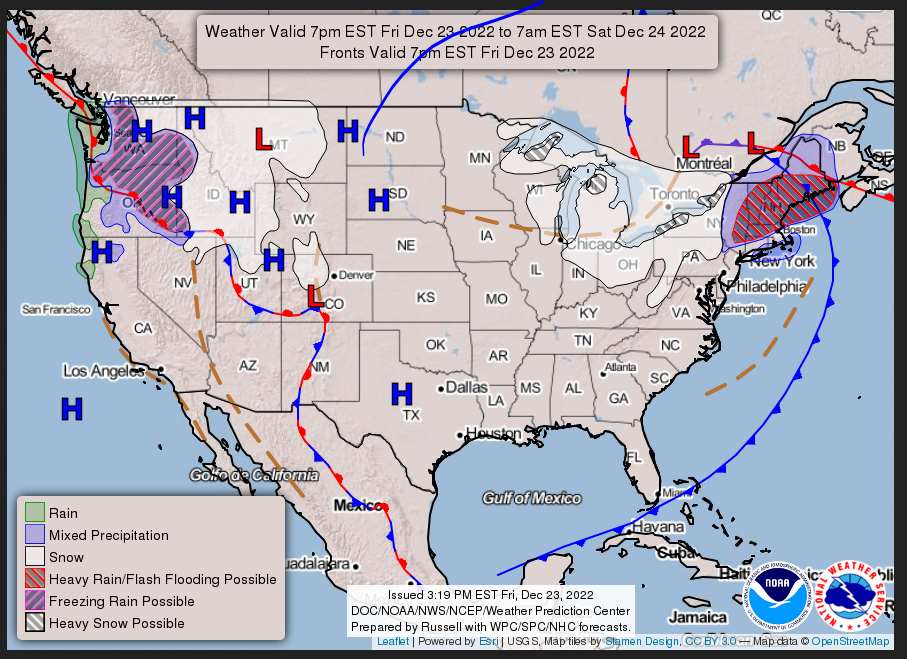
FRIDAY EVENING AND OVERNIGHT
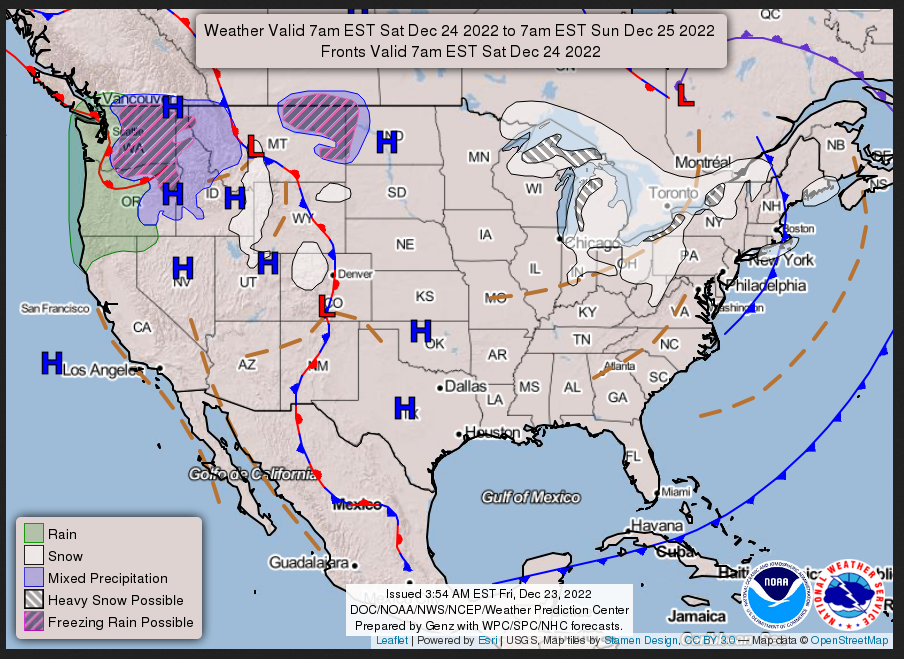
SATURDAY
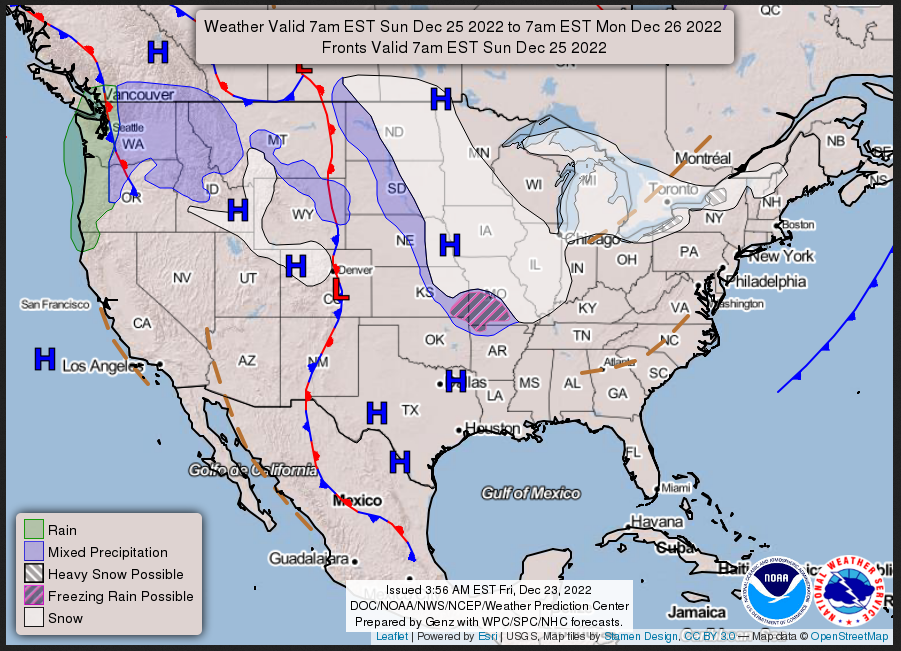
SUNDAY
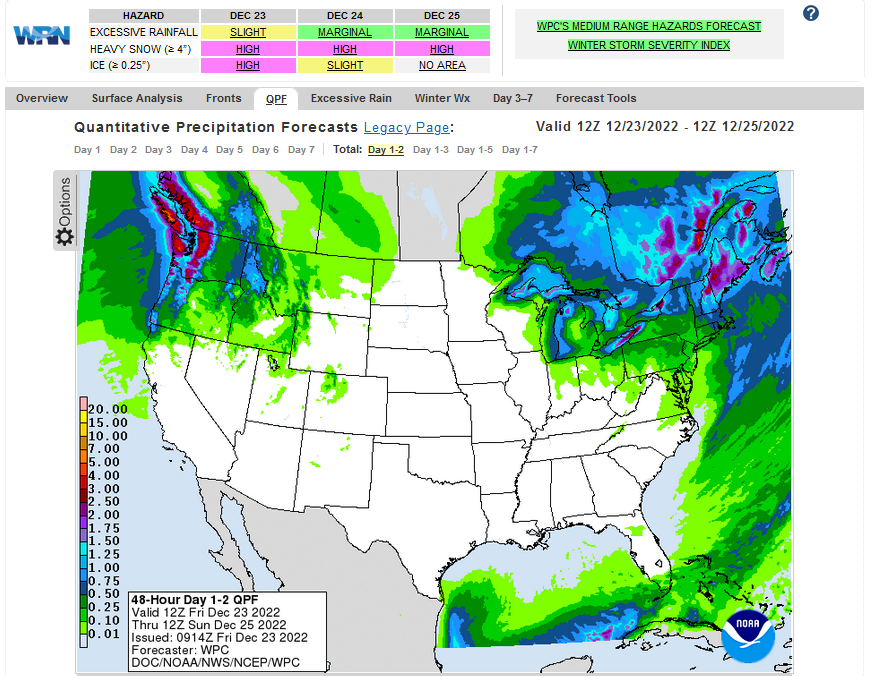
Current Two-day forecast of heavy precipitation (Updates can be found HERE)
Here is a 60-hour animated forecast map that shows how the short-term forecast is expected to play out
If it needs to be updated click here.
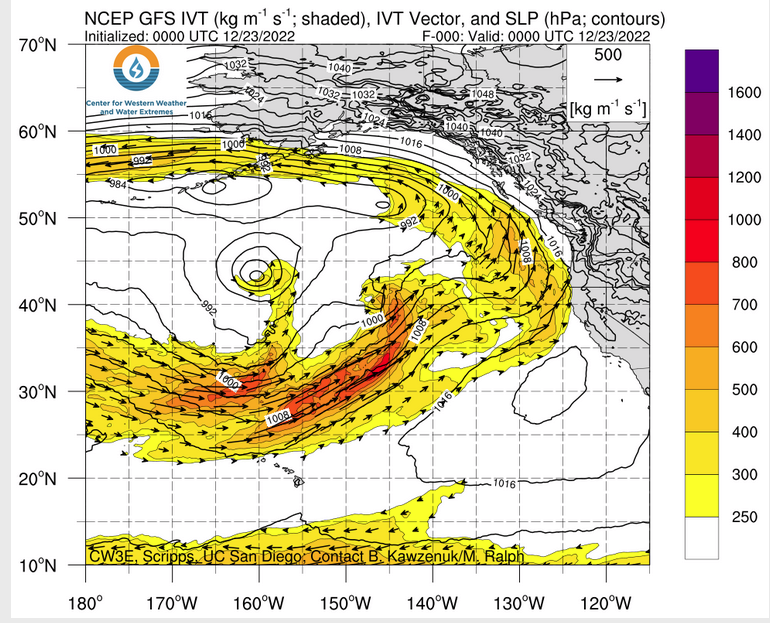
ATMOSPHERIC RIVERS
–
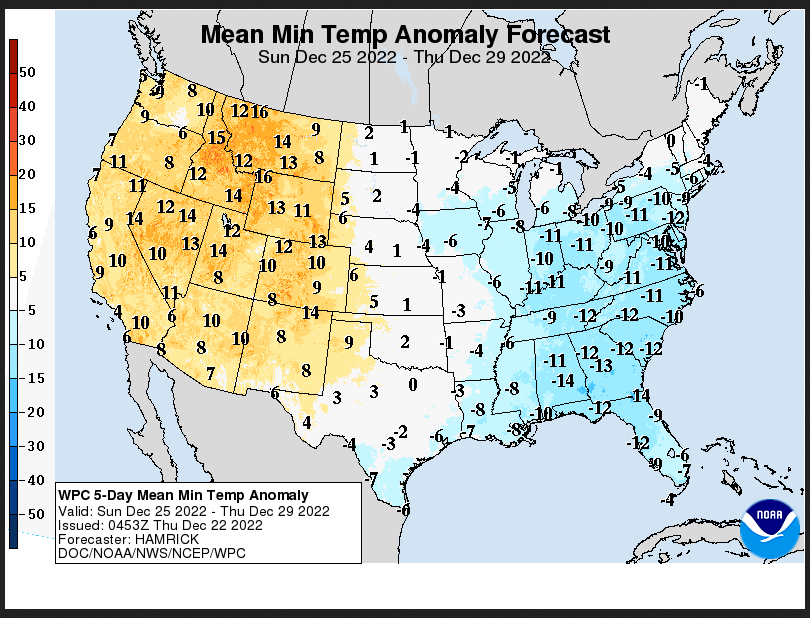
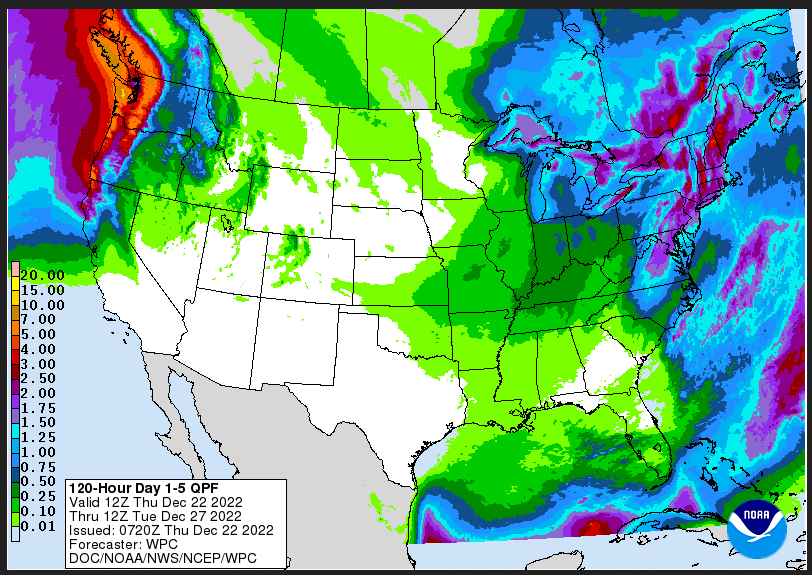
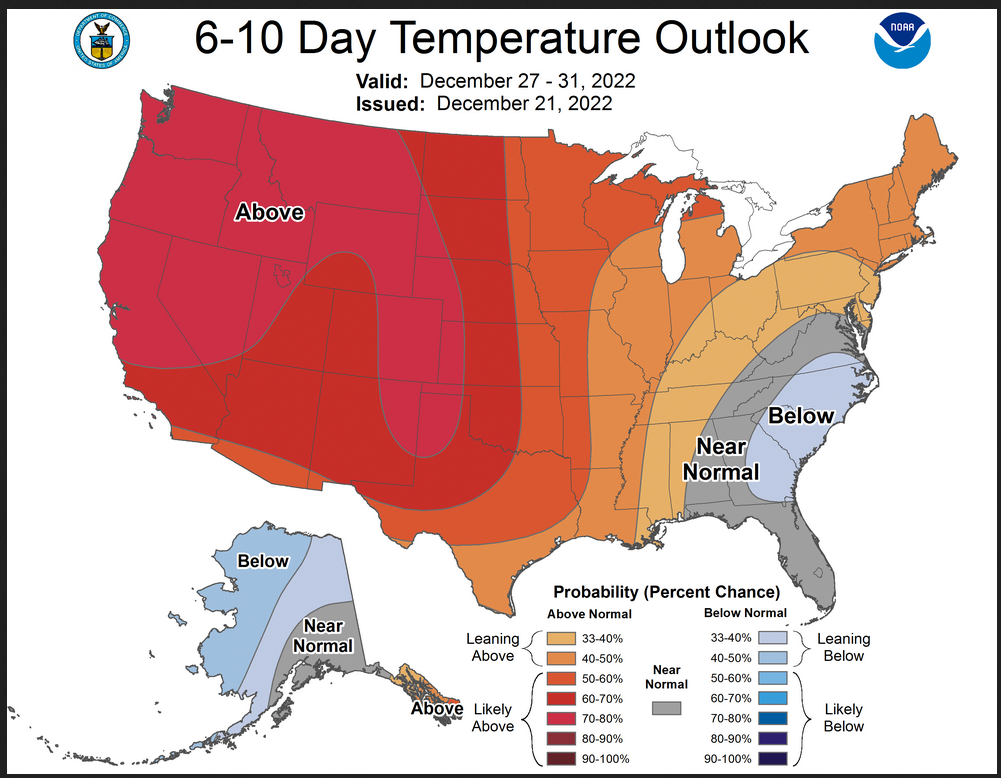
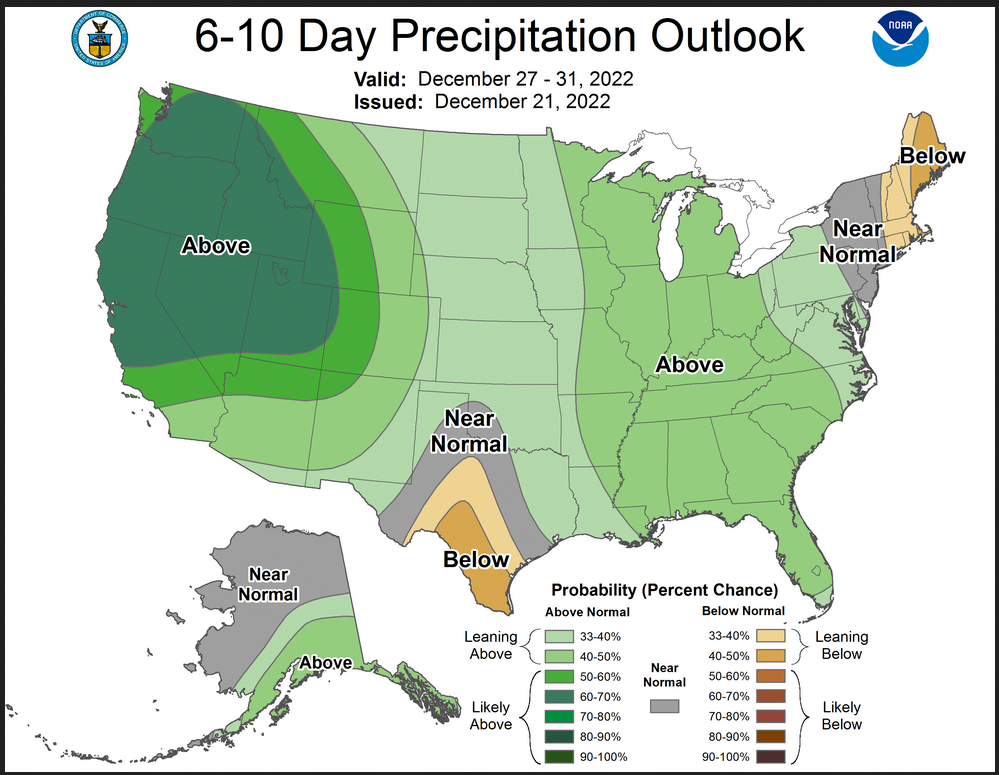
Days 1 Through 5 and 6 – 10 (I update these graphics every two days – but the reader can get an update if they want but the situation usually does not change that quickly)
| Days 1 – 5 (3 – 7 for Temperature) | Days 6 – 10 |
| https://www.wpc.ncep.noaa.gov/medr/medr_mean.shtml | https://www.cpc.ncep. noaa.gov/products/predictions/610day/ |
| These graphics update and can be clicked on to enlarge. You can see where the weather will be. An alternate website is https://www.wpc.ncep.noaa.gov/qpf/day1-7.shtml | |
–
Days 6 – 10 Outlook
An outlook differs from a forecast based on how NOAA uses these terms in that an “outlook” presents information from deviation from normal and the likelihood of these deviations.
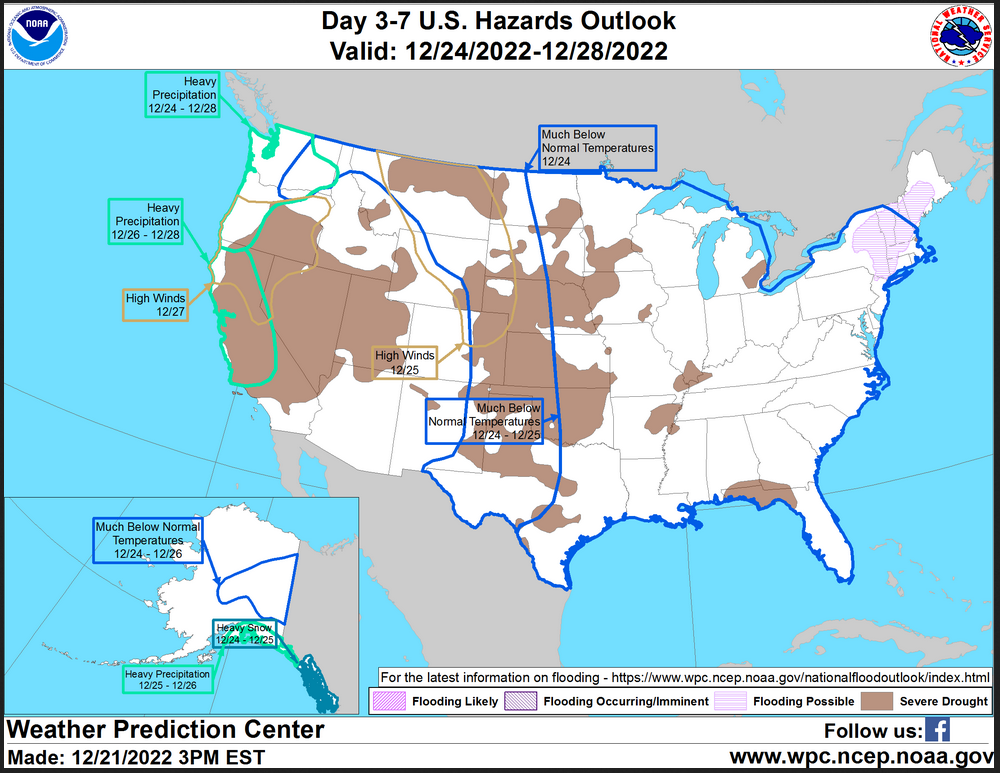
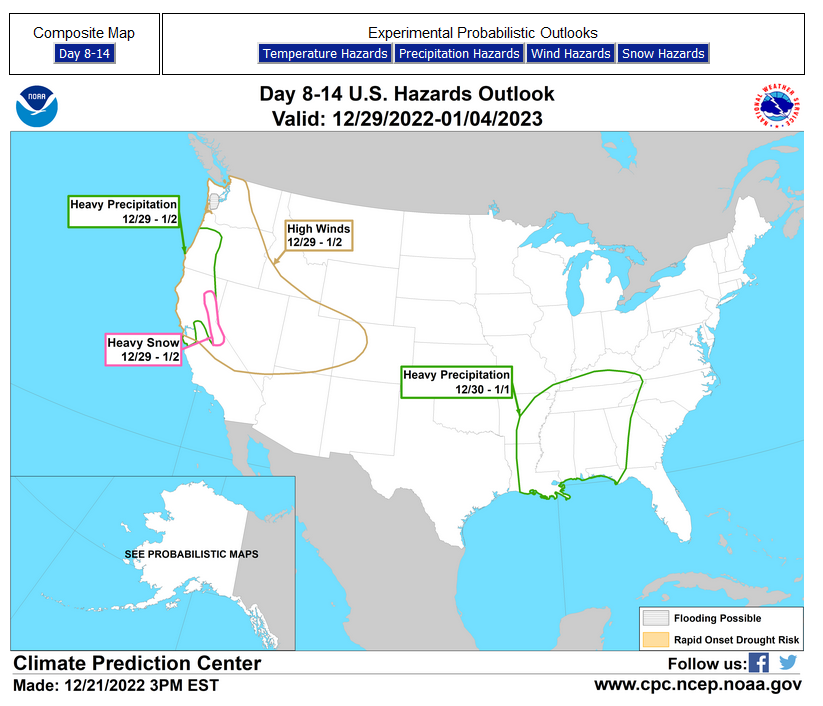
HAZARDS OUTLOOKS (I update these graphics every two days – but the reader can get an update if they want but the situation usually does not change that quickly)
Click here for the latest complete Day 3 -7 Hazards forecast which updates only on weekdays. Once a week probably Monday or Tuesday I will update the images. I provided the link for readers to get daily updates on weekdays. Use your own judgment to decide if you need to update these images.
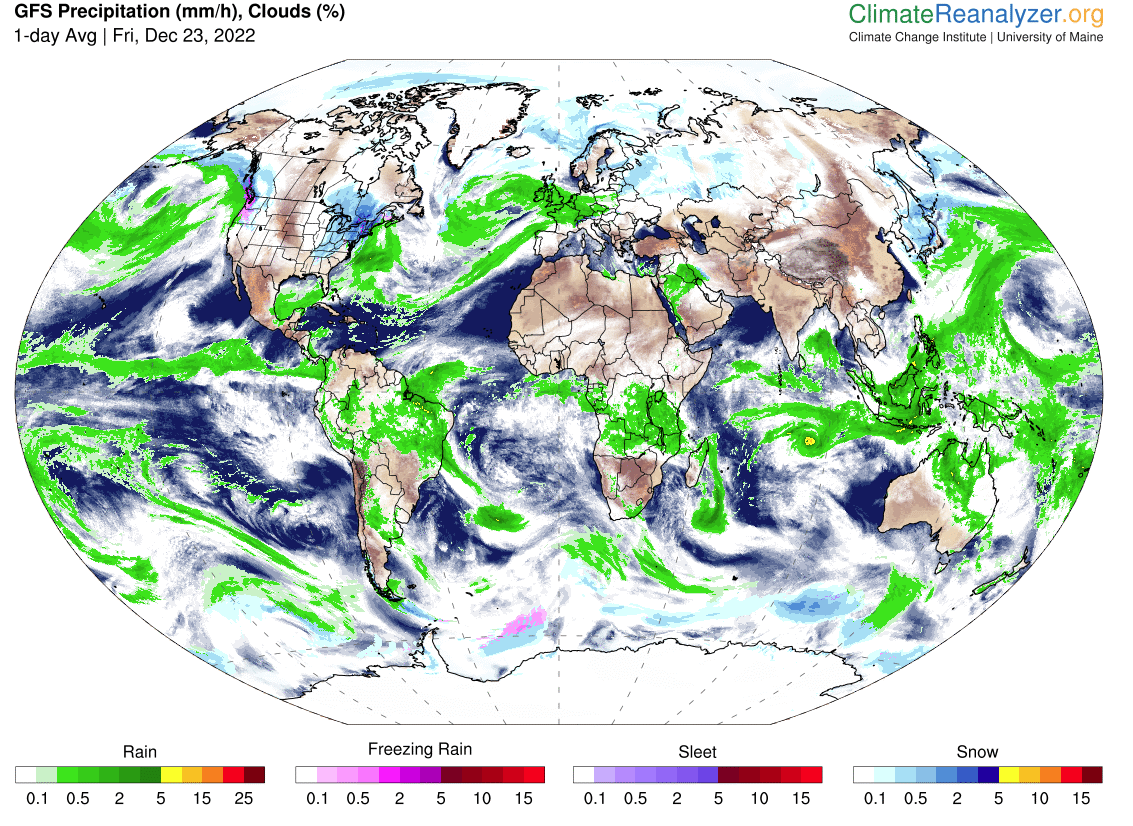
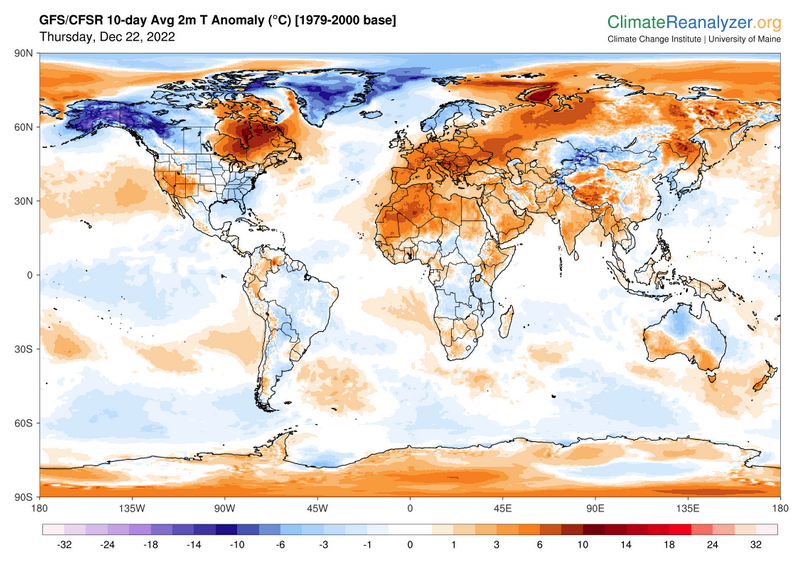
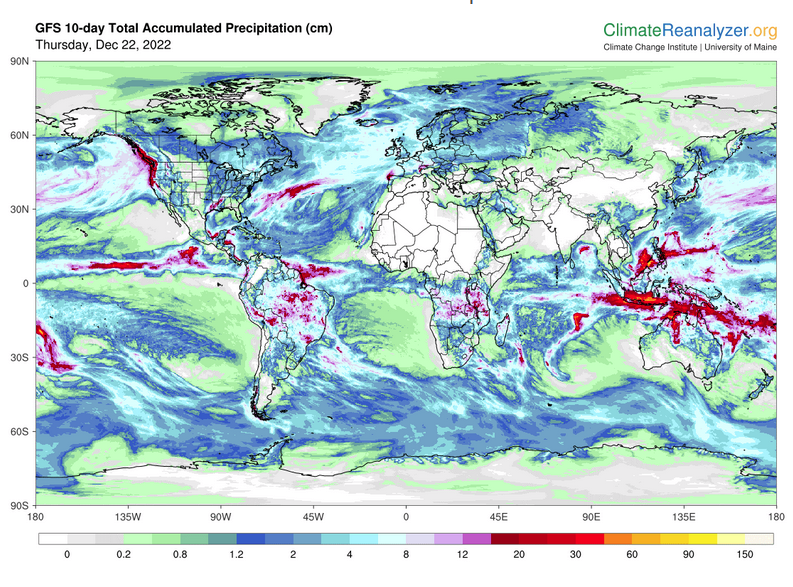
Worldwide Weather (The U.S. is part of the World so the U.S. forecast is included in these maps)
Below maps are the short-term forecast for precipitation and 10-day forecast for temperature and precipitation. I update the Day 1 Forecast daily and the ten-day forecasts every two days. A ten-day forecast is not likely to change much in 24 hours. But if you are looking at an out-of-date version of this article the current forecast maps can be obtained HERE.
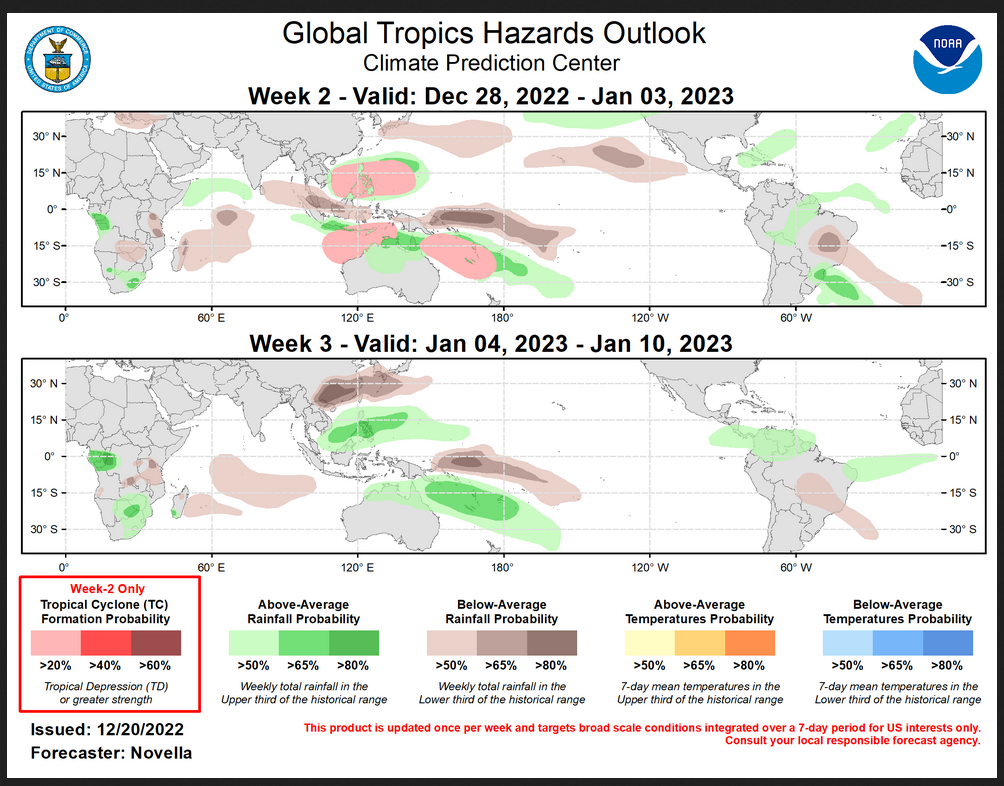
Worldwide Tropical Forecast
(This graphic updates on Tuesdays) If it has not been updated, you can get the update by clicking here This is a new approach and covers weeks 2 and 3 not weeks 1 and 2. It has more information but I am having trouble getting used to it. As usual, it comes with a discussion which is below
Detailed Maps and Reports for the Western Atlantic and the Pacific Oceans
Below are four maps that summarize the situation for the Atlantic, Eastern, Central Pacific, and Western Pacific. Additional information can be accessed by clicking HERE
First the Atlantic
Click to view the forecast map and have access to additional information https://www.nhc .noaa.gov/gtwo.php?basin= atlc&fdays=5
Then Eastern Pacific
Click to view the forecast map and have access to additional information https://www.nhc.noaa.gov/gtwo.php?basin=epac&fdays=5
Then Central Pacific
Click to view the forecast map and have access to additional information https://www.nhc.noaa.gov/gtwo.php?basin=cpac&fdays=5
And the Western Pacific
Click to view the forecast map and have access to additional information https://www.metoc.navy.mil/jtwc/jtwc.html
Some Longer U.S. Intermediate-Term Outlooks
Links to “Outlook” maps and discussions for Two time periods. Days 8 – 14, and Weeks 3 and 4.
You have to click on the links because they do not update automatically and I do not want to have stale images in the article. But it is not difficult to click on a link and you get a large image plus a discussion. On Fridays in a separate article, we will show the images and provide a link in this article that article. But remember what you will see is the images as of Friday. But here you can get the current images simply by clicking on them. Then hit the return arrow at the upper left of your screen to return to the article. You will not find this information easily anywhere else.
| Days 8 – 14 | Weeks 3 and 4 |
| https://www.cpc.ncep.noaa.gov/products/predictions/814day/ | https://www.cpc.ncep.noaa.gov/products/predictions/WK34/ |
| These graphics update and can be clicked on to enlarge. You can see where the weather will e | |
–
Month to Date Information
Month to date Temperature can be found at https://hprcc.unl.edu/products/maps/acis/MonthTDeptUS.png
Month to date Precipitation can be found at https://hprcc.unl.edu/products/maps/acis/MonthPNormUS.png