Here is what we are paying attention to today, and the next 48 hours from Friday Afternoon’s NWS Forecast. This is a combination of a U.S. plus World Weather Forecast.
Short Range Forecast Discussion
NWS Weather Prediction Center College Park MD
247 PM EST Fri Dec 16 2022

Valid 00Z Sat Dec 17 2022 - 00Z Mon Dec 19 2022

...Light snow showers gradually coming to an end over the northern Plains
and Upper Midwest...

...Heavy snow to impact portions of the Interior Northeast through
Saturday...

...Well below normal temperatures enter the north-central U.S. by Sunday...
–
| The NOAA Four-Season Outlook was released on Thursday and our article showing their predictions with comments and additional information can be found HERE. To return to this article, just hit the return arrow in the upper left side of your screen or go back to econcurrents.com and reclick on the weather article. |
Continuation of the NWS Short Range Forecast (It is updated by NWS twice a day and these updates can be found here. We post at least one of those updates daily, sometimes both.
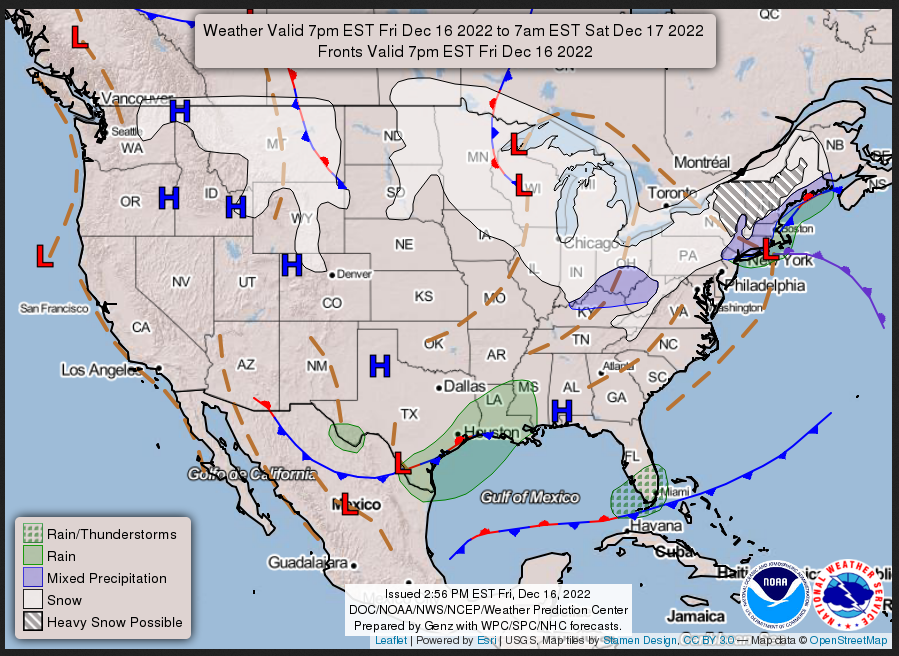
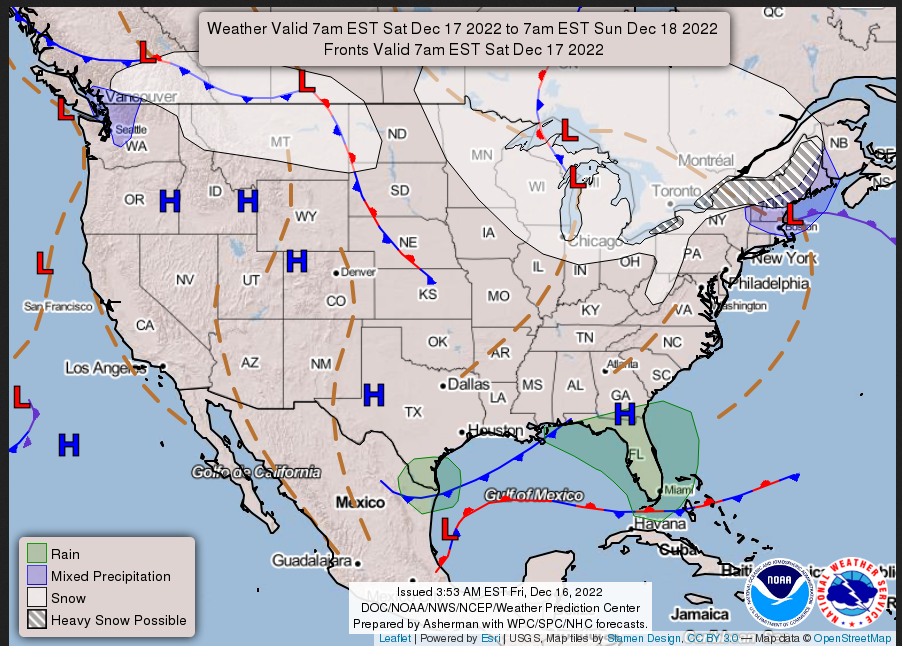
The low pressure system that brought significant heavy snow and widespread
blizzard conditions to the northern Plains and Upper Midwest is forecast
to continue to weaken through the weekend. Gusty winds could result in
blowing snow and blizzard conditions through this afternoon, then winds
will relax tonight as the low pressure center moves northeast away from
the region and the pressure gradient relaxes. Blowing snow will result in
near zero visibility at times and snow covered roads will make travel
dangerous. Snow showers are gradually coming to an end across the region
with only light scattered snow showers expected through Saturday morning.

In the Northeast, a low pressure system is tracking north along the coast
and producing heavy snow inland and rain along the coast. Heavy snow is
expected to continue through Saturday across interior New York and New
England. Heavy snowfall rates of 1-2 inches per hour are likely, and storm
total snowfall is expected to reach 1-2 feet in portions of the
Adirondacks, Mohawk Valley, and the Green and White Mountains. Travel
conditions will be dangerous at times, and scattered power outages are
anticipated. Winter Storm Warnings are in effect from northeastern
Pennsylvania to Maine, and Winter Storm Watches are in effect for northern
Maine. The storm system will gradually pull away from the Northeast late
this weekend. Snow showers will remain possible over the interior
Northeast through Sunday, with heavy snow expected to come to an end for
much of the area Saturday night. Strong west-southwesterly winds in the
Great Lakes region will create favorable conditions for the development of
lake effect snow bands over the weekend, and heavy snow will be possible
through Sunday downwind of the lakes, especially downwind of lakes Eerie
and Ontario where fetch will be maximized.

In the South, a lingering frontal boundary will create rain chances for
portions of Florida through the weekend. Thunderstorms will be possible
for much of the Florida peninsula Saturday afternoon and evening as a wave
of low pressure moves along the boundary across south Florida. Rain
showers will also be possible along the northern Gulf coast as a slow
moving, weak frontal boundary passes. In the West, the next frontal system
will slide south into the region over the weekend, bringing snow chances
to the Northwest and the northern High Plains.

In terms of the temperature outlook for the CONUS, below normal
temperatures will likely continue across most of the nation through early
next week. Well below normal temperatures are expected to plunge into the
north-central U.S. by Sunday as arctic high pressure builds to the north.
High temperatures are forecast to only reach the single digits and teens,
and lows are forecast to be below zero.
Day 1 and Day 2 Maps can be found by clicking Here for Day 1 and Here for Day 2. This Link works also.
FRIDAY EVENING
SATURDAY
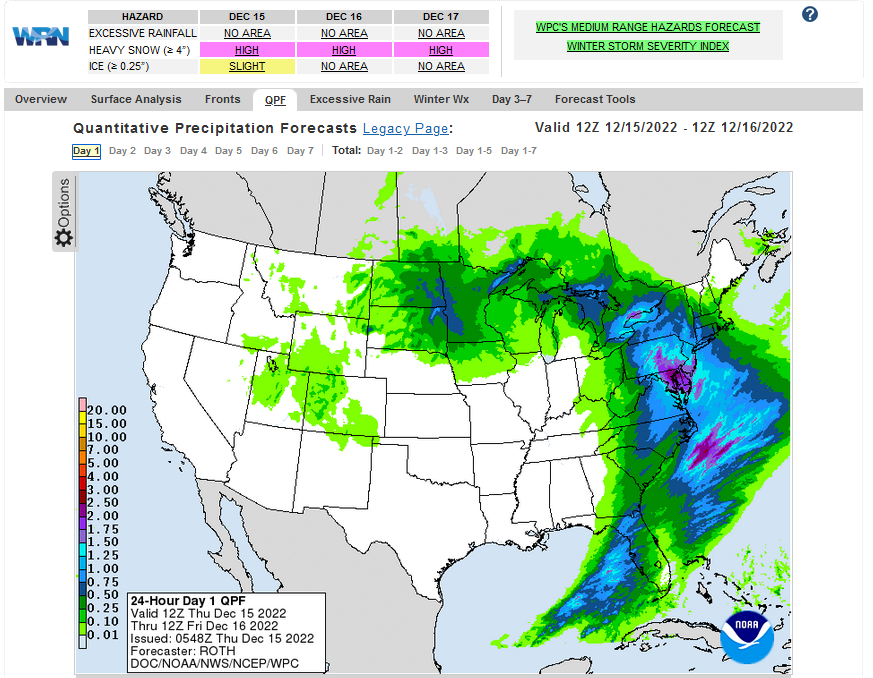
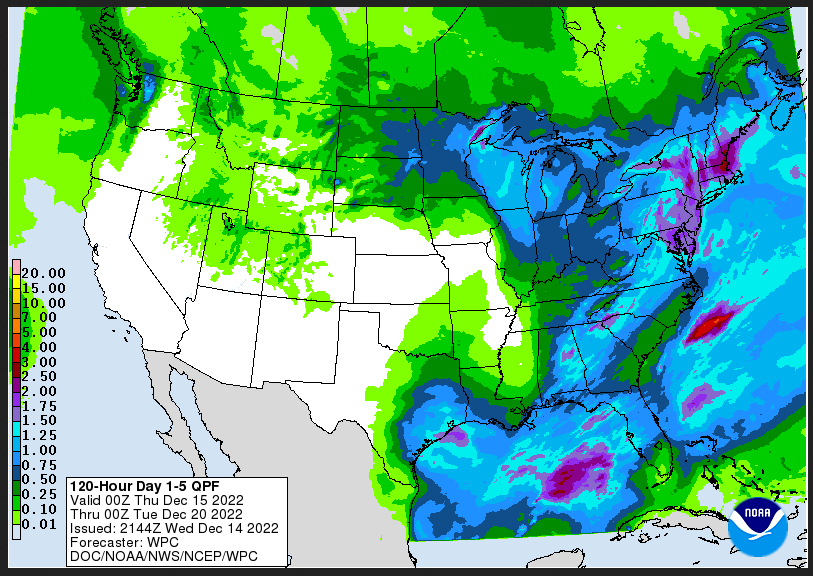
Current Two-day forecast of heavy precipitation (Updates can be found HERE)
Here is a 60-hour animated forecast map that shows how the short-term forecast is expected to play out
If it needs to be updated click here.
ATMOSPHERIC RIVERS
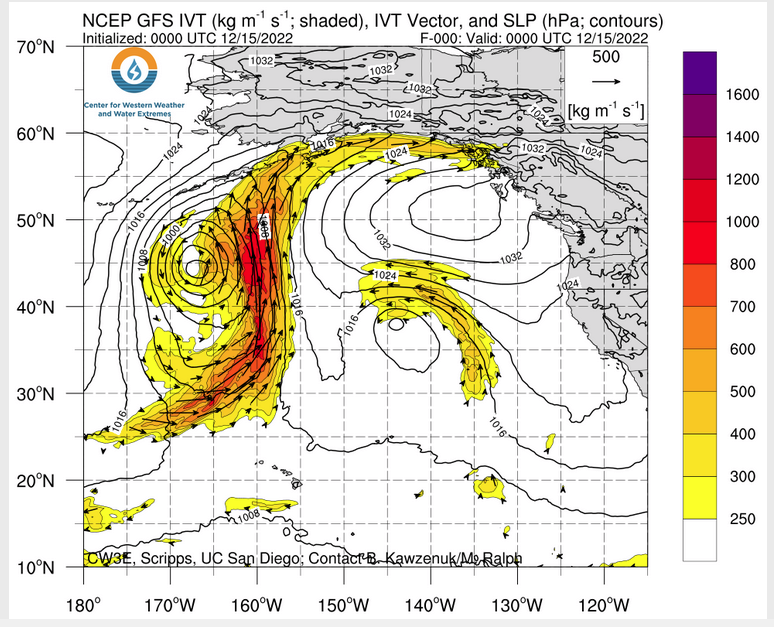
Click HERE to update. Here is some useful information about Atmospheric Rivers.
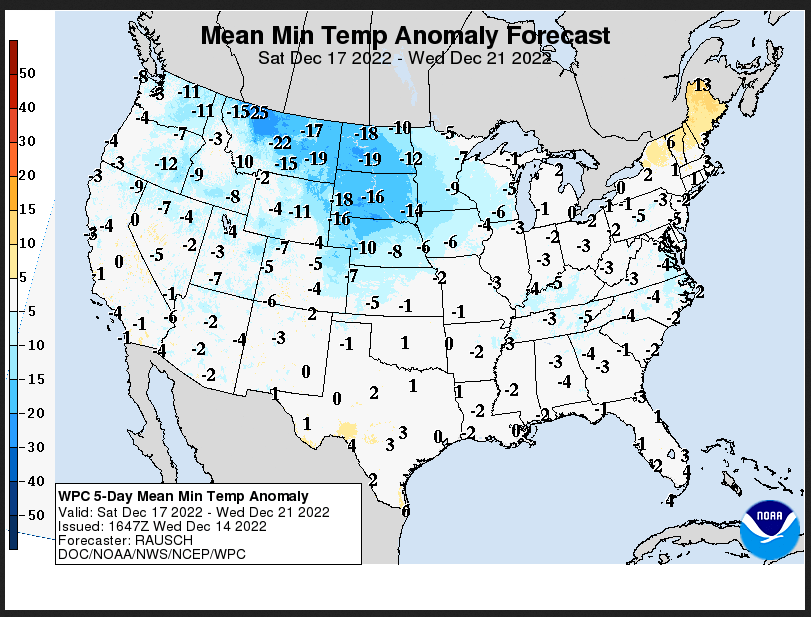
Days 1 Through 5 and 6 – 10 (I update these graphics every two days – but the reader can get an update if they want but the situation usually does not change that quickly)
| Days 1 – 5 (3 – 7 for Temperature) | Days 6 – 10 |
| https://www.wpc.ncep.noaa.gov/medr/medr_mean.shtml | https://www.cpc.ncep.noaa.gov/products/predictions/610day/ |
| These graphics update and can be clicked on to enlarge. You can see where the weather will be. An alternate website is https://www.wpc.ncep.noaa.gov/qpf/day1-7.shtml | |
–
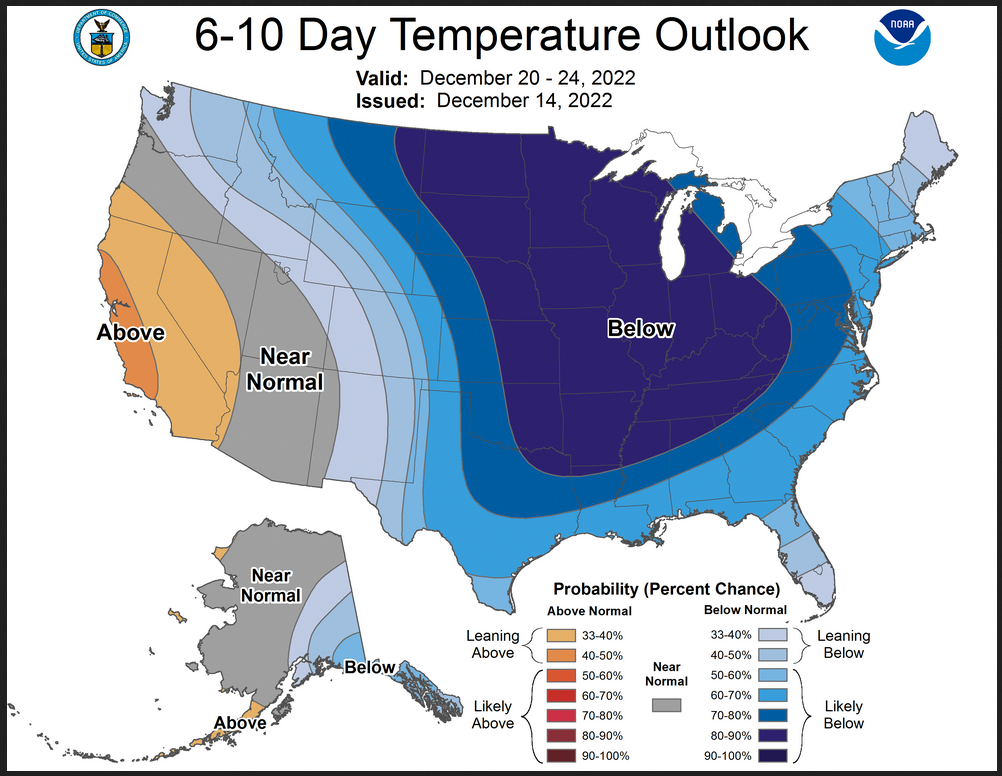
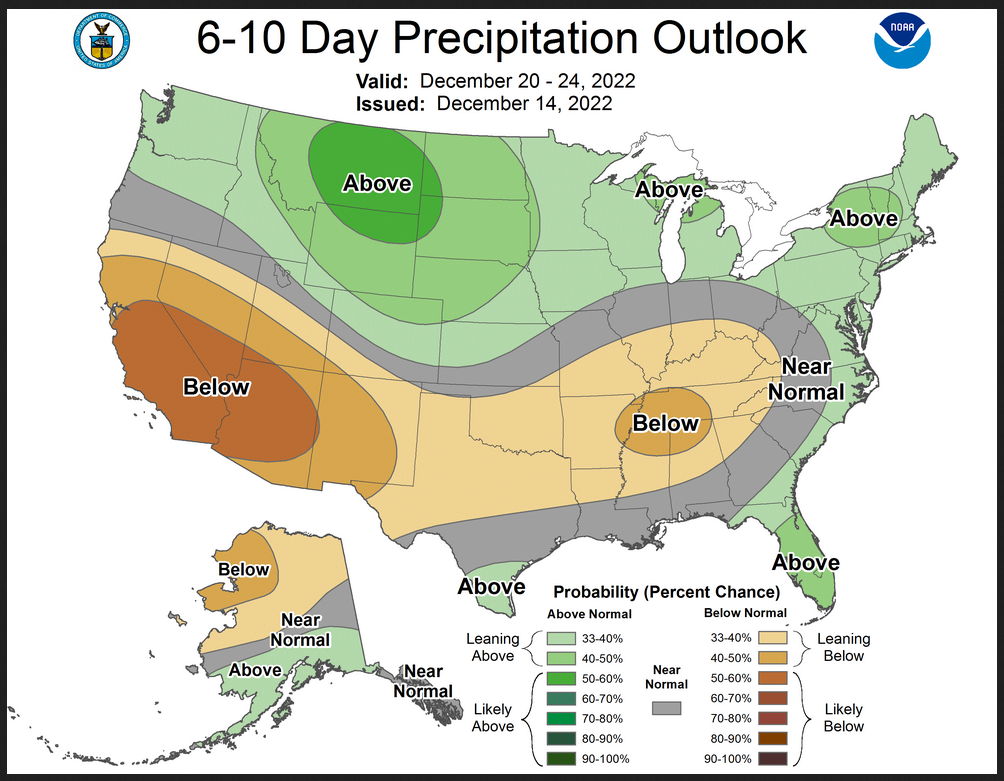
Days 6 – 10 Outlook
An outlook differs from a forecast based on how NOAA uses these terms in that an “outlook” presents information from deviation from normal and the likelihood of these deviations.
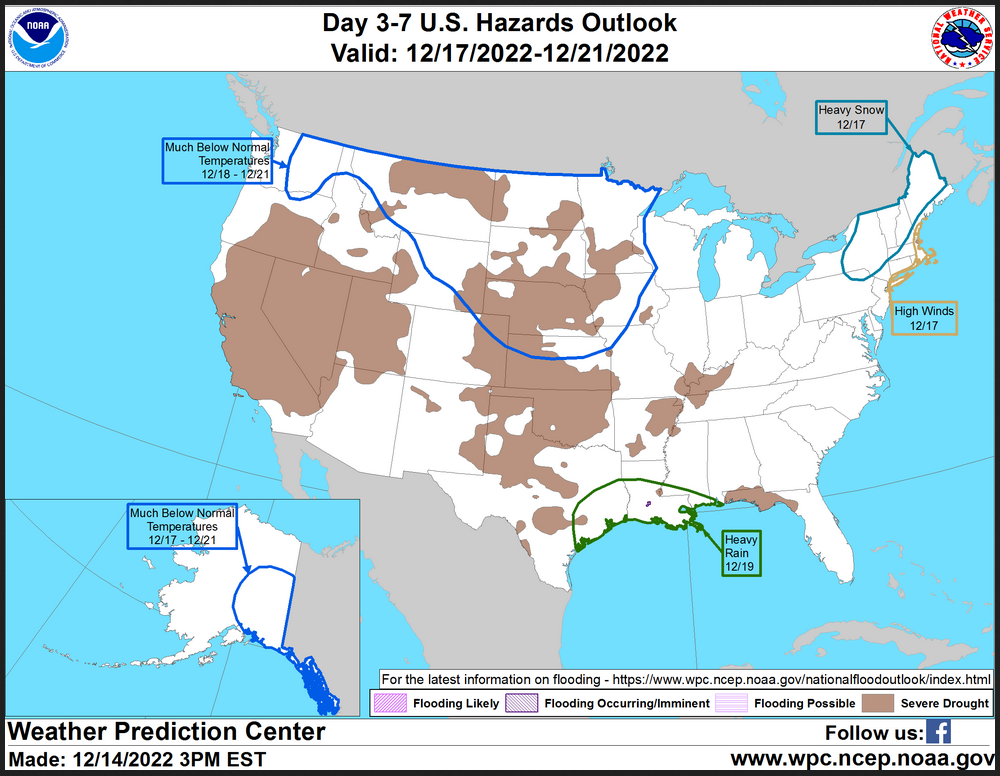
HAZARDS OUTLOOKS (I update these graphics every two days – but the reader can get an update if they want but the situation usually does not change that quickly)
Click h ere for the latest complete Day 3 -7 Hazards forecast which updates only on weekdays. Once a week probably Monday or Tuesday I will update the images. I provided the link for readers to get daily updates on weekdays. Use your own judgment to decide if you need to update these images.
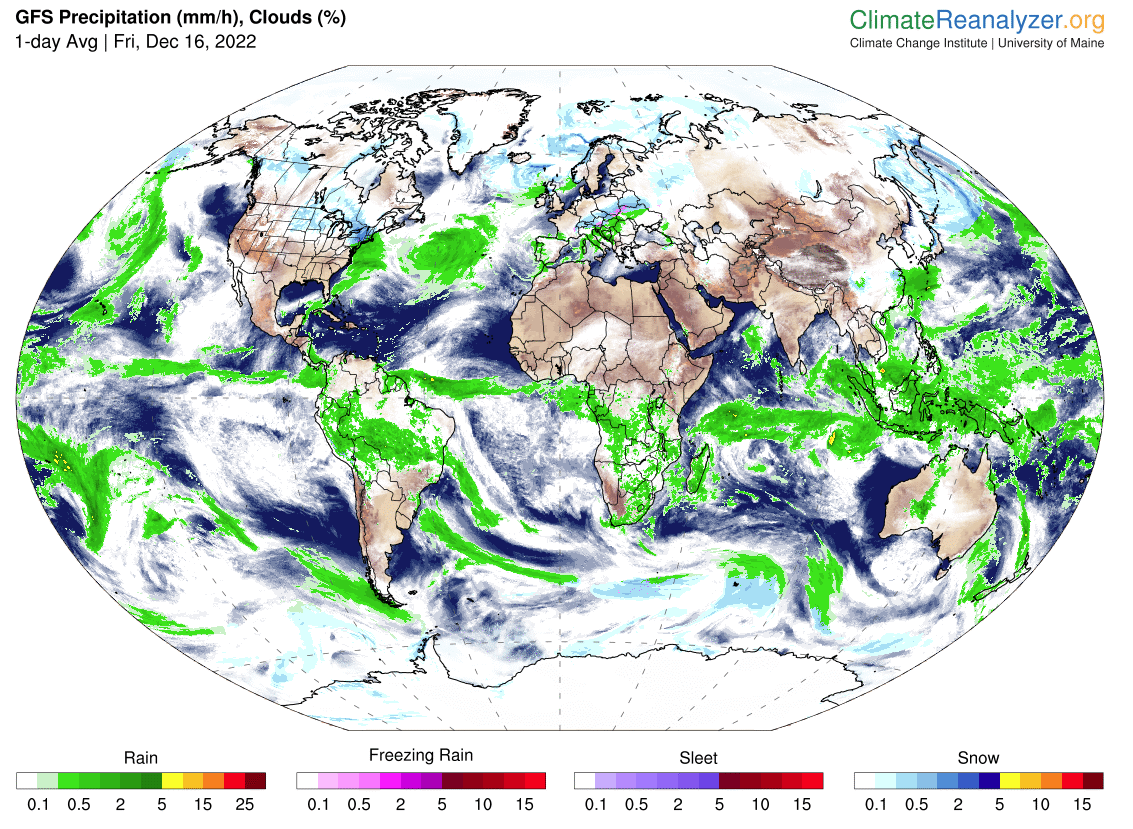
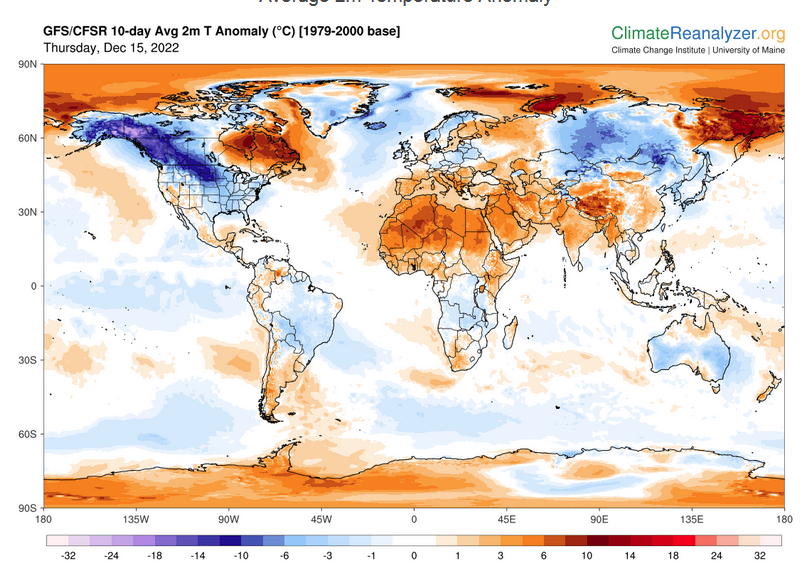
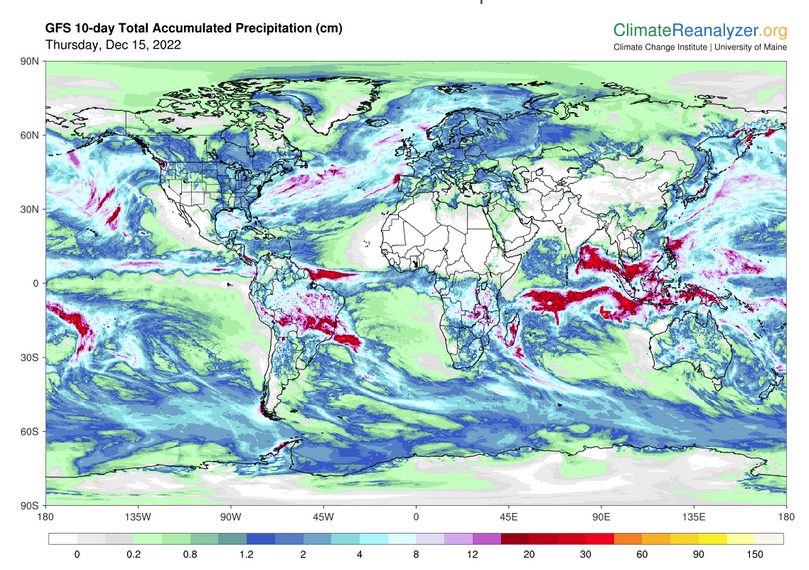
Worldwide Weather (The U.S. is part of the World so the U.S. forecast is included in these maps)
Below maps are the short-term forecast for precipitation and 10-day forecast for temperature and precipitation. I update the Day 1 Forecast daily and the ten-day forecasts every two days. A ten-day forecast is not likely to change much in 24 hours. But if you are looking at an out-of-date version of this article the current forecast maps can be obtained HERE.
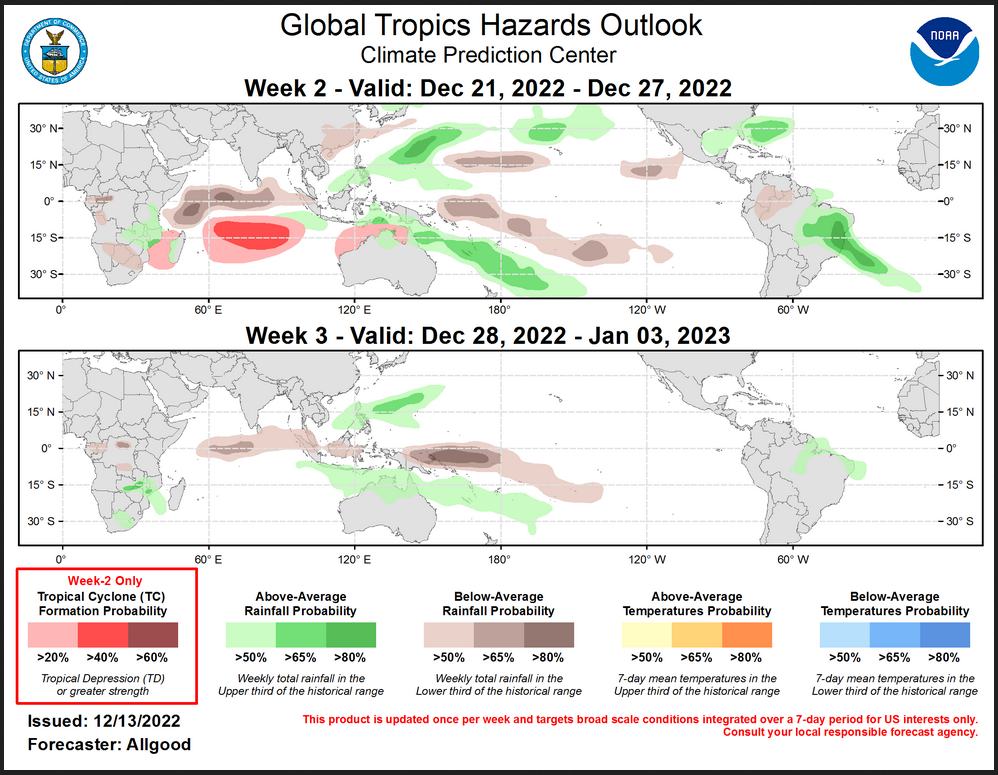
 Worldwide Tropical Forecast
(This graphic updates on Tuesdays) If it has not been updated, you can get the update by clicking here This is a new approach and covers weeks 2 and 3 not weeks 1 and 2. It has more information but I am having trouble getting used to it. As usual, it comes with a discussion which is below
Detailed Maps and Reports for the Western Atlantic and the Pacific Oceans
Below are four maps that summarize the situation for the Atlantic, Eastern, Central Pacific, and Western Pacific. Additional information can be accessed by clicking HERE
First the Atlantic
Click to view the forecast map and have access to additional information https://www.nhc .noaa.gov/gtwo.php?basin= atlc&fdays=5
Then Eastern Pacific
Click to view the forecast map and have access to additional information https://www.nhc.noaa.gov/gtwo.php?basin=epac&fdays=5
Then Central Pacific
Click to view the forecast map and have access to additional information https://www.nhc.noaa.gov/gtwo.php?basin=cpac&fdays=5
And the Western Pacific
Click to view the forecast map and have access to additional information https://www.metoc.navy.mil/jtwc/jtwc.html
Some Longer U.S. Intermediate-Term Outlooks
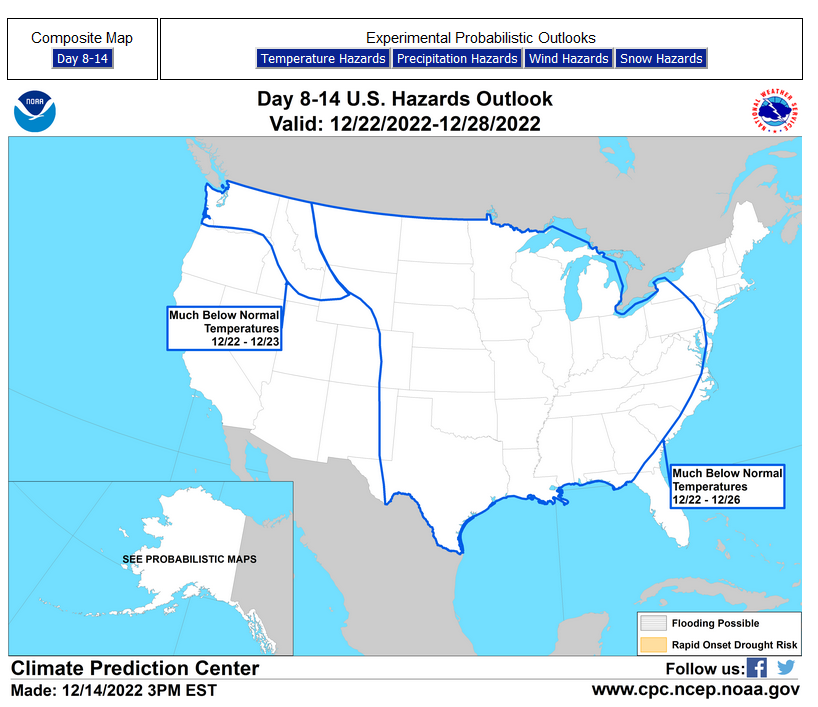
Links to “Outlook” maps and discussions for Two time periods. Days 8 – 14, and Weeks 3 and 4.
You have to click on the links because they do not update automatically and I do not want to have stale images in the article. But it is not difficult to click on a link and you get a large image plus a discussion. On Fridays in a separate article, we will show the images and provide a link in this article that article. But remember what you will see is the images as of Friday. But here you can get the current images simply by clicking on them. Then hit the return arrow at the upper left of your screen to return to the article. You will not find this information easily anywhere else.
| Days 8 – 14 | Weeks 3 and 4 |
| https://www.cpc.ncep.noaa.gov/products/predictions/814day/ | https://www.cpc.ncep.noaa.gov/products/predictions/WK34/ |
| These graphics update and can be clicked on to enlarge. You can see where the weather will e | |
–
Month to Date Information
Month to date Temperature can be found at https://hprcc.unl.edu/products/maps/acis/MonthTDeptUS.png
Month to date Precipitation can be found at https://hprcc.unl.edu/products/maps/acis/MonthPNormUS.png